Concept
OBV
OBV, also known as on-balance volume, OBV-Modified, is a Volume & Order Flow concept. The Library holds 1 implementation, a working definition you can pull into Quant.
The standard OBV indicator
OBV exactly as classically defined: the faithful reference build of the original formula, free to run in Quant.
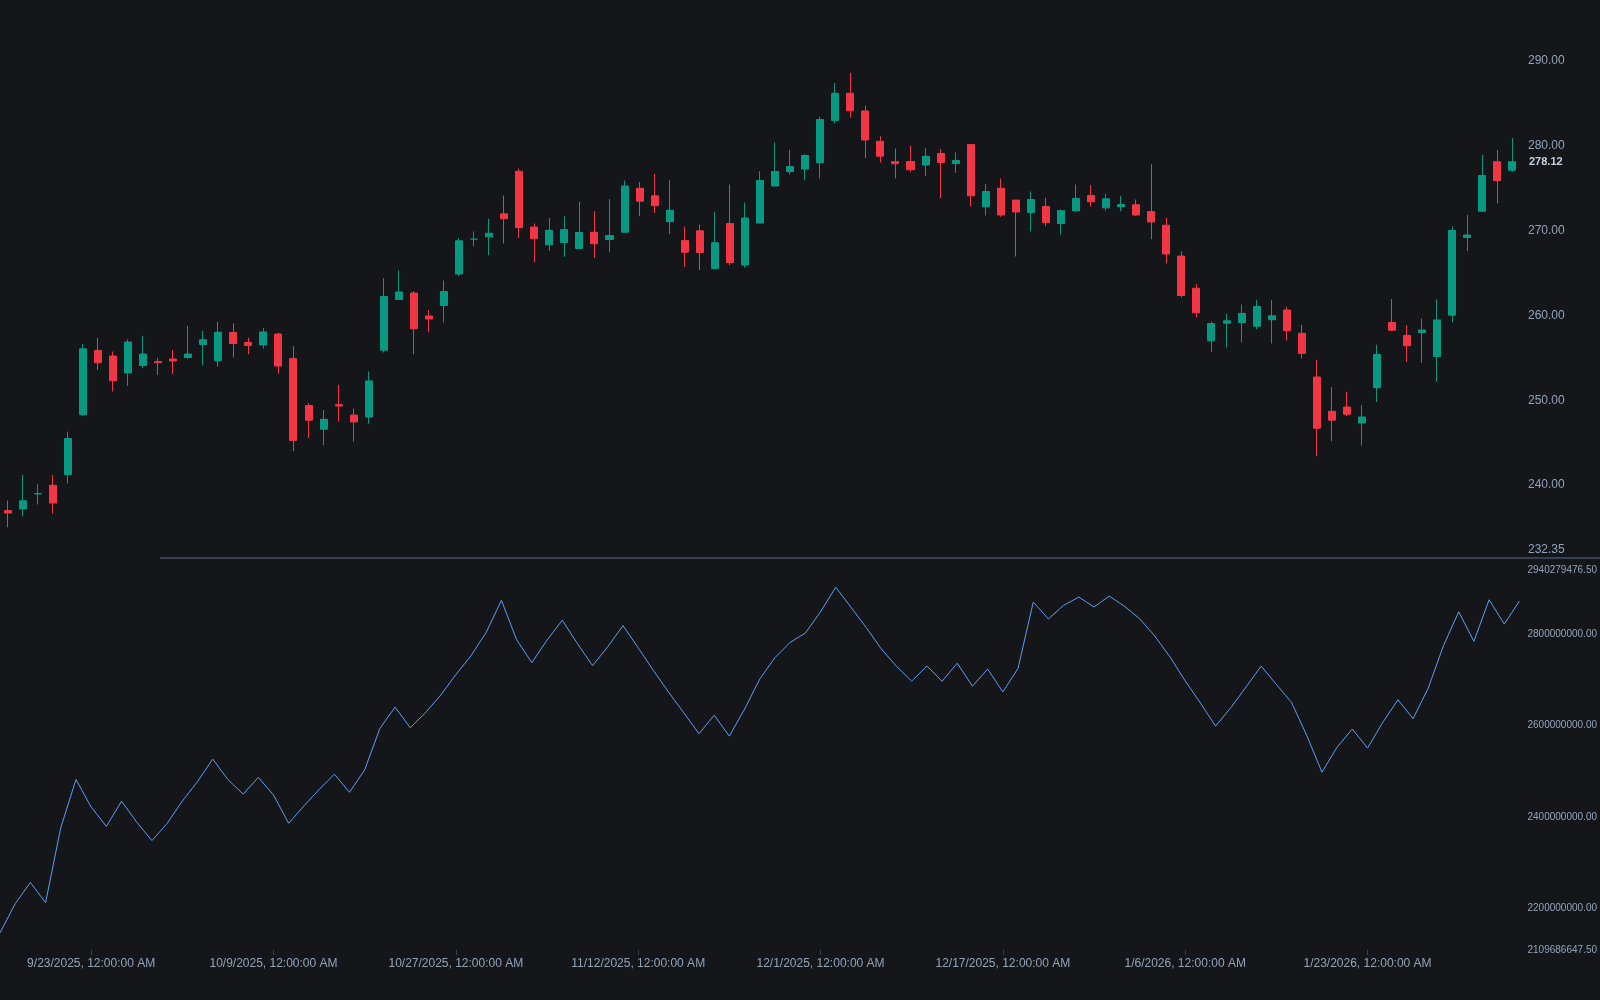
What is OBV?
OBV (on-balance volume) is a cumulative volume line introduced by Joe Granville in 1963. The rule is deliberately simple: if a bar closes above the prior close, add its entire volume to a running total; if it closes below, subtract it; if the close is unchanged, do nothing. Every bar's volume is treated as all buying or all selling based purely on the close-to-close direction, which makes OBV a blunt but assumption-light proxy for whether volume is flowing with advances or with declines.
The line's absolute value is meaningless, since it depends on where your data starts; the information is in its slope, its swings, and its agreement with price. When price makes a new high and OBV confirms with its own high, the advance is carrying participation. When price makes an extreme that OBV refuses to match, that OBV divergence suggests the move is running on thinner volume. Granville's premise was that volume precedes price, so he also watched OBV break its own trendline or range ahead of price. The crude assignment rule is the known weakness: a bar barely positive on huge volume counts as fully bullish, so most traders read OBV alongside structure rather than alone.
Granville himself is half the story. His thesis, that smart money accumulates quietly and the public arrives late, made OBV the tracking instrument for the footprints: the line trending while price ranges was his signature evidence of accumulation or distribution in progress. He became one of the most famous market commentators of his era, his pronouncements moving markets outright in the early 1980s before some spectacular missed calls humbled the legend. The indicator outlived the showmanship because its core mechanic, compounding direction and participation into one auditable line, asks a question every era keeps needing answered.
The modern ecosystem treats OBV as raw material as much as a finished tool. Divergence detectors automate the swing comparisons; transformed variants normalize the unbounded line, an RSI of OBV being the common construction, so threshold and zone logic can apply; moving-average overlays and range-break reads systematize Granville's early-break thesis; and multi-line ribbons pair OBV with its intrabar-weighted cousins. The permanent caveats travel with all of them: the all-or-nothing signing, sensitivity to a single giant bar, and volume feeds whose quality, on tick-count proxies especially, bounds everything the line can honestly claim.
How to calculate OBV
OBV needs only closes and volume, built bar by bar from an arbitrary starting value, commonly zero.
- 1Compare the current close to the prior close.
- 2If the close is higher, add the bar's full volume to the previous OBV value; if lower, subtract it; if equal, carry the previous value forward.
- 3Plot the running total and ignore its absolute level. Read direction, swing highs and lows, and trendlines drawn on the line itself.
- 4Compare OBV's swings with price's swings: confirmation supports the trend, and non-confirmation flags a divergence worth investigating.
- 5Optionally normalize: an RSI or Z-score of the OBV series converts the unbounded line into a bounded oscillator, enabling zone and threshold reads the raw line cannot support.
How it's calculated
A running cumulative total of volume, added on up closes and subtracted on down closes, showing whether volume pressure is flowing into or out of a market.
Only the slope and shape of the line matter; the absolute level depends on the arbitrary seed and on where the data series starts.
OBV-Modified (OBV-M) smooths the raw line with a moving average and adds a signal line, commonly 7 and 10 period EMAs.
Published by Joseph Granville in 1963.
How traders use it
- For trend confirmation: OBV printing new highs alongside price argues the advance is participated in, while a flat OBV under a rising price warns the rally is volume-light.
- For divergences: a price extreme that OBV fails to match is an early caution, handled like any regular divergence: a warning that needs price confirmation, not a standalone reversal signal.
- For early breaks: because volume can shift before price, some traders watch for OBV to break a range or trendline first and then look for price to follow; the sequence is a tendency Granville described, not a guarantee.
- As an input series: OBV is often smoothed with a moving average or fed into oscillator-style transforms to steady its bar-to-bar jumpiness before signals are taken from it.
- In transformed variants: an RSI computed on OBV bounds the line into 0-100 territory, letting overbought, oversold and divergence conventions apply to participation the way they usually apply to price.
OBV vs other volume flow lines
Accumulation/Distribution Line: The A/D line weights each bar's volume by where the close lands inside the bar's range, while OBV assigns all volume by close-to-close direction. They disagree most on gaps and on bars that close mid-range.
Volume Price Trend: VPT scales volume by the percentage price change instead of taking all of it, so a small up-close adds a little and a large one adds a lot; OBV is all-or-nothing.
Money Flow Index: MFI turns volume-weighted price movement into a bounded 0-100 oscillator with overbought and oversold zones; OBV is unbounded and cumulative, read through slope and divergence rather than levels.
Concept family
Volume & Order Flow
88 concepts mapped · 88 in the Library
OBV FAQ
Turn OBV into a trading strategy.
Take the implementation from this page into Quant, then build on it, backtest it on real data, and keep refining it in conversation.