Concept
Klinger Volume Oscillator
Klinger Volume Oscillator is a Volume & Order Flow concept. The Library holds 1 implementation, a working definition you can pull into Quant.
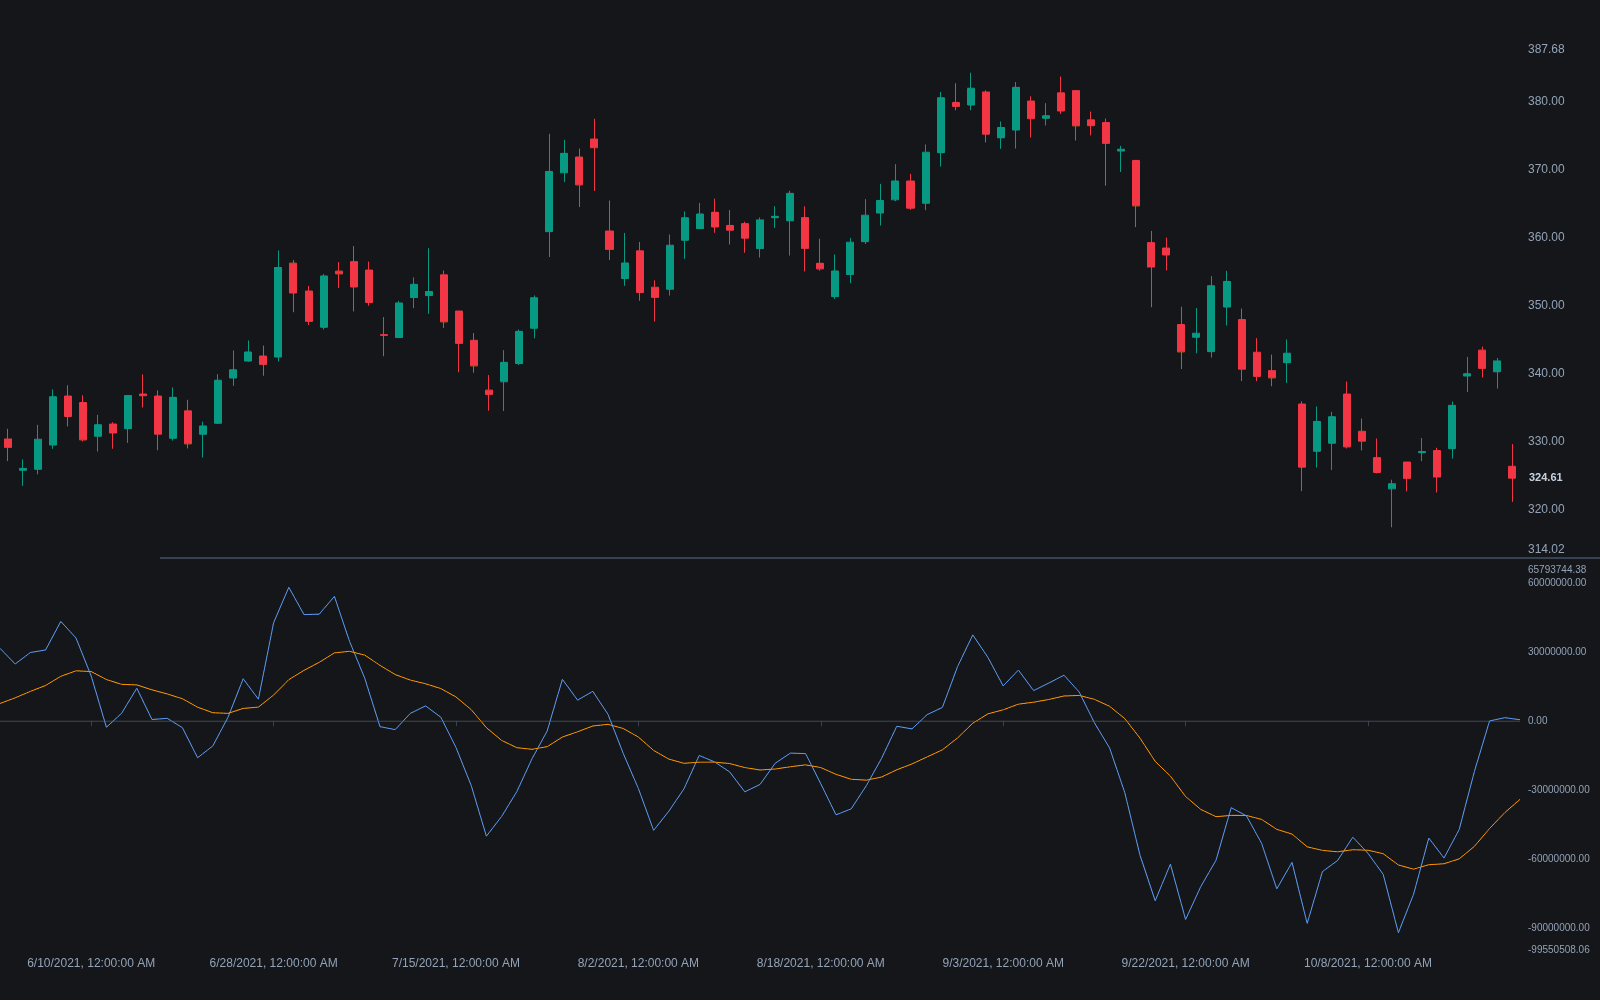
The standard Klinger Volume Oscillator indicator
Klinger Volume Oscillator exactly as classically defined: the faithful reference build of the original formula, free to run in Quant.
What is the Klinger Volume Oscillator?
The Klinger Volume Oscillator (KVO) is a volume-flow oscillator developed by Stephen Klinger in the 1990s. Each bar contributes a quantity called volume force: the bar's full volume, signed positive or negative by trend (whether the sum of high, low, and close rose or fell versus the prior bar) and scaled by a temper factor that compares the bar's range with the cumulative range of the current move, so volume counts for more when range behavior suggests conviction. The oscillator is the difference between a fast and a slow EMA of volume force, most commonly 34 and 55 periods, plotted with a 13-period signal line.
Klinger introduced the design through the technical-analysis press in the late 1990s, aiming at a known gap: cumulative volume lines track the long arc of accumulation and distribution but react slowly, while raw per-bar volume is too noisy to read. Signing volume by the high-low-close trend, tempering it by range behavior, and differencing two EMAs was his attempt to keep both horizons in one pane.
Klinger's stated aim was an indicator sensitive enough to register short-term shifts in money flow while still tracking the longer arc of accumulation and distribution. Readings above zero and rising suggest volume is behind the advance; an oscillator that sags while price presses higher is the classic warning that the move is losing volume support.
Its construction sets its personality. Because the trend sign flips on the high-low-close sum, single indecisive bars can flip a whole bar's volume from one side to the other, which makes raw KVO jumpy; the temper factor amplifies conviction moves but also magnifies odd bars in thin sessions. In practice the oscillator behaves best on liquid instruments, read through its signal line and zero line with trend context supplied elsewhere, and worst as a standalone trigger in chop.
How to read the Klinger Volume Oscillator
KVO plots in its own pane around zero with a signal line; the reading is regime, crosses, and divergence.
- 1Add the oscillator with its conventional settings (34/55 EMAs of volume force, 13-period signal line) beneath a chart with trustworthy volume data.
- 2Read the zero line as the flow regime: sustained time above zero says the faster money-flow consensus sits above the slower one.
- 3Use signal-line crosses as the tactical event, expecting whipsaw in ranges; most users only honor crosses aligned with the prevailing trend.
- 4Compare swings against price for divergence: a new price extreme with a weaker oscillator extreme is the fading-participation warning.
- 5Grade the instrument first: KVO inherits every quirk of the venue's volume prints, so thin sessions and synthetic feeds degrade the reading.
How it's calculated
Converts volume into a signed force based on trend direction and range expansion, then takes the difference between a fast and a slow EMA of that force.
Variants differ on the abs(): some references print VF_t = V_t × (2 × (dm_t / cm_t) - 1) × T_t × 100, which can flip the sign of the force.
Several platforms ship a simplified version that feeds raw volume, signed by whether H + L + C rose or fell, into the same 34/55 EMA difference.
Standard reading is KVO crossing its 13-period signal line and divergences against price.
How traders use it
- As a money-flow trigger: crosses above the signal line or the zero line are read as flow turning positive, and crosses below as flow turning negative; in choppy ranges these crossings whipsaw, so most users demand trend context first.
- As a divergence tool: price printing a new high while the oscillator prints a lower high flags fading participation, the same logic as other forms of volume divergence.
- As confirmation rather than a standalone system: pairing KVO direction with price structure or a trend filter, since volume-based oscillators are noisy on their own.
- As a breakout auditor: a range break accompanied by KVO expanding through zero agrees with the volume-at-breakout read that real participation funded the move, while a break on a flat oscillator invites the failed-break scenario.
- As a second opinion next to bounded flow gauges: agreement between KVO and the Money Flow Index covers both construction styles, cumulative-force and bounded-ratio, and disagreement flags that the volume story is not as clean as either alone suggests.
Klinger oscillator vs other volume-flow tools
OBV: OBV adds or subtracts whole-bar volume on the close-to-close direction and accumulates forever, a blunt but durable trend line of participation. KVO signs volume by the high-low-close trend, tempers it by range conviction, and oscillates around zero, trading OBV's simplicity for crossable, divergible structure.
Money Flow Index: MFI is a bounded 0-100 ratio of positive to negative typical-price volume, read against overbought and oversold bands. KVO is unbounded and EMA-differenced, read for crosses and divergence; the two encode volume pressure in structurally different ways.
Volume Delta: Volume delta measures buyer versus seller aggression directly from executed trades at bid and ask. KVO infers direction from bar anatomy, one signed number per bar, which any chart can compute but which cannot see the intrabar auction delta actually records.
Concept family
Volume & Order Flow
88 concepts mapped · 88 in the Library
Klinger Volume Oscillator FAQ
Turn Klinger Volume Oscillator into a trading strategy.
Take the implementation from this page into Quant, then build on it, backtest it on real data, and keep refining it in conversation.