
Technical Analysis

Broadening Wedges – Rising, Falling, Bullish, or Bearish?

By Jacob Denbrock9 min readReviewed by Christopher Downie on
Broadening Wedges – Rising, Falling, Bullish, or Bearish?

A broadening wedge is a price formation between two diverging boundaries that slope in the same direction. A rising version has upward-sloping support and resistance; a falling version has downward-sloping boundaries. Rising and falling describe the geometry, not a guaranteed bearish or bullish outcome.

These patterns can help frame a research question about expanding swings, partial moves and breakouts. To make that question testable, define the boundaries, confirmation timing, exit conditions and costs before judging the result. An attractive historical drawing is not a complete trading strategy.

Broadening Wedges Versus Other Formations

The defining feature is an increasing distance between the upper and lower boundaries as time advances. Extending straight boundaries backward places their intersection to the left of the formation. This differs from a conventional converging wedge or triangle pattern, whose range narrows toward an intersection ahead of the pattern.

FormationBoundary directionsRange behavior
Rising broadening wedgeBoth upward; upper boundary rises fasterWidens over time
Falling broadening wedgeBoth downward; lower boundary falls fasterWidens over time
Converging wedgeBoth tilt in the same direction but approach each otherNarrows over time
Parallel channelBoundaries have the same slopeApproximately constant boundary separation

Other broadening formations can have a horizontal boundary or boundaries sloping in opposite directions. Do not apply the same name to every expanding shape. Use a consistent price scale and describe slopes in price and time units; the visual angle changes when the chart is stretched.

Rising Broadening Wedges

In a rising broadening wedge, successive selected highs and lows rise, with the upper boundary increasing more quickly than the lower one. The widening range can occur within a larger trend, but the preceding trend and the eventual breakout are separate observations.

Thomas Bulkowski’s ascending broadening-wedge guidelines call for at least three peaks and three valleys touching their respective boundaries. Treat this as an explicit identification convention when using his framework. A looser rule is a different experiment and should not inherit the same historical statistics.

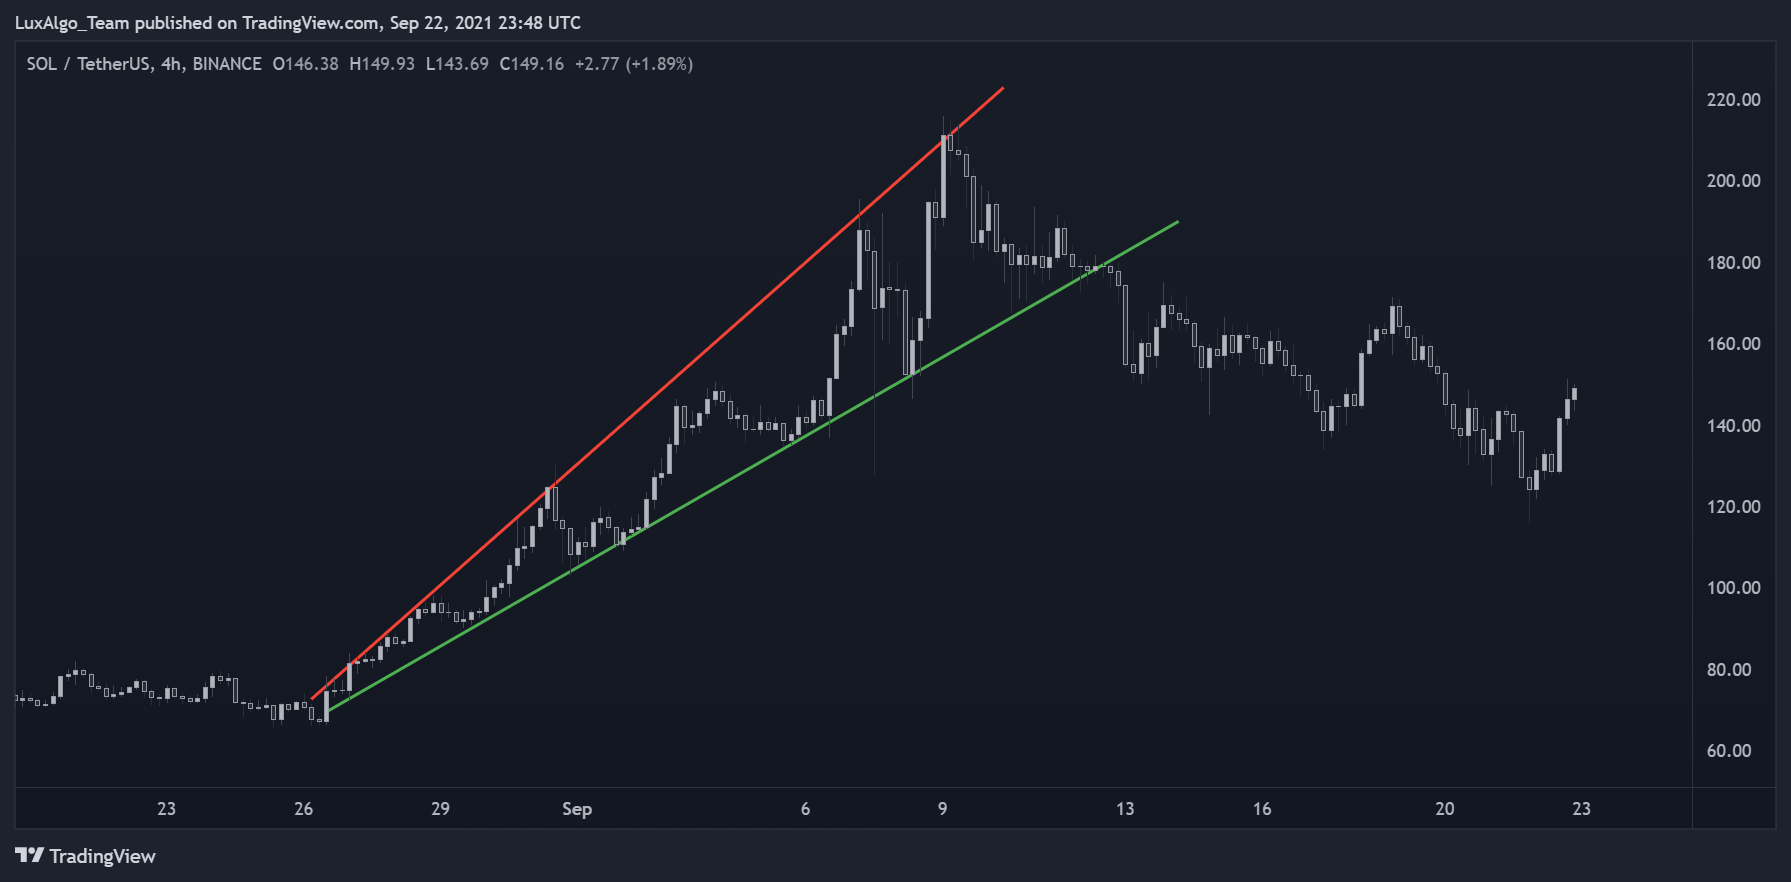
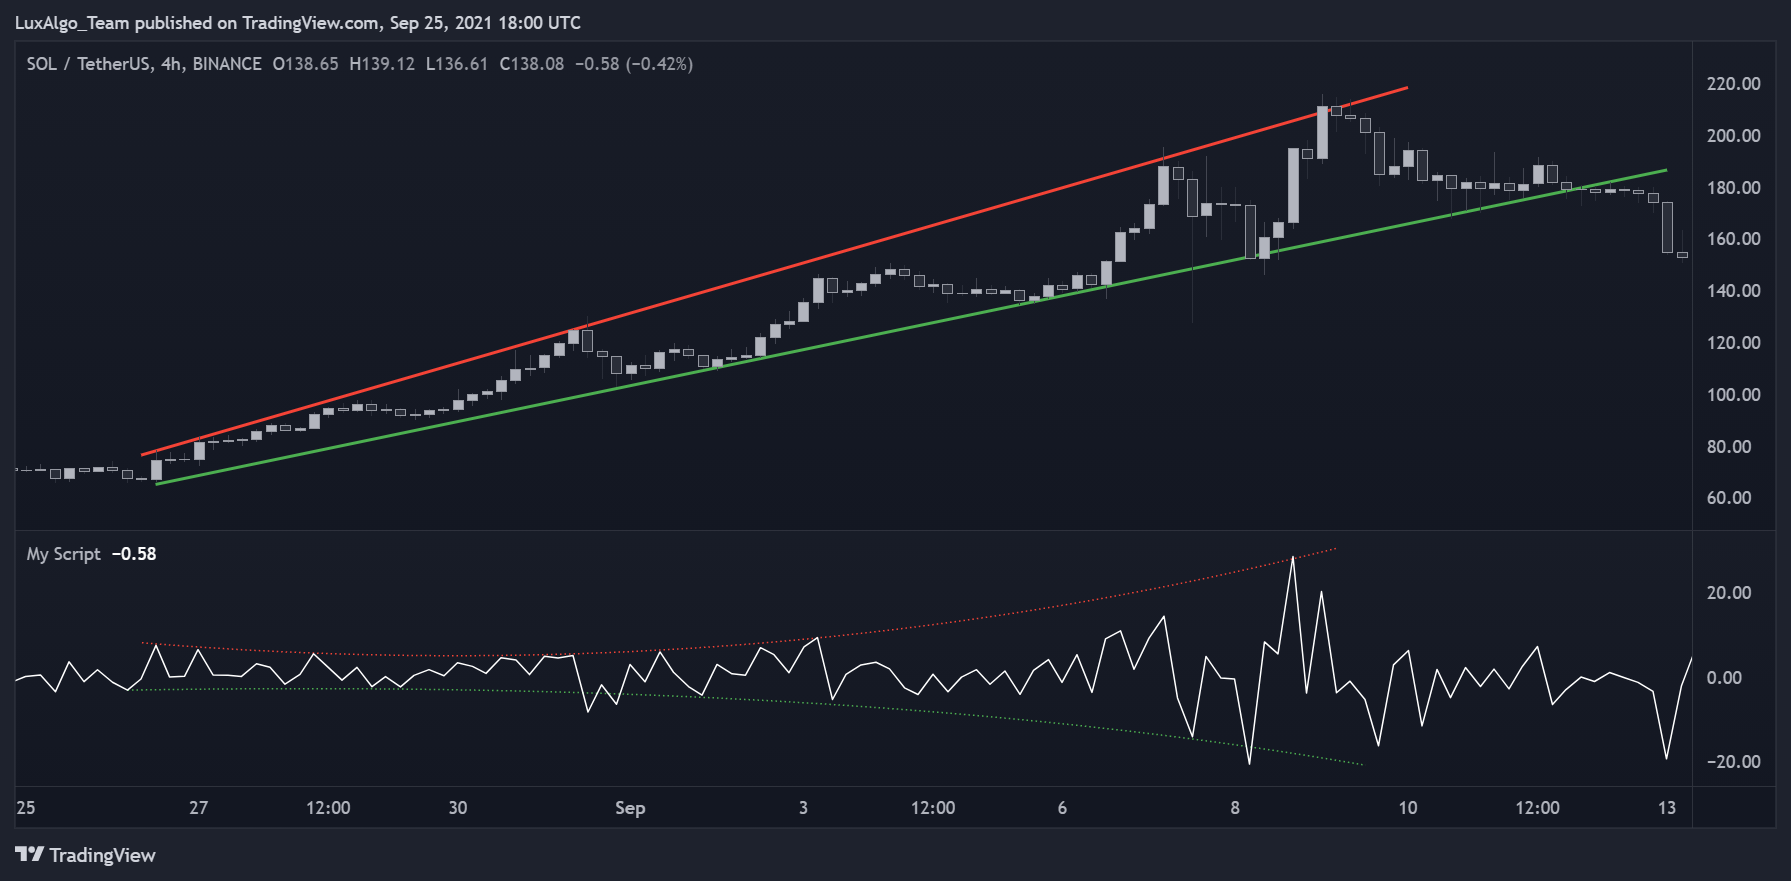
Historical Binance SOL USDT four-hour chart with rising broadening boundaries
SOL/TetherUS, four-hour Binance chart published by LuxAlgo Team on September 22, 2021. The drawn rising boundaries are followed by a move below support. This is a historical illustration, not a current setup or independently validated performance result.

Rising broadening wedges are often discussed as bearish candidates, but upward breakouts also occur. The source discusses both directions and different trading approaches. A direction label does not establish the probability of a profitable trade after fees, slippage and the chosen exit rule.

Falling Broadening Wedges

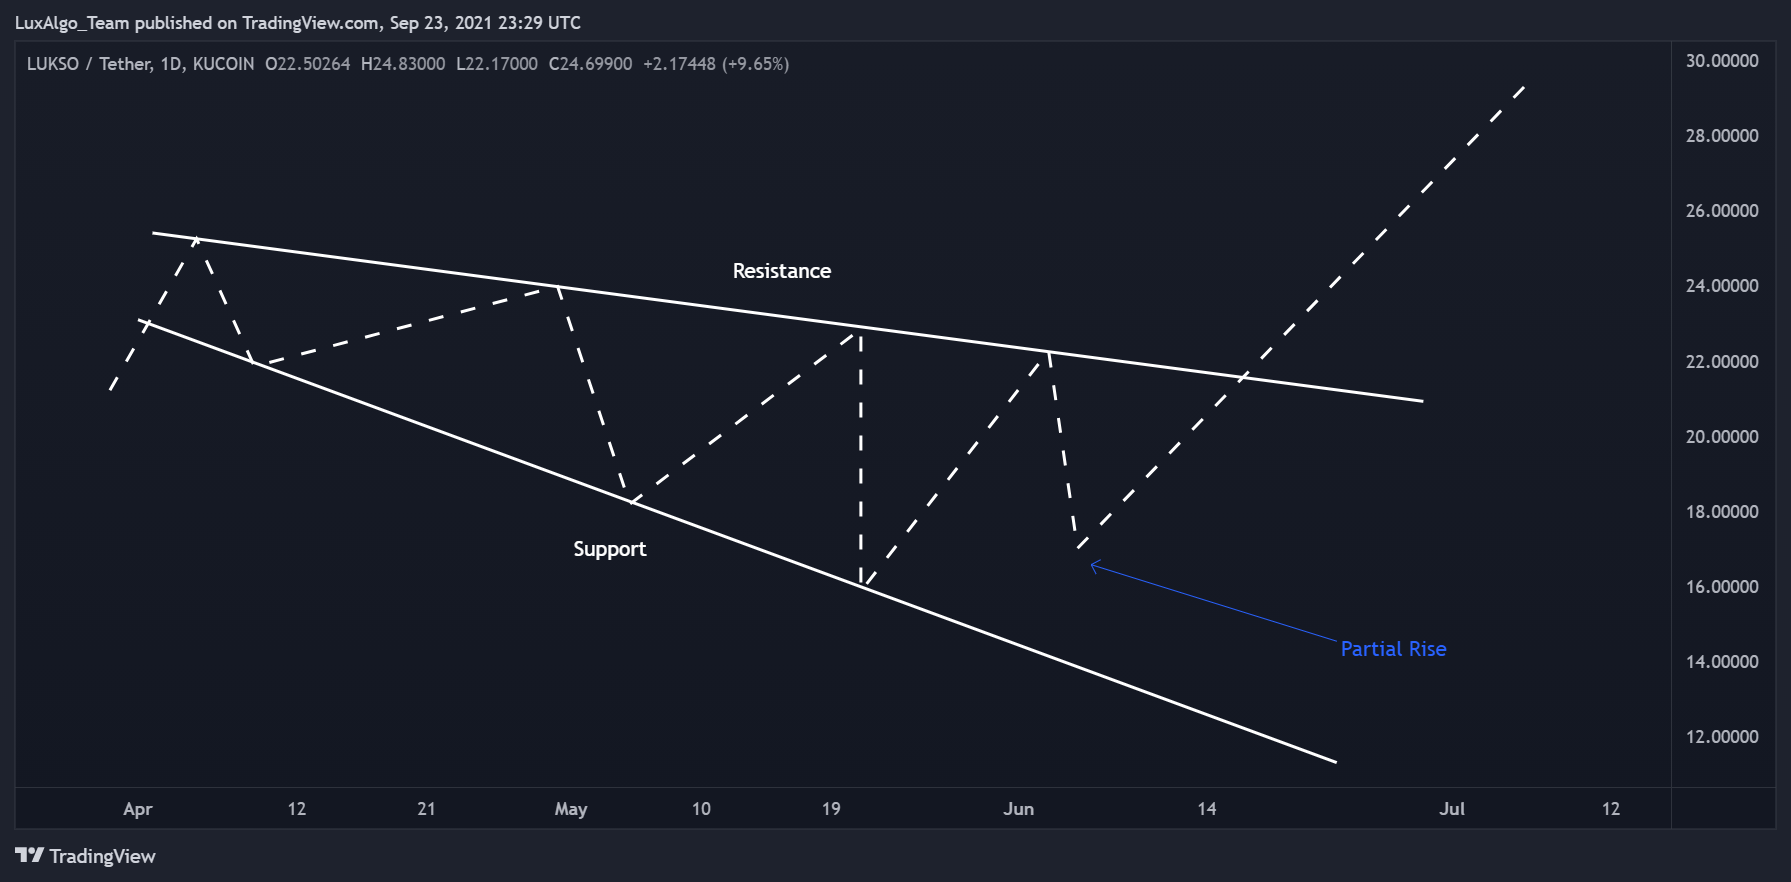
In a falling broadening wedge, selected highs and lows decline, with the lower boundary falling faster in absolute price-per-time terms. The resulting range expands downward. A move above the upper boundary is a possible bullish scenario, while continued declines or a lower-boundary break remain possible.

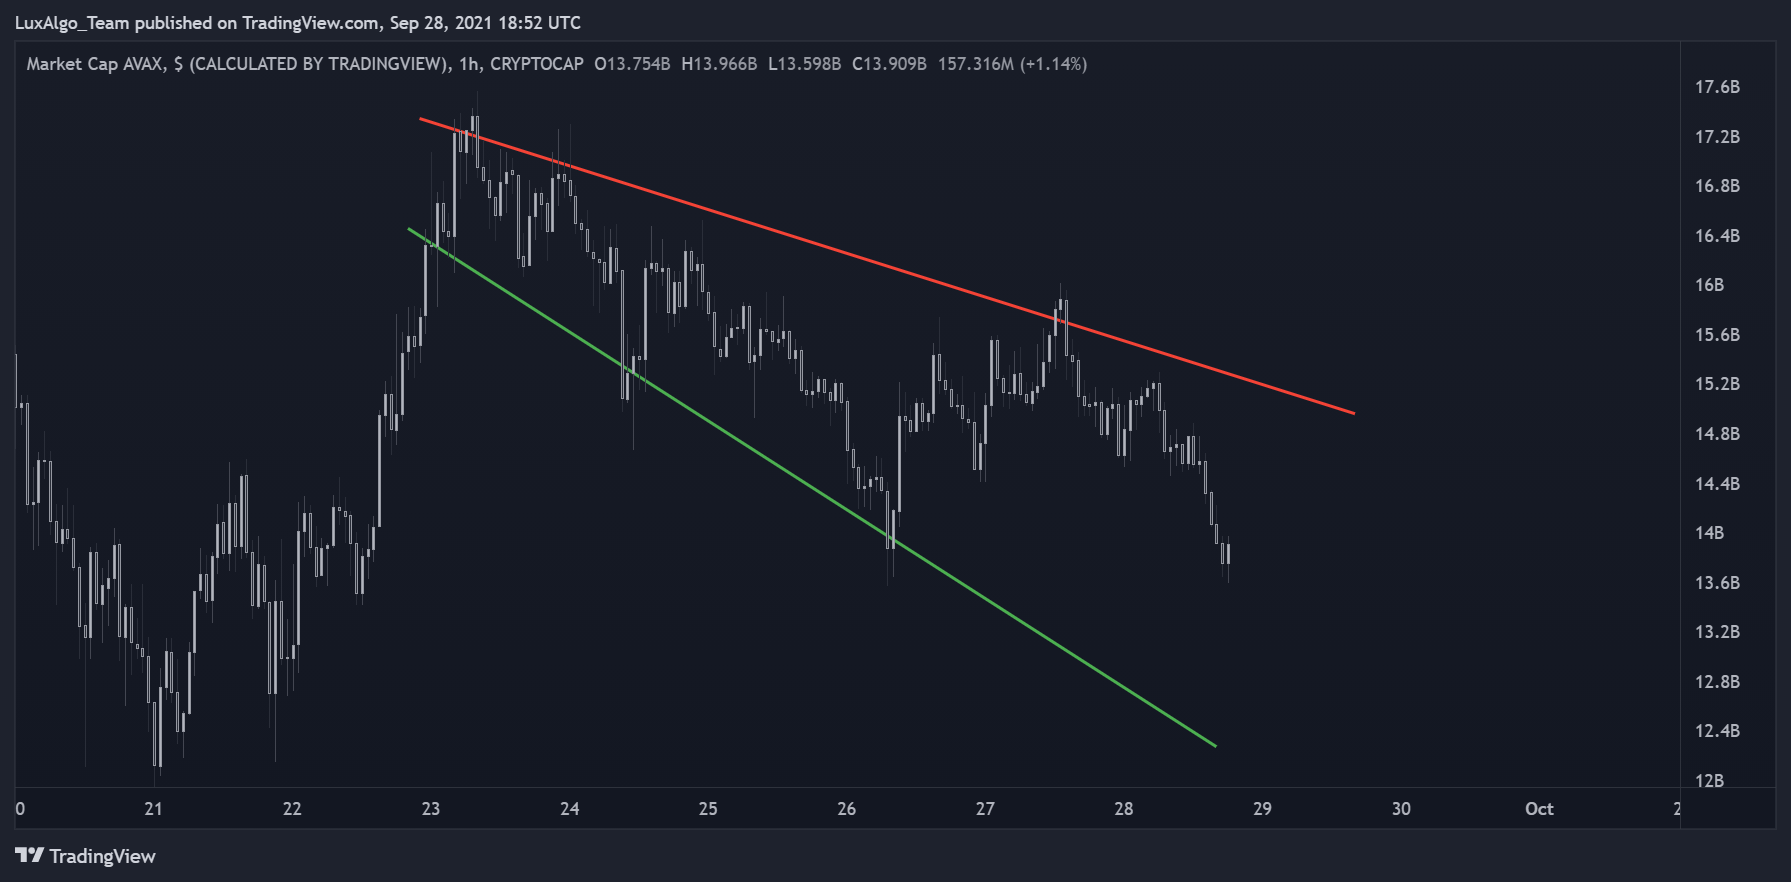
Historical hourly AVAX market-cap chart with descending broadening boundaries
AVAX market capitalization in US dollars, calculated by TradingView and displayed on an hourly CRYPTOCAP chart, published September 28, 2021. This is not a tradable AVAX price chart. A brief upper-boundary crossing is followed by a return inside the formation; it does not demonstrate a sustained profitable breakout.

Market capitalization and a tradable instrument’s price are different series. Use the actual instrument, venue and price data when evaluating entries and fills. The example above illustrates geometry and a failed continuation after a boundary crossing, not an executable trade record.

Understand Partial Rises and Partial Declines

A partial move stops short of crossing the full established formation and turns back toward the boundary it came from. It is more specific than a pause in the middle of a range. The turn must actually be observed; its eventual appearance cannot be assumed in advance.

CandidateSequenceWhat remains uncertain
Partial riseLeaves lower boundary, turns down before reaching upper boundary, returns toward lower boundaryWhether support will break and whether a short trade would be profitable
Partial declineLeaves upper boundary, turns up before reaching lower boundary, returns toward upper boundaryWhether resistance will break and whether a long trade would be profitable

Bulkowski’s partial-rise and partial-decline descriptions require an established formation first and distinguish a turn from a temporary pause. These are candidate sequences to evaluate, not guaranteed signals. Historical percentages depend on the source sample, pattern type and measurement rules.

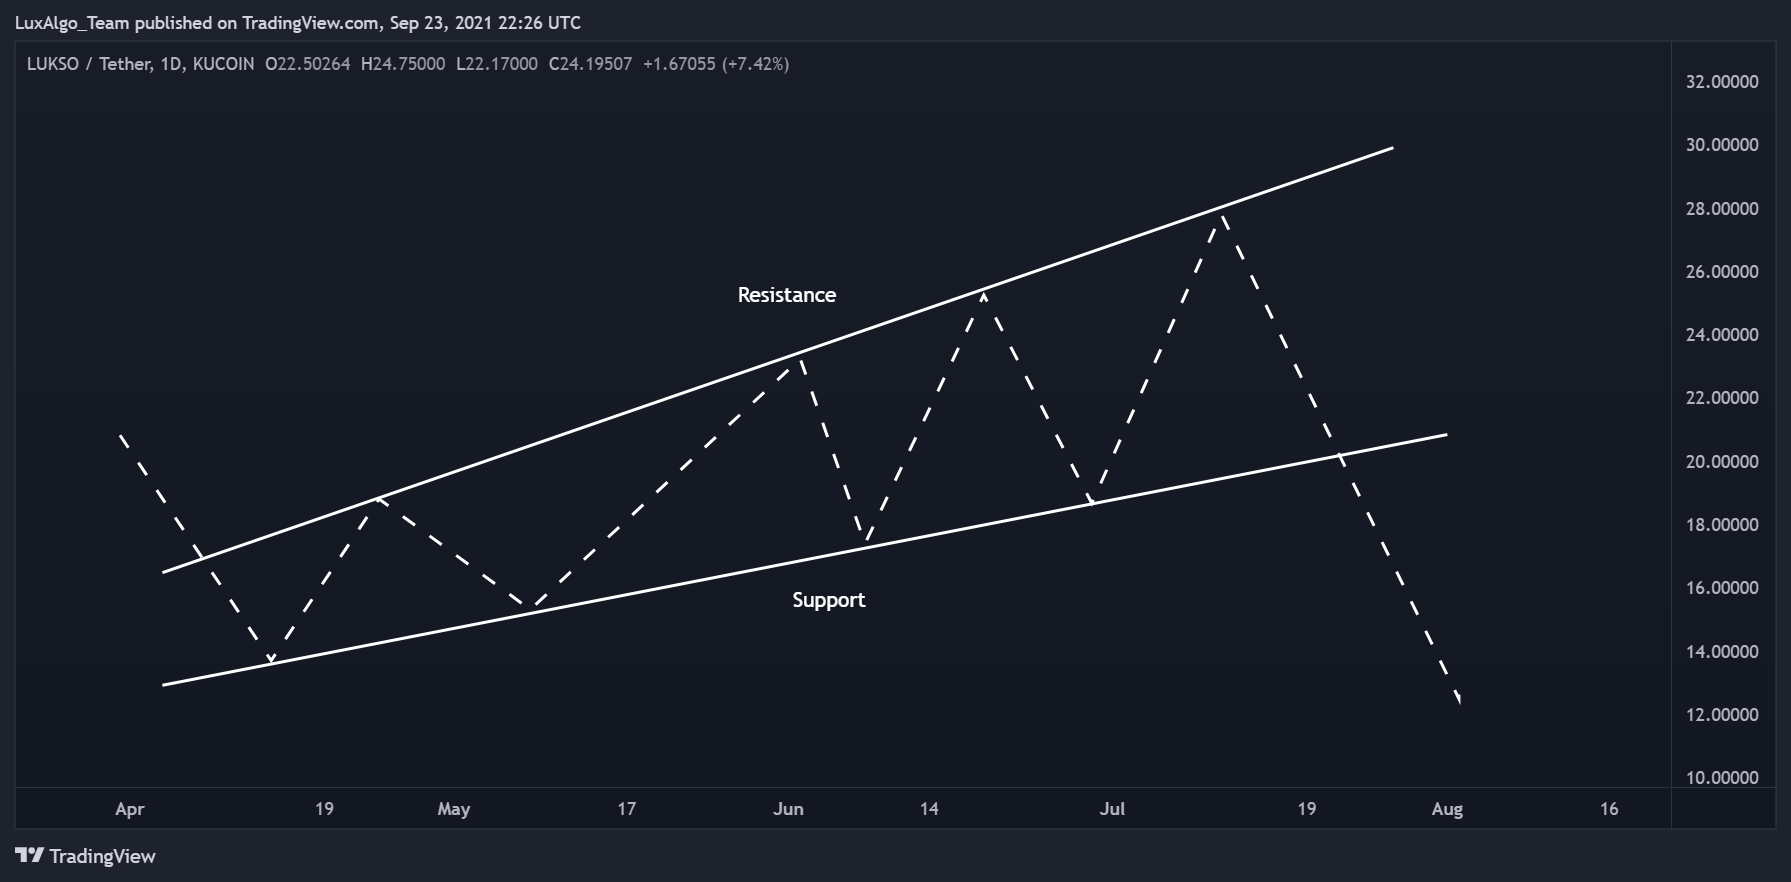
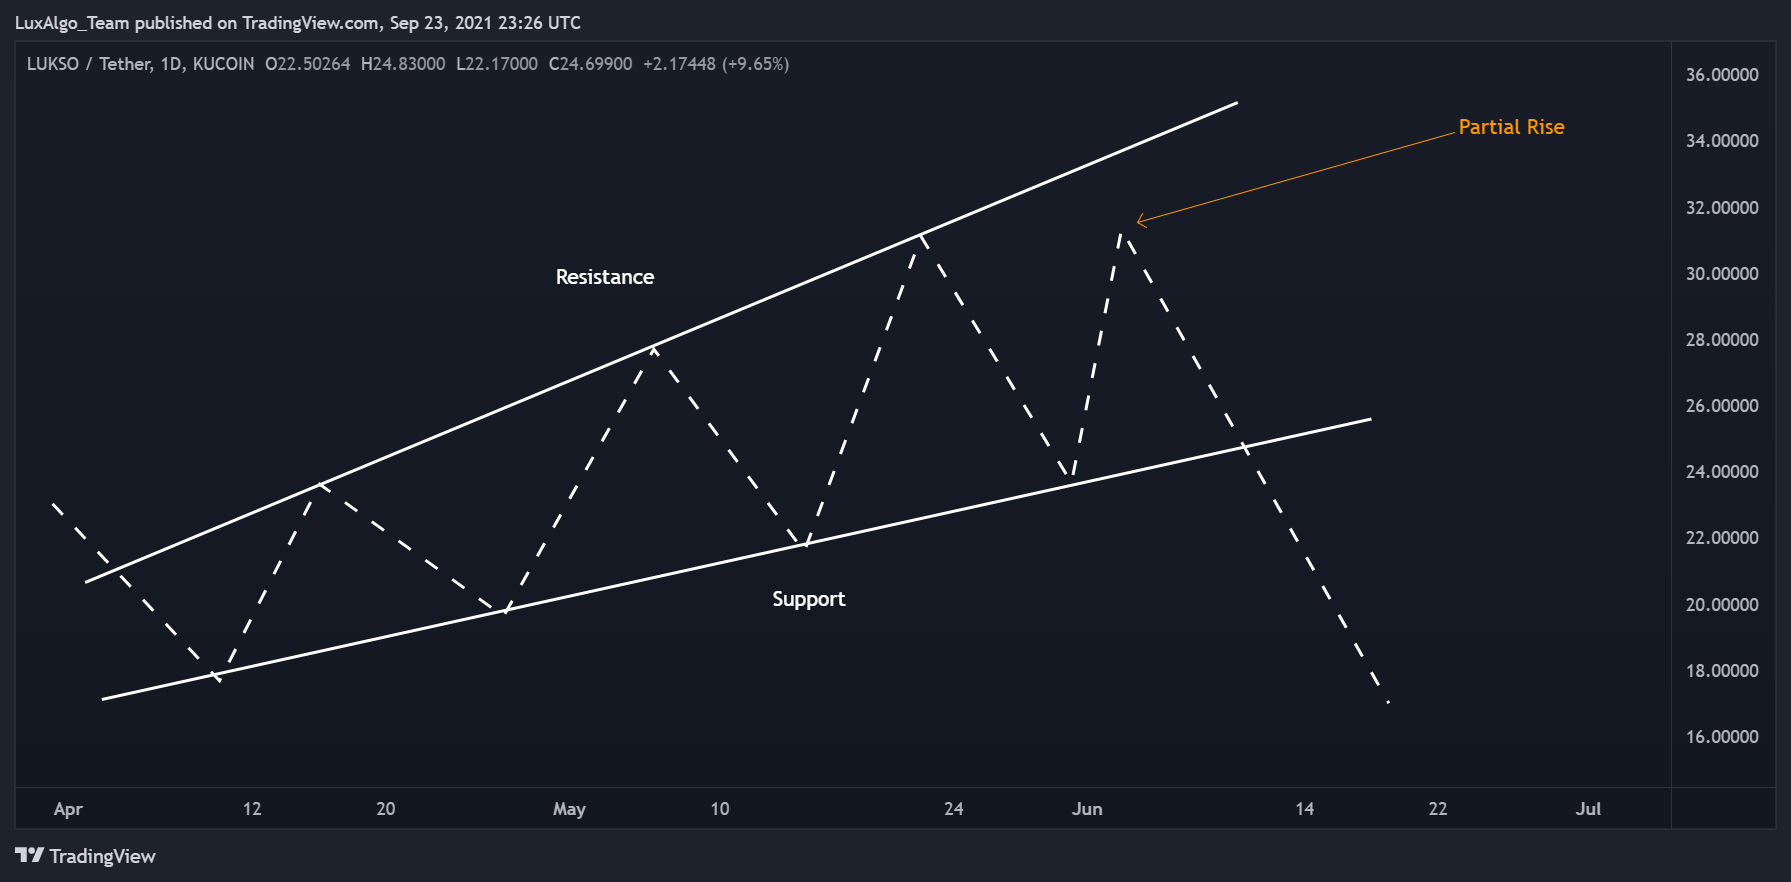
Schematic partial rise within a rising broadening wedge
Historical schematic published September 23, 2021. The dashed path rises from support, turns before resistance and returns downward. The displayed LUKSO chart axes do not make this drawn path actual price history, and the illustrated breakout is only one possible outcome.

Entering before a boundary breakout changes the tradeoff. An earlier entry may offer a different price, but it also exposes the position to a setup that never breaks out. Waiting can miss part of a move or miss the trade altogether. Compare both complete rules rather than claiming that earlier entry necessarily produces higher profits.

If swing confirmation requires later bars, preserve that delay in a test. TradingView’s repainting documentation explains why placing a confirmed pivot on an earlier chart bar does not mean the pivot was known then. The same information-timing question matters when assessing any historical pattern strategy.

Define the Breakout and the Response to Failure

A wick beyond a boundary, an intrabar crossing and a completed close beyond it are different events. State which one the rule uses, along with any tolerance or buffer. A rule that waits for the close cannot use the eventual closing value to justify an earlier fill.

  • Specify the swing-point method, minimum contacts and boundary tolerance.
  • Record the chart interval, price scale, venue and available history.
  • Define any volume condition and the comparison period used.
  • Specify whether a retest is required and what happens if it never occurs.
  • Define re-entry into the formation, an opposite break and setup expiration.
  • Retain failed and ambiguous examples alongside successful ones.

Volume can be irregular during a broadening formation. Increasing volume is a condition to test on the available feed, not a universal requirement or proof of participant intent. A result from one venue’s volume may differ from another source’s coverage.

Use Targets as Reference Levels

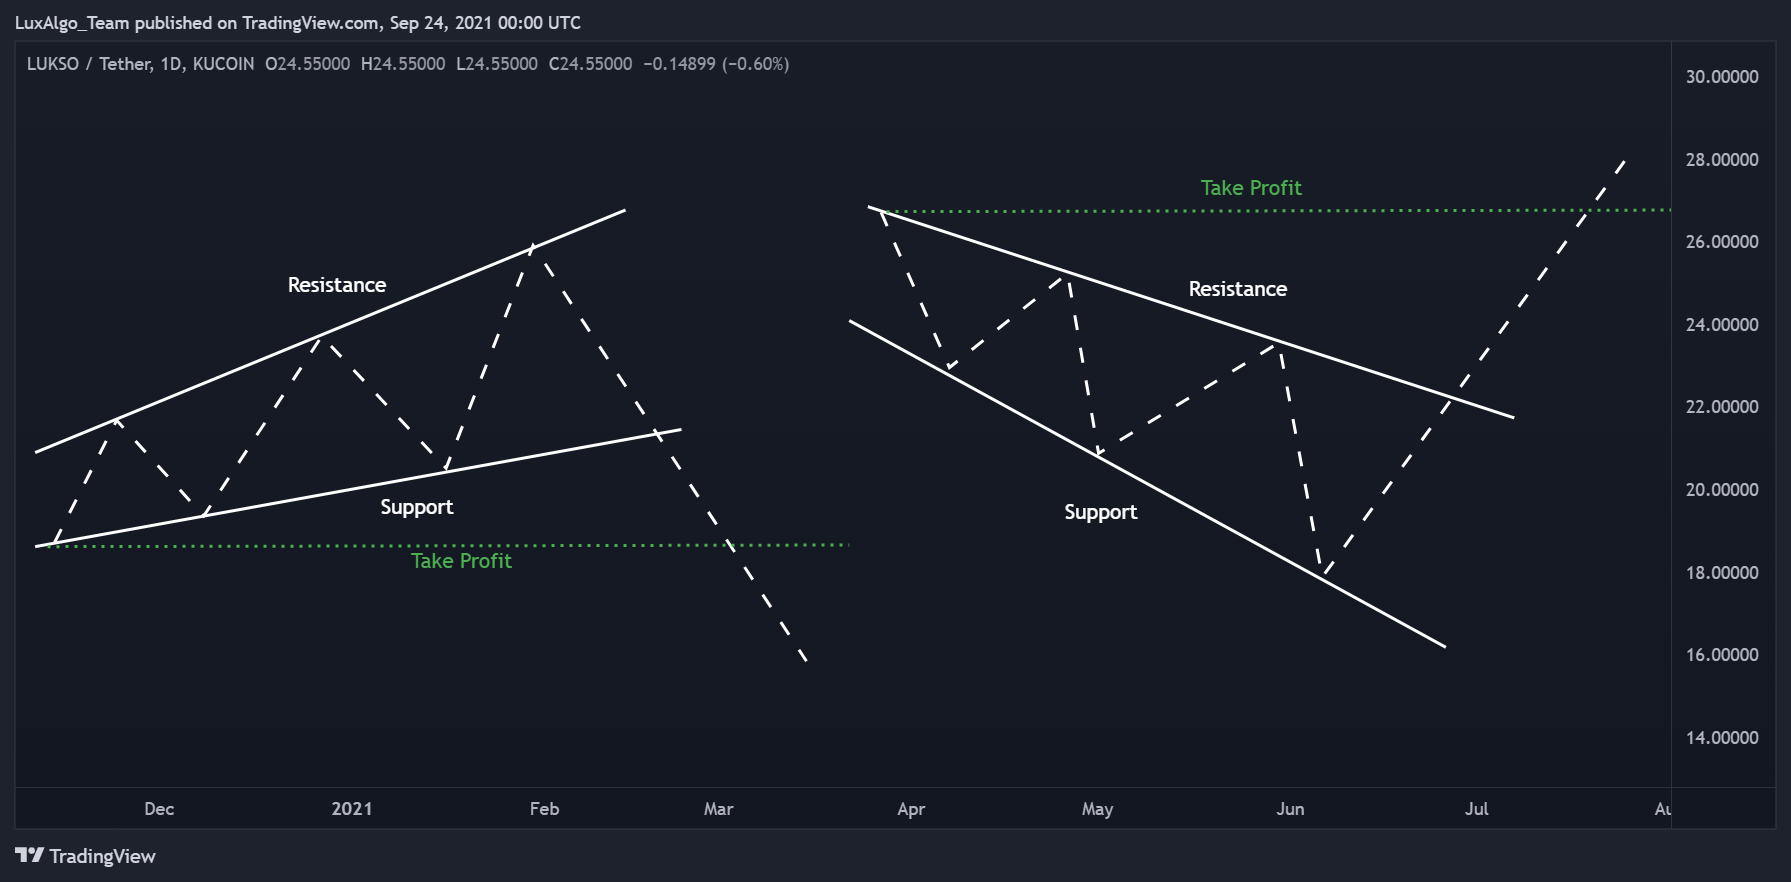
The original article illustrated the first low of a rising formation as a reference for a downward move, and the first high of a falling formation as a reference for an upward move. Those levels can organize a scenario, but neither establishes a suitable stop or guarantees that the market will reach the target.

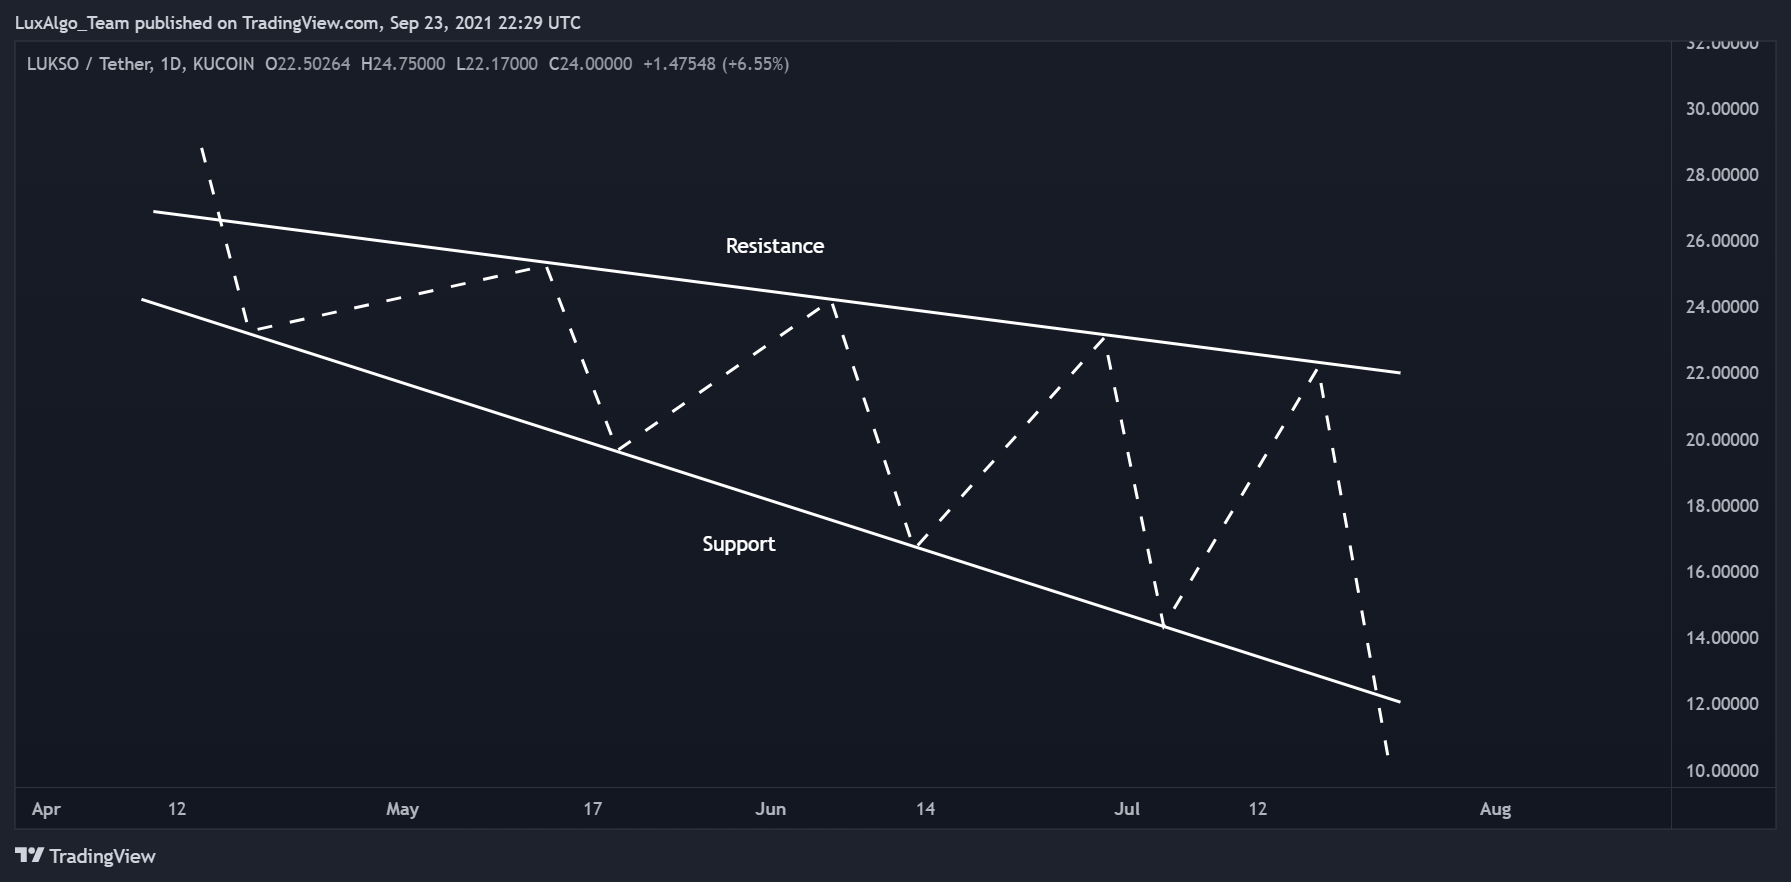
Schematic reference targets at the initial low and high of broadening wedges
Historical schematic published September 24, 2021. The labels mark proposed take-profit reference levels at earlier extremes. They are planning conventions, not forecasts, guaranteed fills or limits on loss.

The target method also depends on direction. For example, Bulkowski’s ascending-wedge page distinguishes a downward target at the lowest valley from an upward projection based on pattern height. Do not automatically transfer a rule from one breakout direction to another or treat a sample-based adjustment as a universal constant.

For a hypothetical long entry at $42, a planned exit trigger at $39 and a reference target at $48, the planned price distance at risk is $3 and the distance to target is $6 per unit. That is a 2-to-1 distance comparison before costs. It does not establish the win rate or the strategy’s expected profit.

A $150 planned price-risk amount would correspond to 50 units in that example. If an adverse gap produces an exit at $37, the price loss is $250, before fees. Investor.gov’s order guide explains that market orders do not guarantee a price and limit orders may not execute. Check the actual instrument and broker’s order behavior.

Short trades also require a separate assessment of instrument access, borrowing or funding costs and adverse price moves. Do not assume that reversing a long entry rule creates an equally executable short strategy.

Expanding Swings Are Not a Statistical Variance Test

A widening price envelope describes boundary separation. It does not by itself prove heteroscedasticity, which concerns changing variance under a specified statistical model. Likewise, parallel boundaries do not prove homoscedasticity or constant volatility.

The result depends on what is measured. Dollar price changes, percentage returns and residuals around a fitted trend are different series. A rising price level can increase dollar fluctuations without the same increase in percentage variability. Define the series, model and observation window before making a claim about variance.

Volatility clustering is also a distinct hypothesis about persistence in the magnitude of changes. A hand-drawn wedge or an indicator pane with an unspecified formula cannot establish it. If this is part of the research question, measure the selected return or residual series and compare periods under a consistent method.

Treat Participant Stories as Hypotheses

A common explanation describes buying impulses, profit-taking and renewed participation producing larger swings; a falling version reverses the roles. This can be an intuitive narrative, but the chart alone does not identify the traders, their valuations or their motives.

Separate what the chart shows from a proposed cause. You can observe selected highs, lows and boundary crossings. Claims about informed accumulation, contrarian valuation or a feedback mechanism require evidence beyond the shape. Broadening geometry is not proof of a deterministic market process.

Test a Defined Wedge Rule in LuxAlgo

Start in LuxAlgo’s native charts with a narrow question: does a specified confirmation rule improve the outcome of a defined setup on a particular instrument and timeframe? Keep the initial development period separate from a later evaluation period and preserve unsuccessful alternatives.

LuxAlgo native multi-chart workspace for comparing trading setups
Use current native charts to compare defined experiments. The earlier TradingView examples are historical illustrations, while this image shows the current LuxAlgo chart workspace.

Ask Quant, our coding agent to help express a supported hypothesis with explicit boundary, confirmation, exit and sizing rules. Inspect the generated code and run it manually. Review strategy settings, costs and individual trades to verify that the implementation matches the intended experiment.

Check native data coverage and history before comparing results. The documented US-equity source is Cboe EDGX rather than a consolidated all-venue feed. Changing the symbol, interval or assumptions changes the experiment and requires another run.

LuxAlgo’s TradingView toolkits are separate from native charts. The legacy Backtesting Assistant is also distinct from the current native strategy workflow. Follow the documentation for the tool and platform actually being used.

Organize related experiments and retain the wedge definition, confirmation timing and test assumptions in your notes.

Frequently Asked Questions

What is a broadening wedge?

It is a formation between diverging support and resistance boundaries that slope in the same direction. The distance between them expands over time.

Is a rising broadening wedge always bearish?

No. Rising describes the boundary geometry. Both upward and downward breakouts can occur, and profitability depends on the full entry, exit, sizing and cost rules.

What is the difference between a partial rise and a partial decline?

A partial rise starts at the lower boundary and turns down before reaching the upper boundary. A partial decline starts at the upper boundary and turns up before reaching the lower boundary. Both require an established formation and an observed turn.

Does an expanding wedge prove increasing volatility?

Not by itself. Boundary separation, return variance and volatility clustering are different measurements. Specify the series and statistical method before drawing that conclusion.

How can LuxAlgo help test broadening wedges?

Use native charts and Quant to express a supported rule with explicit confirmation, exits and sizing. Inspect generated code and run it manually, then review costs, individual trades and a later evaluation period.

Learn to trade smarter.

Market analysis and techniques that build your edge, one email a week.

Don’t worry, no spam here. See our privacy policy for more info.

Jacob Denbrock
Jacob Denbrock

CCO at LuxAlgo. 20 years of content creation experience, Jacob runs LuxAlgo's content team, brand growth, and hosts live shows showcasing his expertise in trading & LuxAlgo tools.

Read next