Concept
Broadening Formation
Broadening Formation, also known as megaphone, right-angled, broadening wedge, is a Chart & Candlestick Patterns concept. The Library holds 1 implementation, a working definition you can pull into Quant.
Top Broadening Formation indicator
The top custom implementation, built on the original standard Broadening Formation formula.
1 total
From studying Broadening Formation to trading it: take the implementation below into Quant and backtest it instantly.
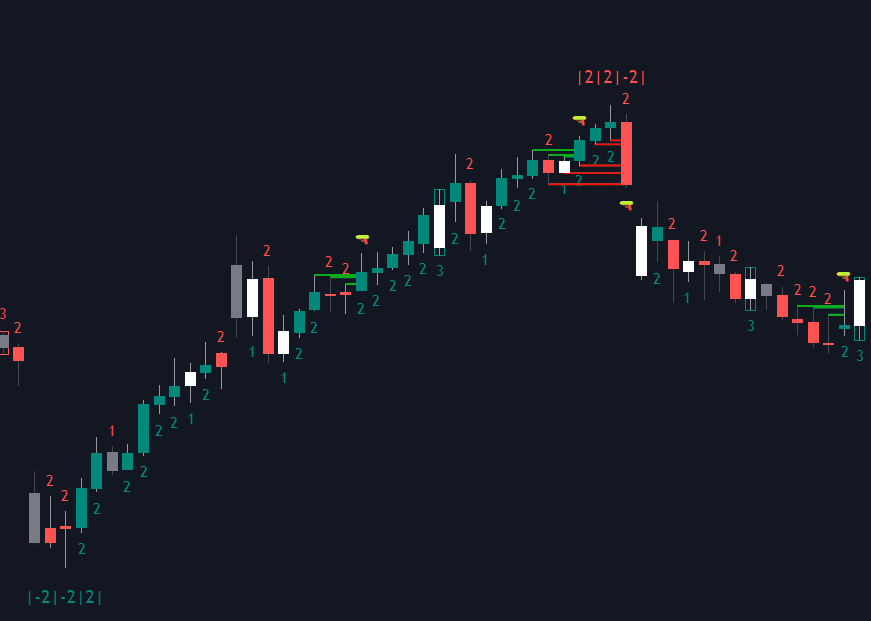
What is a Broadening Formation?
A broadening formation, the megaphone, is a pattern of expanding swings: successive higher highs and lower lows contained by two diverging trendlines. It is the structural opposite of a triangle: instead of coiling toward an apex, each swing overshoots the last and volatility widens. Right-angled variants flatten one boundary (a flat top against falling lows, or a flat bottom against rising highs), and the broadening wedge tilts both diverging lines in the same direction.
Its meaning is genuinely contested. The classical literature, from Schabacker through Edwards and Magee, treated broadening tops as bearish reversal structures typical of emotional, late-stage markets; modern pattern references catalogue both reversal and continuation outcomes depending on which boundary finally breaks. What the formation does establish is regime, not direction: disagreement is widening, stops on both sides are being run, and tight-stop entries are fighting the environment.
The pattern's reputation has evolved with its literature. Edwards and Magee considered true broadening tops relatively rare and linked them to the speculative extremes around major market peaks, with the late 1920s as the canonical setting. Thomas Bulkowski's later statistical cataloguing treats the broadening family in all its variants as ordinary patterns with breakout-direction tendencies and measured-move arithmetic rather than omens. More recently, Rob Smith's 'The Strat' built a bar-by-bar trading method around broadening structure, reading charts as nested expansions built from inside bars, directional bars, and outside bars.
Mechanically, expansion is what failed containment looks like. Each boundary break finds stops and momentum entries, the move overshoots, and the opposing side fades it harder, so every swing travels further than the last. The practical content is therefore mostly about risk: measured objectives exist for the eventual break, but the dependable information is that volatility is rising and strategies tuned to quiet conditions degrade inside it.
How to identify a broadening formation on a chart
The megaphone is defined by its touches, so identification is mostly careful line drawing.
- 1Count at least five swing touches, commonly three highs and two lows or the reverse, with each successive high above the last and each successive low below the last.
- 2Draw boundaries through the highs and lows and check they diverge; in right-angled variants one line stays flat, and in the broadening wedge both slope the same way while still spreading apart.
- 3Verify genuine alternation: swings should travel boundary to boundary, often ending in a wide-range bar or a two-bar reversal at the extreme, rather than meandering mid-pattern.
- 4Rule out the converging look-alikes: a rising or falling wedge or a triangle narrows toward an apex while the megaphone widens, and misdrawn boundaries are the most common labeling error.
- 5Note volume character if available: classical descriptions associate broadening patterns with irregular, often elevated activity rather than the taper that typifies coiling patterns.
How traders use it
- Fading the boundaries: selling the upper trendline and buying the lower with stops beyond the line, sized for the fact that each swing tends to exceed the previous one.
- Trading the eventual resolution: waiting for a decisive close through one boundary and taking direction from that break, since the pattern itself does not commit either way.
- As a regime flag: expanding swings mark a poor environment for tight stops and for adding to positions, so some traders reduce size or stand aside until the range stops widening.
- As a trigger frame at the extremes: boundary fades are commonly executed on a rejection signal, such as a bullish or bearish engulfing bar or a pin bar at the diverging line, rather than on touch alone.
- In Strat-style execution: traders who treat markets as nested broadening structures use the expanding map for context and enter on bar sequences such as inside bar breaks in the direction of the working swing.
Broadening formation vs adjacent patterns
Ascending/descending/symmetrical Triangle: Structural opposites. A triangle's swings shrink toward an apex, compressing volatility ahead of one resolution; a megaphone's swings grow, expressing volatility the whole way through. Compression rewards breakout patience, while expansion rewards entries at the extremes.
Rising/falling Wedge: A standard wedge's boundaries slope in the same direction and converge; a broadening wedge's boundaries share that tilt but spread apart. Converging wedges imply a coiling, often terminal move, while the broadening version implies overshoot and escalating disagreement in the slope's direction.
Double Top/bottom: A double top holds roughly one price twice, giving a defined extreme to trade against. A broadening top makes each high higher, so there is no fixed extreme, which is what makes stops harder inside megaphones.
Concept family
Chart & Candlestick Patterns
84 concepts mapped · 84 in the Library
Broadening Formation FAQ
Turn Broadening Formation into a trading strategy.
Take the implementation from this page into Quant, then build on it, backtest it on real data, and keep refining it in conversation.