Double Exponential Moving Average: Reducing Lag in Trend Analysis
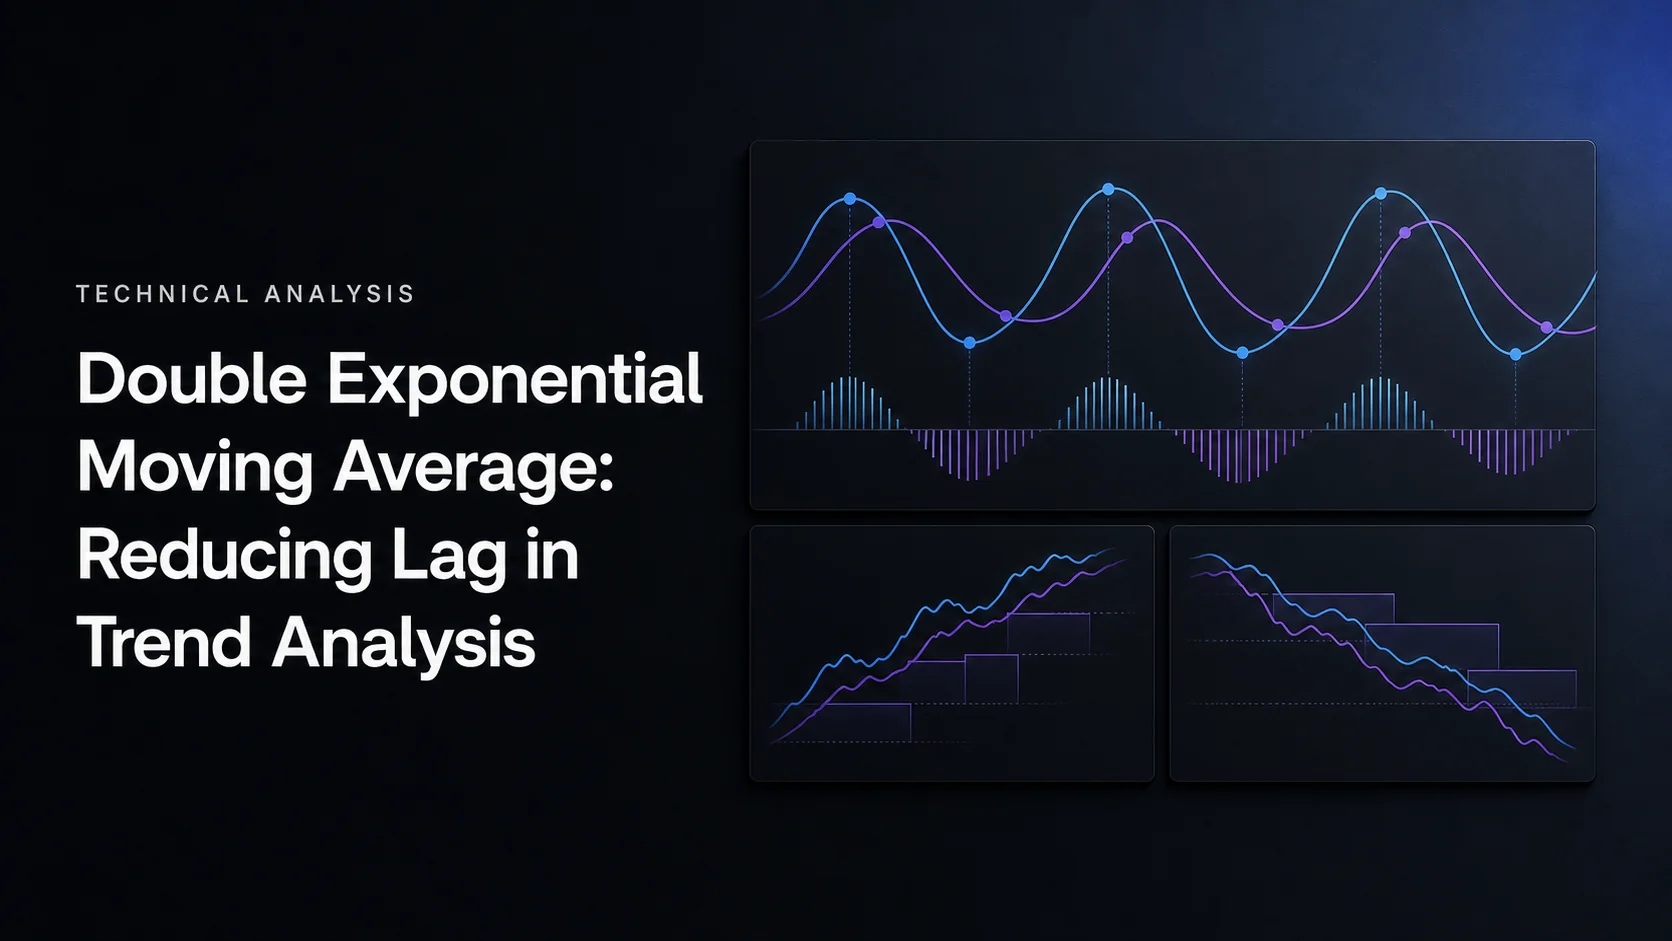
The Double Exponential Moving Average (DEMA) combines a single EMA and a twice-smoothed EMA to reduce lag: DEMA = 2 × EMA1 − EMA2. Patrick Mulloy introduced the method in 1994. It can turn sooner than a same-length EMA, but that responsiveness also makes overshoot and repeated signals in choppy markets possible.
DEMA is not simply an EMA applied twice. The second EMA alone is slower; subtracting it from twice the first EMA supplies the lag compensation. Nor does reduced lag guarantee an earlier profitable entry or a better exit. Those depend on the complete trading rules and execution.
Use Vela, our state-of-the-art charts, for price and strategy research, and ask Quant, our coding agent, to help implement and compare explicit DEMA rules. This guide covers the calculation, initialization, trading applications and the specific LuxAlgo tools that can support the workflow.
Double Exponential Moving Average Trading Strategy
The video introduces DEMA strategy ideas. Treat a chart example as a hypothesis to test with specified entries, exits and costs, rather than evidence that every crossover is profitable.
Mathematical Foundation and Calculation of DEMA
The DEMA Formula Explained
TradingView’s DEMA documentation describes two EMA passes using the same lookback. For a source price P and length N, use α = 2 ÷ (N + 1):
- EMA1 today = α × P today + (1 − α) × EMA1 yesterday.
- EMA2 today = α × EMA1 today + (1 − α) × EMA2 yesterday.
- DEMA today = 2 × EMA1 today − EMA2 today.
An equivalent expression is EMA1 + (EMA1 − EMA2). The difference between the single and double-smoothed lines is added back to EMA1. Both passes use the selected source and length consistently; “double” does not mean doubling the length or replacing α with twice its value.
The source, initialization and available history all affect the output. A close-based DEMA can change while the current bar develops. If a strategy acts on completed closes, do not use the eventual closing value for an earlier intrabar order.
Step-by-Step Calculation with a Defined Seed
Consider hypothetical AAPL closing prices of $150.25, $152.10, $151.75, $153.20, $154.15 and $152.80 for days one through six. To complete the example, add hypothetical closes of $154.00, $155.00, $156.00 and $155.50 for days seven through ten. This is an arithmetic illustration, not a dated market record.
For N = 5, α is exactly one-third. In this example, seed each EMA with the simple average of its first five valid inputs. EMA1 begins on day five at $152.29. Its day-six update is $152.29 + ($152.80 − $152.29) ÷ 3 = $152.46.
EMA2 needs five valid EMA1 inputs under this convention, so it begins on day nine. A six-price example can show EMA1 but cannot finish this particular two-stage initialization. Other software may use a first-value seed or additional prior history and produce earlier values.
| Day | Close | EMA1 | EMA2 | DEMA |
|---|---|---|---|---|
| 5 | $154.15 | 152.290000 | Not initialized | Not initialized |
| 6 | $152.80 | 152.460000 | Not initialized | Not initialized |
| 7 | $154.00 | 152.973333 | Not initialized | Not initialized |
| 8 | $155.00 | 153.648889 | Not initialized | Not initialized |
| 9 | $156.00 | 154.432593 | 153.160963 | 155.704222 |
| 10 | $155.50 | 154.788395 | 153.703440 | 155.873350 |
The initial EMA2 is the average of EMA1 values from days five through nine: approximately 153.160963. Day-nine DEMA is 2 × 154.432593 − 153.160963 ≈ 155.704222. Updating both EMA stages on day ten gives DEMA ≈ 155.873350.
Calculations above retain full precision internally and round only for display. Day-ten DEMA exceeds the $155.50 close; that is possible because DEMA is a corrected average, not a price bound. With this seed, the first output requires 2N − 1 bars, but that is an initialization choice rather than a universal platform rule. Allow adequate warmup when comparing implementations.
DEMA vs. EMA vs. SMA
| Property | SMA | EMA | DEMA |
|---|---|---|---|
| Construction | Mean of the latest N values | Recursive exponential weighting | 2 × EMA1 − EMA2 |
| Historical weights | Equal within the window | Positive and decaying | Correction can give older observations negative weights |
| Response | Changes as values enter and leave the window | Responds recursively to new inputs | Compensates part of the EMA delay |
| Main trade-off | Window changes and delayed response | Smoothing versus responsiveness | Less lag with possible overshoot and more whipsaws |
| Fair comparison | Same source and valid sample | Include shorter EMA alternatives | Match the full strategy, costs and turnover |
There is no universal ranking that makes SMA always the slowest and EMA always intermediate under every definition of lag. For example, an N-period SMA and a conventional EMA with α = 2/(N+1) have the same average observation age, (N−1)/2, after initialization effects settle. Their responses to jumps and changing cycles still differ.
The LuxAlgo DEMA reference emphasizes the lighter effective smoothing and potential overshoot. Compare a 20-period DEMA with both a 20-period EMA and faster EMA baselines. A same-number comparison alone can make greater responsiveness look like a free improvement.
How DEMA Reduces Lag: Mechanisms and Trade-offs
Lag Compensation, Not Double Smoothing Alone
When EMA1 is above its slower EMA2, the correction term raises DEMA above EMA1. When EMA1 is below EMA2, it lowers DEMA. This can bring the line closer to a developing move, but it can also carry the line beyond prices that have actually traded.
For a simple step-response example, suppose price and both EMA stages are initially steady at 100. Price then becomes 110 and stays there. With N = 3 and α = 0.5, the successive values are:
| Bar after change | Price | EMA1 | EMA2 | DEMA |
|---|---|---|---|---|
| 1 | 110 | 105 | 102.5 | 107.5 |
| 2 | 110 | 107.5 | 105 | 110 |
| 3 | 110 | 108.75 | 106.875 | 110.625 |
On the third bar, DEMA is above 110 even though the price never exceeded 110 in this example. A price crossing below the overshooting line therefore need not mean that price has reversed downward. Read the price series as well as the derived line.
What Responsiveness Can and Cannot Offer
A responsive average can make changes in a defined trend state visible sooner and can provide earlier signals under some crossover rules. Its slope also describes how the filtered series is changing. However, slope is not an independent measurement of future momentum, and a faster signal can be a faster false signal.
In sideways conditions, repeated crossings may increase turnover, spread costs and slippage. DEMA should not be described as reliably filtering out chop or universally reducing false positives. Confirming indicators can help define a narrower strategy, but several price-derived filters may be redundant.
When to Test DEMA
DEMA can be studied in trend-following, day-trading and swing-trading systems. Select the length and chart interval to fit a stated hypothesis rather than assuming the shortest setting is best. A 20-period daily DEMA and a 20-period five-minute DEMA represent different amounts of market history.
Higher volatility and earnings or policy announcements can generate rapid changes, but they also bring gaps, wider spreads or abrupt reversals. Reduced indicator lag does not remove those execution risks. Test event and non-event periods separately if the strategy depends on them.
Low-volume sessions and range-bound markets may generate frequent crossings without sustained movement. Major spot forex markets generally follow a 24/5 trading week, unlike 24/7 cryptocurrency venues; record the actual broker or exchange session and feed rather than assuming continuous availability.
Practical Applications of DEMA in Trend Analysis
Trend Identification
A close above a rising DEMA can define a bullish state, while a close below a falling DEMA can define a bearish state. Specify “rising,” such as DEMA today greater than DEMA yesterday or a measured change over several bars. Flat or conflicting conditions can be a separate neutral state.
A 20/50-period pair provides a possible fast/slow comparison. Define whether a signal requires the fast line to cross the slow line, both slopes to agree, or price to be on the same side. These are different rules and will produce different trades. Agreement does not guarantee a more dependable outcome.
For a bullish crossover, one explicit definition is fast DEMA above slow DEMA on the current completed bar and at or below it on the previous bar. Execute at the next price permitted by the order model. The bearish rule reverses the inequalities.
Entry, Exit and Confirmation Rules
A price close through DEMA, a two-DEMA crossover and a pullback that holds a defined zone are separate entry models. Choose one before evaluating results. Decide whether an opposite signal exits the trade, whether there is a fixed or trailing stop, and how a time-based exit interacts with a target.
RSI above 50 can be a momentum filter for a long hypothesis. MACD or volume conditions can serve other roles. Check whether the extra filter improves out-of-sample results after reducing the number of trades, rather than treating indicator agreement as independent proof.
ATR can scale an initial stop distance, but quantity must change with that distance to preserve a fixed risk budget. A wider stop does not make a trade intrinsically safer. An exit based on DEMA also differs from a resting stop order: a strategy waiting for the close may experience a large intrabar loss.
When combining daily entries with a weekly trend filter, use the weekly value available at the entry time. A completed-week rule should refer to the last completed week; using Friday’s final value for a Monday trade introduces future information.
Dynamic Support and Resistance
DEMA can be used as a moving reference for pullbacks or rallies. It is not a visible inventory of resting orders, and a steep line is not automatically stronger support. Screen angle also changes with zoom, price scale and timeframe.
Define a tolerance around the line, the permitted touch or close, and how many bars may pass before a response. A breach can be an exit or a change in the strategy state; it does not establish that a larger reversal has begun.
Distance from DEMA can describe extension, but it has no universal overbought or oversold threshold. Normalize it by price or a stated ATR if comparing different instruments. Trends can remain extended, and an overshooting DEMA can itself move across a flat price.
Using DEMA with LuxAlgo
A Verified DEMA Input in Targets For Many Indicators
Targets For Many Indicators includes DEMA among its selectable sources. Its published source calculates the two EMA stages and combines them as 2 × EMA1 − EMA2. Source A and Source B can be compared using CrossOver, CrossUnder, Cross or Equal conditions.
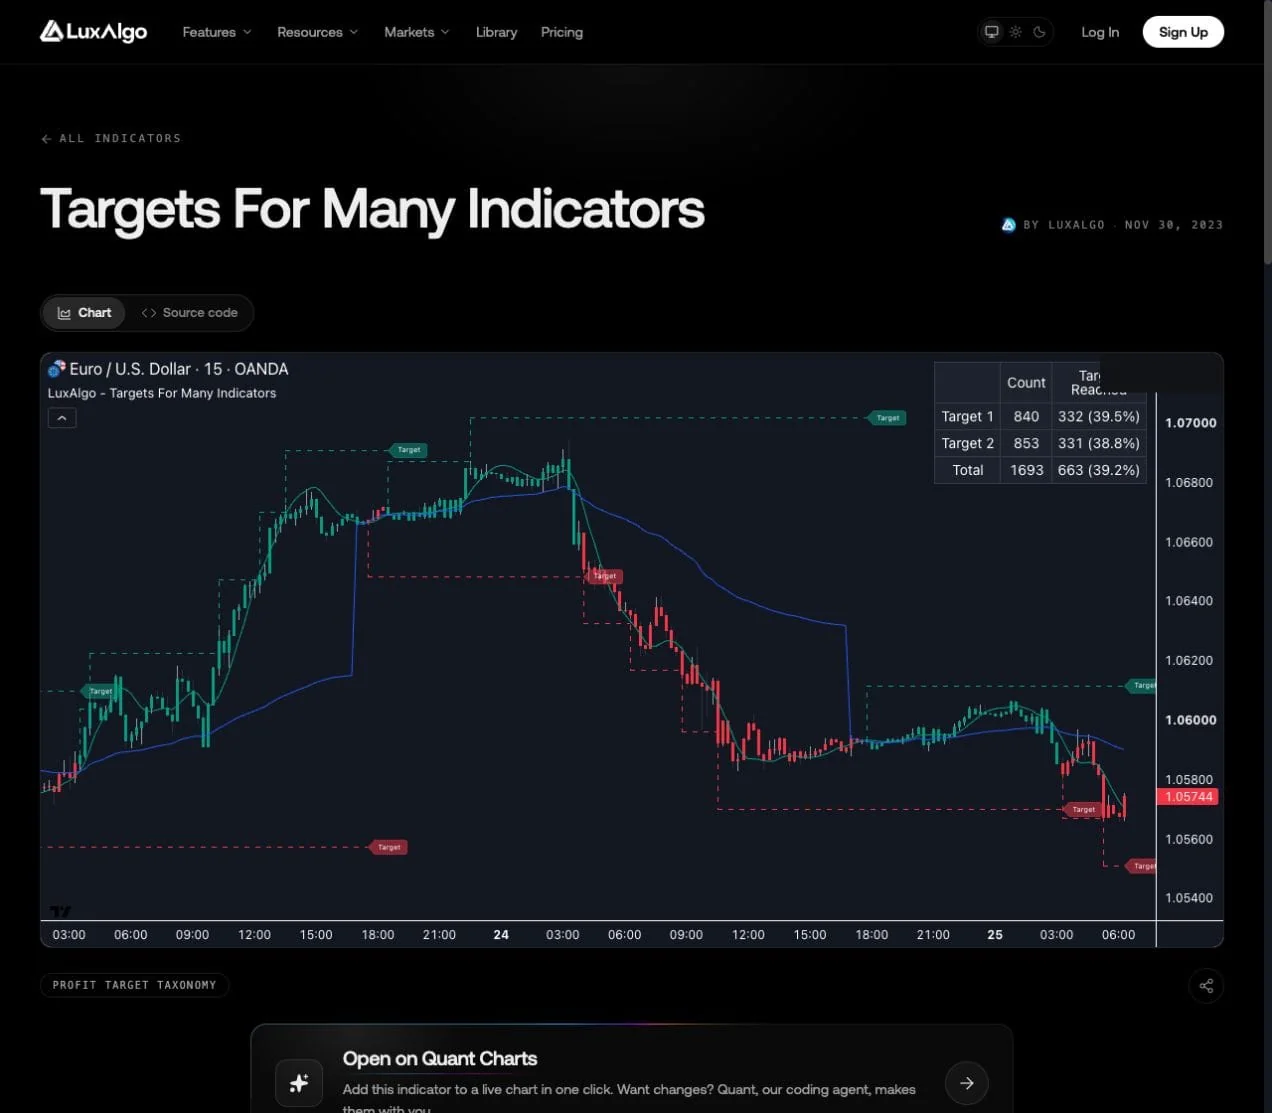
The target distance can be expressed in price units, points, percentages, ATR multiples or ticks. Other controls determine whether wicks count as target hits, whether a reached target creates another, and whether the tool waits for a current target to be reached before generating a new one.
The displayed reach rate is not a trading win rate. A target might eventually be touched after a trade would have stopped out or after a large drawdown. A complete evaluation still needs entry prices, exits, costs, time limits and position sizes. The indicator draws analytical levels; it does not place or manage brokerage orders.
The current Library DEMA page is a concept reference, not a standalone native DEMA implementation. The target tool’s Library preview is a TradingView chart. Verify the actual runtime and supported inputs when moving a rule into Vela instead of assuming the preview establishes identical native behavior.
Implement the Complete Strategy with Quant
Ask Quant to help implement the chosen EMA recurrence, initialization and crossover rules. Inspect Code and click Run. Follow Making Strategies with Quant and the native backtest guide, then compare calculated values against a small worked sample before interpreting performance.
Use chronological development and untouched test periods, identical data adjustments and realistic costs. Compare DEMA with simpler alternatives using the same entry and exit assumptions. Review turnover, exposure, drawdown, average win and loss, and trade count—not just the best return from a parameter search.
Community and Documentation
Shared strategies can suggest tests, but retain the settings, data window and calculation convention needed to reproduce them. A screenshot of a successful crossover is not a performance record. Use current product documentation to check supported inputs before adapting a community example.
Worked Risk Example: Responsiveness Does Not Fix Position Size
Suppose a hypothetical completed signal permits entry at $101, with an initial stop at $98.50 and target at $106. An illustrative $25,000 account allocating 0.5% to planned price risk has a $125 budget. If the stop rule is 2 × ATR and ATR is $1.25, the distance is $2.50.
| Scenario | Calculation | Outcome before costs |
|---|---|---|
| Initial position | $125 ÷ $2.50 | 50 shares; $125 planned risk |
| Notional exposure | 50 × $101 | $5,050 |
| Target at $106 | 50 × $5 | $250, or 2R |
| Stop executes at $97 | 50 × $4 | $200 loss, or 1.6R |
| ATR doubles to $2.50 | 2 × ATR = $5; $125 ÷ $5 | 25 shares for the same planned budget |
| Entry instead at $103 | Stop at $98.50: $4.50 risk; round $125 ÷ $4.50 down | 27 shares; $121.50 planned risk |
| Later-entry target at $106 | 27 × $3 | $81, or approximately 0.67R |
Recalculate from the actual permitted entry. Faster indicator response does not guarantee the quoted price, and a later fill can substantially reduce reward-to-risk. Include a cost allowance within the budget and cap combined exposure across correlated positions.
Investor.gov’s order guide explains why a stop price is not a guaranteed execution price. Gaps and liquidity can make the realized loss exceed the planned amount.
Conclusion: Evaluate the Trade-off
DEMA adds a lag-compensation term to an EMA. It can respond sooner, but overshoot and greater sensitivity are part of that design. Its line is a reference for a rule, not proof of a trend, support level or profitable entry.
Define the source, seed, timeframe and execution sequence; verify the calculation; then compare complete strategies after costs. Vela and Quant provide a workflow for that research, while DEMA-capable target tools supply distinct analytical functions.
FAQs
Is DEMA simply an EMA smoothed twice?
No. EMA2 is the twice-smoothed EMA, but DEMA combines it with EMA1 as 2 × EMA1 − EMA2. The subtraction supplies lag compensation.
Why can two platforms show different DEMA values?
They may use different sources, initialization, warmup history, sessions or price adjustments. Match those details and allow sufficient history before comparing outputs.
Can DEMA move outside the prices that have traded?
Yes. The correction can give older observations negative weights and cause overshoot. A DEMA crossing does not necessarily mean that price itself has reversed.
Is DEMA more reliable in sideways markets?
Not necessarily. Its responsiveness can increase whipsaws and trading costs. Test the full strategy in range-bound and trending periods rather than assuming reduced lag improves accuracy.
How can I research DEMA with LuxAlgo?
Use the DEMA concept reference and ask Quant to help implement explicit rules on Vela. Inspect Code and click Run. Targets For Many Indicators also includes a DEMA input, with separate target and reach-rate behavior.
Does a target reach rate measure strategy profitability?
No. A reached target does not account for an intervening stop, entry fill, position size, costs or time in the trade. A complete strategy backtest is needed to evaluate those outcomes.
References
LuxAlgo Resources
- Vela
- LuxAlgo Quant
- DEMA Concept and Formula
- Targets For Many Indicators
- Making Strategies with Quant
- Native Backtest Guide
- Understanding RSI
External Resources
Read next