Concept
MACD
MACD, also known as line/signal/histogram, signal cross, zero-line cross, histogram inflection, is a Momentum & Oscillators concept. The Library holds 3 implementations, each one a working definition you can pull into Quant.
Top MACD indicators
The top custom implementations, built on the original standard MACD formula.
3 total
Every MACD implementation here is strategy-ready: open one in Quant, set your rules, and it backtests automatically.
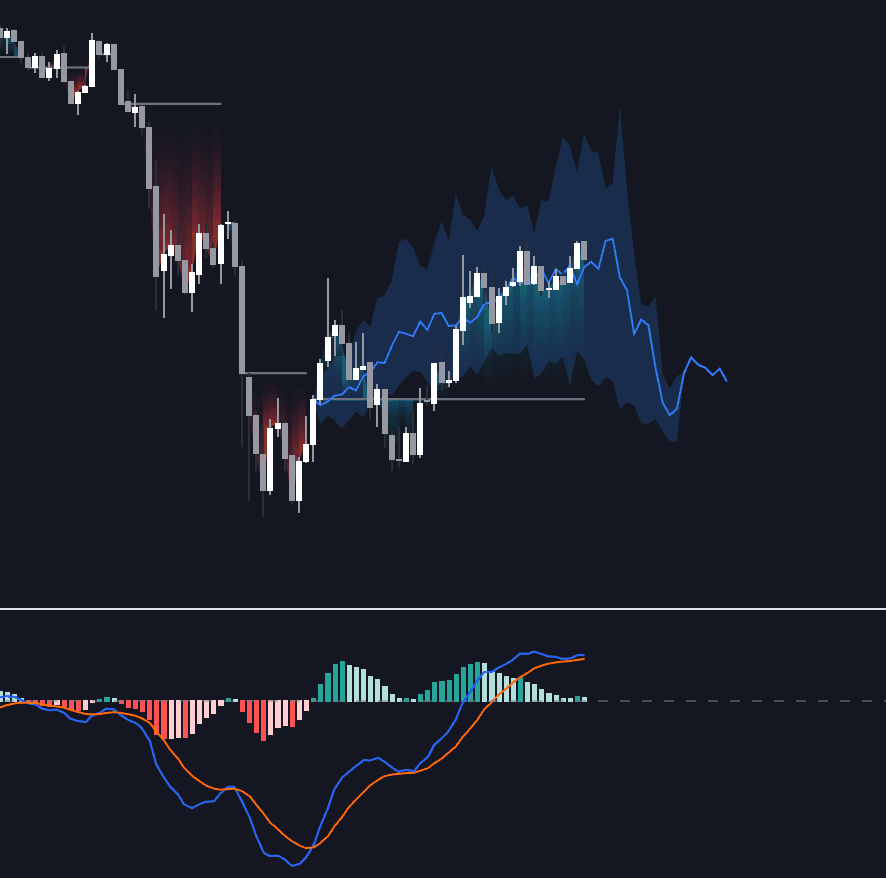
.png&w=3840&q=75)
The standard MACD indicator
MACD exactly as classically defined: the faithful reference build of the original formula, free to run in Quant.
What is MACD?
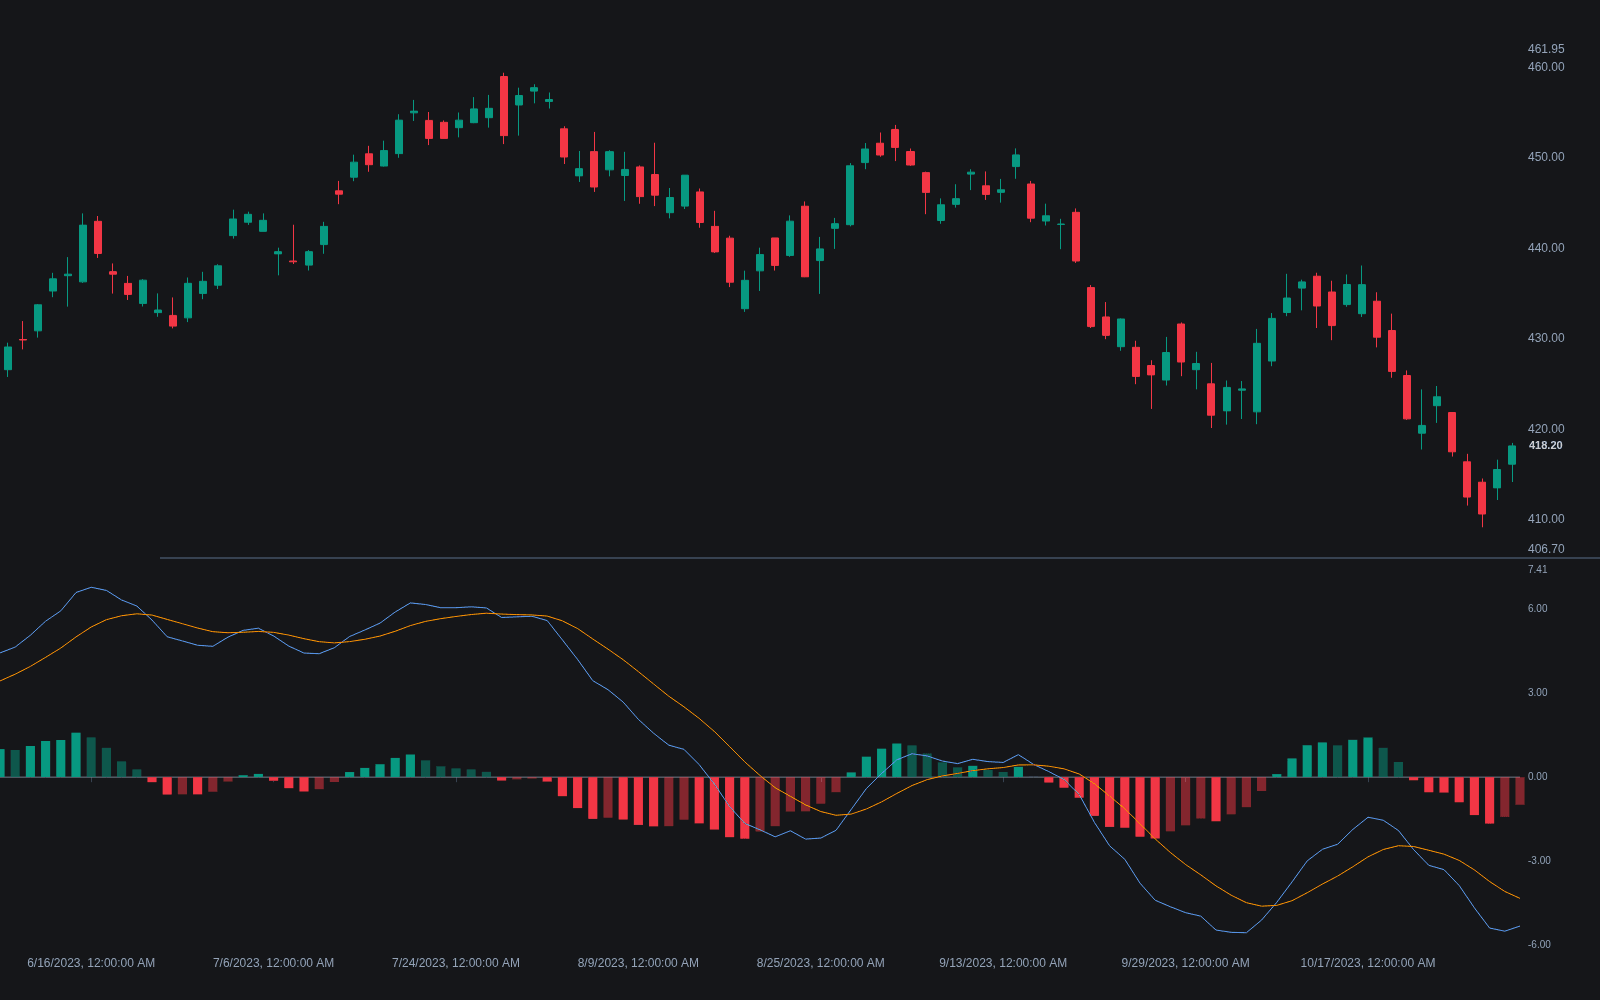
MACD (Moving Average Convergence Divergence) is a momentum indicator built from the spread between two exponential moving averages, developed by Gerald Appel in the late 1970s. The MACD line is the 12-period EMA of price minus the 26-period EMA; the signal line is a 9-period EMA of the MACD line itself; and the histogram, added by Thomas Aspray in 1986, plots the gap between the two. The result is unbounded and scaled in price units.
The three components give three readings at different speeds. The zero-line cross is the slowest: MACD above zero simply means the 12 EMA is above the 26 EMA, a trend statement equivalent to a moving average crossover. The signal cross is faster and marks momentum turning relative to its own recent path. The histogram inflection is the earliest: shrinking bars show the spread narrowing before any cross prints.
MACD matters because it packages trend and momentum in one pane, and its line/signal/histogram grammar became the template for a whole lineage of oscillators. Its main structural limit is the price scaling: a MACD value of 2 means nothing across instruments, or across one instrument's history at different price levels, which is what percentage and volatility-normalized variants like the PPO were built to fix.
How to calculate MACD
Three EMAs and two subtractions specify the whole study; 12, 26, and 9 are the conventional defaults.
- 1Compute two EMAs of the source (usually the close): a fast one, default 12 periods, and a slow one, default 26.
- 2Subtract: the MACD line equals the fast EMA minus the slow EMA. Positive means the fast average is above the slow, and distance from zero measures the width of the spread.
- 3Smooth the result: the signal line is an EMA of the MACD line, default 9 periods.
- 4Take the difference again: the histogram equals the MACD line minus the signal line. Bars shrinking toward zero show convergence ahead of a signal cross; growing bars show the move accelerating.
How it's calculated
MACD measures the gap between a fast and a slow EMA of price, with a signal line and histogram derived from that gap.
Defaults are 12, 26, 9 on closing prices.
Signal crosses, zero-line crosses, and histogram inflections are readings taken from these three series, not separate calculations.
How traders use it
- Signal-line crosses as momentum triggers: buying the MACD line crossing above the signal and selling the cross down. Raw crosses whipsaw badly in a trading range, so most rules add a trend or regime filter on top.
- Zero-line crosses as trend confirmation: above zero as bullish regime, below as bearish, often applied as a higher-timeframe filter that gates faster signals taken on lower timeframes.
- Histogram inflections as early warnings: the first shrinking bar after a run of expansion flags fading thrust before either cross, useful for tightening stops or scaling out rather than reversing outright.
- Divergence: price making a new extreme while the MACD line or histogram makes a lesser one is a classic regular divergence read, generally traded only with further confirmation.
MACD vs related oscillators
PPO: Structurally identical, but PPO divides the EMA spread by the slow EMA and quotes it as a percentage. That makes readings comparable across instruments and across history, which raw MACD's price scaling cannot do. Signals have the same shape; only the units change.
OsMA: OsMA is MACD's histogram extracted as its own indicator: the MACD line minus the signal line. Platform labels for it vary, so check the formula rather than the name. If you trade histogram inflections, you are trading OsMA by another name.
MACD-V: A volatility-normalized MACD that scales the EMA spread by average true range, so a given reading means roughly the same thing in any instrument or regime. The normalization restores meaningful overbought and oversold zones, which raw MACD lacks.
RSI: RSI is bounded 0-100 and measures stretch by comparing average gains to losses; MACD is unbounded and measures the spread between trend-following averages. RSI saturates in strong trends while MACD keeps extending with them, which is where the two disagree most usefully.
Concept family
Momentum & Oscillators
91 concepts mapped · 91 in the Library
MACD FAQ
Turn MACD into a trading strategy.
Take any implementation from this page into Quant, then build on it, backtest it on real data, and keep refining it in conversation.