FX Replay: Backtesting Platform Overview
FX Replay is a browser-based platform for practising trades on historical charts, recording decisions, and reviewing performance. Its core strength is manual market replay: you advance through past price action, apply your rules, and inspect the resulting trades. Current features also include custom indicators, Mentor AI, a trading journal, and a prop-firm simulator.
Backtesting can reveal weaknesses before real money is exposed, but it does not guarantee profitable trading or remove hindsight and execution bias. This overview examines documented features and a practical testing process, with product details checked September 8, 2026. The feature review does not establish an independently measured improvement in trading results.
LuxAlgo complements this process with native charts and Quant, our coding agent. You can take a replay observation, express it as an explicit rule, review the generated code, and test a strategy on a supported chart. That workflow is distinct from FX Replay’s manual practice.
FX Replay Features at a Glance
| Capability | Useful application | Important limit |
|---|---|---|
| Historical replay | Practise entries, exits, and position management without seeing the whole outcome first | Rewinding or choosing known winning days can contaminate an evaluation |
| Multiple charts and assets | Compare timeframes and related markets during a session | Current chart capacity and available data depend on the plan and instrument |
| Go To and replay speed | Move to a session, price level, event, or trade close; accelerate quiet periods | Skipping ahead must not reveal information unavailable at the decision time |
| Analytics and journal | Review P&L, drawdowns, time-of-day results, and tagged trades | A favorable subgroup can be a small-sample accident |
| Monte Carlo simulator | Explore account outcomes under stated trade assumptions | Simulations inherit the limits of the sample and model |
| FXR Script and Mentor AI | Create custom indicators and review trading behavior | Indicator creation and AI feedback do not automatically establish a profitable strategy |
FX Replay Walkthrough: 2026 Edition
This official FX Replay walkthrough, published April 15, 2026, replaces the older 2.0 overview. The 11-minute-49-second guide covers session setup, charts, replay controls, order practice, tags, and analytics. Useful chapters start at 0:31 for creating a session, 2:00 for replay modes, and 6:27 for strategy analytics. Examples are demonstrations; confirm current plan limits in the pricing section below.
Markets, Charts, and Replay Controls
Multiple-Pair and Chart Testing
The current FX Replay site lists more than 120 assets across six market groups, including forex, futures, stocks, crypto, indices, and other instruments. Availability is instrument-specific: check the market catalogue for the data source, starting date, minimum interval, and required plan. The presence of a market category does not imply every listed security is available.
Multiple charts can help compare a higher-timeframe context with an entry timeframe, or examine related markets such as EUR/USD and GBP/USD. The current pricing page lists two charts on Intermediate and unlimited charts on Pro, so the old blanket limit of 16 charts should not be treated as the current subscription cap. Check the separate simultaneous-asset controls when configuring a session; chart count and asset count are different.
FX Replay uses TradingView charting technology, but it is a separate application. Do not assume that a TradingView subscription, private script, or every Pine Script feature transfers into it. The provider matters too: forex feeds can differ, and futures contracts require attention to tick value, session hours, and rollover conventions.
Time-Saving Tools
The backtesting feature page describes Go To controls for sessions, price levels, news events, and trade closes, alongside adjustable replay speed and on-chart position management. Saved layouts and templates reduce repetitive setup. Seconds-level intervals can help examine fast price changes where the plan and selected data source support them; they are not the same as a complete tick-by-tick execution record.
Use the economic calendar to place a trade in historical context, including the event time and the information available then. A later revised release value or a chart viewed after the event can introduce information the trader did not have. Keep the session timezone and daylight-saving changes consistent when comparing London or New York trading windows.
Replay and rewind are useful for training. For an evaluation, distinguish the first attempt from a second attempt after seeing what happened. Keep mistakes and missed opportunities in the record rather than replacing them with a better-looking replay result.
Risk Controls and Trading Costs
FX Replay provides automatic position sizing, quick order controls, on-chart stops and targets, and plan-specific auto breakeven. These tools can help apply a written process consistently. They do not enforce sound judgment by themselves, and moving a stop to the entry price does not guarantee a net breakeven result after fees, spreads, and slippage.
The spreads and commissions guide documents cost settings for backtesting sessions. Enter assumptions appropriate to the instrument and account, inspect how they affect individual trades, and stress-test higher costs. A simulated spread setting is not proof that the platform reproduces every historical bid/ask change, queue position, orders filled only in part, or news-event execution.
Illustrative sizing check: a 0.5% planned risk on a $10,000 simulated balance is $50 before execution costs. Divide that risk budget by the loss per unit at the intended stop, using the correct contract or pip value. Review whether the resulting size remains suitable after costs and whether a price gap could create a larger loss.
The prop-firm simulator adds a way to practise around targets and drawdown rules. Match the exact rule definitions you intend to study, including daily reset time and whether limits use balance or equity. Passing a simulation is not a funded account or proof of future eligibility, and FX Replay is not a broker executing these practice trades.
Performance Analytics: What the Numbers Mean
FX Replay’s P&L tracker, performance calendar, time-based summaries, and on-chart trade review help connect outcomes with decisions. Its analytics definitions distinguish wins, losses, breakeven trades, trade duration, streaks, and results by hour, day, month, or session. Check the sample behind each metric and the treatment of breakeven trades before comparing results.
| Measure | Question it helps answer | Common mistake |
|---|---|---|
| Win rate and average win/loss | How often does the rule win, and how large are wins relative to losses? | Treating a high win rate as sufficient evidence of profitability |
| Drawdown and streaks | What losses and recovery periods occurred in the sample? | Assuming the largest historical drawdown is the worst possible future loss |
| Profit factor and expectancy | How do gross wins compare with gross losses, and what is the average net outcome? | Ignoring costs or trusting this measure when the sample contains very few losses |
| Time-based performance | Were outcomes different across predefined sessions or days? | Choosing the best-looking hour after testing many alternatives |
| Sharpe ratio, where calculated | How do average excess returns compare with return variability? | Mixing sampling periods or annualization methods across tools |
For a simple expectancy example, suppose a hypothetical rule wins 45% of trades at an average 2R and loses 55% at 1R. Gross expectancy is 0.45 × 2R − 0.55 × 1R = 0.35R. If average costs are 0.15R, net expectancy is 0.20R. These are assumed inputs, not measured FX Replay results, and a later sample may behave differently.
Monte Carlo Simulation
FX Replay’s guide lists starting balance, win rate, average profit, average loss, number of simulations, and trades per simulation as inputs to its Monte Carlo analysis. Outputs include ending-balance ranges and winning or losing streaks. This can illustrate how variable sequences affect an account under the chosen assumptions.
The result is conditional on the model. A small or selectively chosen sample, changing market conditions, clustered losses, or costs missing from the inputs can make the range misleading. More simulation runs do not repair biased source data or prove the probabilities will hold in live trading.
LuxAlgo’s Monte Carlo Shuffled Projection serves a different purpose: it reshuffles recent bar-to-bar price changes to draw hypothetical price paths. It does not reproduce FX Replay’s account-outcome model or validate the same trade sample. Use it for price-path exploration with its own assumptions, not as an interchangeable check on account drawdown.
Seasonality and Your Own Trade Results
The LuxAlgo Seasonality Widget groups selected market data by periods such as hour, weekday, or month. That can help investigate market behavior, but it is different from grouping your own trade P&L by entry time. An instrument’s average monthly change does not establish the best month for your strategy.
Define time filters before evaluating fresh data. Check trade counts, costs, session definitions, and whether one unusually large result dominates the average. Use on-chart review and journal notes to investigate the pattern before removing every historically losing time window.
Custom Indicators, Mentor AI, and the Journal
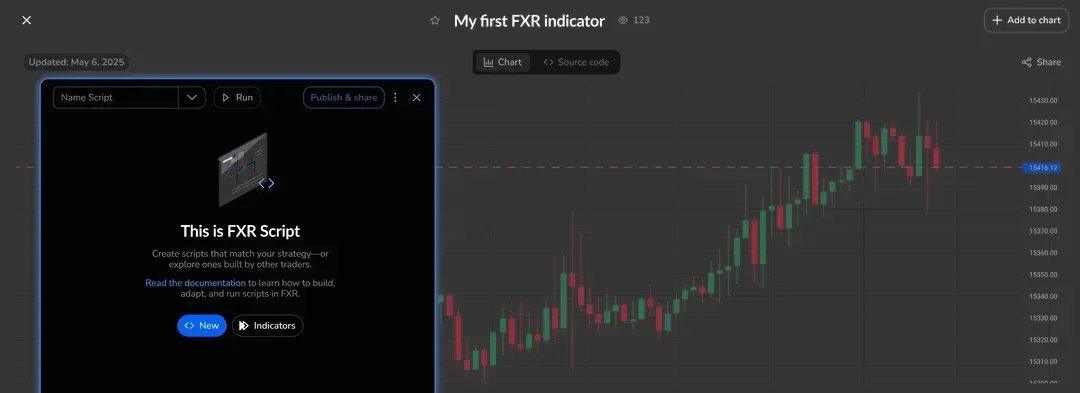
FX Replay now offers FXR Script for custom indicators. The official page describes writing and refining indicators inside the platform, viewing their output during replay, and sharing community tools. FXR Script is designed for FX Replay’s manual-trading context; it should not be presented as Pine Script running unchanged or as a universal automated strategy-testing engine.
Mentor AI provides feedback about execution and trading behavior based on the available records. Treat its observations as hypotheses to verify in the underlying trades, especially when the sample is small or tags are inconsistent. AI feedback does not automatically diagnose the cause of a loss or remove emotional bias.
The trading journal helps preserve notes, screenshots, tags, and context. Keep historical practice, demo trading, and live-account records clearly separated. A journal’s ability to record live activity is different from the platform executing live orders, and recorded results still depend on complete and accurate inputs.
Current FX Replay Plans
The current pricing page offers Beginner, Intermediate, and Pro. Prices below are in US dollars before any applicable taxes. Annual equivalents describe a yearly payment rather than a monthly subscription.
| Plan | Monthly billing | Annual billing | Selected limits |
|---|---|---|---|
| Beginner | Free | Free | 2 sessions, 50 trades per session, 1 indicator, one-week data retention, limited analytics |
| Intermediate | $17.99 | $180 total; $15/month equivalent | 10 sessions, 200 records per session, 3 indicators, 2 charts, six-month retention, Monte Carlo and RR simulators |
| Pro | $35 | $350 total; about $29.17/month equivalent | Unlimited sessions/records/retention/indicators/charts as listed; seconds data, futures/CME data, and custom timeframes |
Beginner also limits session duration and Go To usage. Intermediate and Pro include features such as auto breakeven and rewind; the pricing table reserves seconds data and futures/CME access for Pro. Confirm the exact asset and feature entitlement before subscribing. Free access and the advertised paid-plan trial are separate offers.
Data retention is an important workflow constraint. Before downgrading or allowing access to lapse, review what happens to session history and preserve any records you need using supported export options. A lower fee is only useful if the plan retains the research you rely on.
How to Use FX Replay for a Useful Test
1. Define the Rules and Sample
Write down the instrument, feed, timeframe, session, entry condition, stop, target, sizing rule, and trading costs before replay begins. Separate a development period from an untouched evaluation period. Use a range of market conditions rather than selecting only memorable clean setups.
2. Record Decisions as They Occur
Advance the chart without looking ahead. Record whether a setup qualified, why you entered or declined, and how you managed the position. Apply the same rule to losers as to winners. Save screenshots and consistent tags when they add information that a price-and-time record cannot capture.
3. Refine Carefully and Test Fresh Data
Use drawdown, net expectancy, trade review, and time-based summaries to identify a specific issue. Change one meaningful assumption at a time, retain earlier versions, and test the revised rule on a later period. Walk-forward testing is a research design you must apply; the presence of replay software does not perform it automatically or prevent overfitting.
Repeatedly revisiting an “out-of-sample” period turns it into part of development. Keep a final holdout separate, inspect sensitivity to nearby parameters and higher costs, and document how many variations you tried. A consistently applied losing result is useful evidence, not something to delete.
4. Separate Simulation from Forward Practice
After historical evaluation, observe the rules prospectively in an appropriate demo or paper-trading environment. Compare planned orders with feasible fills and record missed trades, spreads, slippage, and operational errors. Historical replay, forward paper trading, and live trading provide different evidence; none should be reported as another.
Complementing FX Replay with LuxAlgo
A replay session often exposes a rule that was too vague: “strong momentum,” “a clean break,” or “a good retest.” LuxAlgo charts and Quant help turn that observation into something you can inspect and evaluate. Start with a specific definition rather than asking the AI to find a winning strategy.
Example research request: “Create a strategy that enters long after a completed bar closes above the highest high of the previous 20 completed bars, excluding the current bar from the threshold. Add adjustable stop and target distances and a session filter.” Define the intended timeframe, order timing, timezone, and sizing before interpreting the result.
Follow the Quant strategy workflow: open Code, review the implementation, and click Run. Use Inputs for exposed parameters and Properties for relevant simulation settings, including commission and slippage. Inspect individual trades on the chart and verify that the code implements the same rule you practised. An indicator that draws a signal is not automatically a strategy that simulates orders.
The chart strategy guide explains result views and assumptions. Check the data guide for available history and feeds. Results from LuxAlgo and FX Replay can differ because of source data, candle construction, session timing, costs, or execution logic; matching the rule name is not enough to make two tests comparable.
Use the integrated LuxAlgo Journal to review recorded trading activity alongside your observations. Native charts and Quant are available through the platform’s Free and paid plans with different limits; Free includes a limited monthly credit allowance. Compare Free, Premium, Ultimate, and Ultra around the required data and research workload.
Where the Library Fits
The Library’s market-structure and order-block tools open on a Quant Chart in one click. A marked order block is a model-derived chart zone, not direct proof of an institution’s orders; the ICT order-block guide explains the concept without making it a guaranteed entry signal.
Final Assessment
FX Replay is worth evaluating for structured manual practice: replay historical conditions, apply a rule consistently, record the decisions, and investigate the results. Its newer scripting, AI, journal, and simulation features broaden that workflow, but their value still depends on the quality of the test and records.
LuxAlgo is a strong complement when you want native chart analysis and an editable strategy developed with Quant. Keep the assumptions visible, compare like-for-like data and execution settings, and judge progress from a complete research record rather than testimonials, selected winners, or the most attractive simulated curve.
FAQs
How does FX Replay help traders avoid overfitting when backtesting strategies?
Replay, analytics, and journaling can support a disciplined test, but the platform does not prevent overfitting automatically. Define rules before testing, retain all results, separate development from fresh evaluation data, and avoid repeatedly tuning against the same holdout period.
What advantages does FX Replay’s Monte Carlo simulation offer to traders?
It explores possible account outcomes using assumptions such as starting balance, win rate, average profit, average loss, and the number of simulated trades. It can illustrate streaks and variability, but its ranges depend on the model and sample. LuxAlgo’s Monte Carlo Shuffled Projection models price paths and is not an interchangeable account simulator.
How do FX Replay’s time-based analytics improve a trading strategy?
They help investigate whether recorded outcomes differ by hour, day, month, or session. Check the trade count, timezone, costs, and outliers before changing a rule. A historically favorable time window needs fresh evaluation and does not guarantee better future results.
References
Read next