Concept
Sharpe Ratio
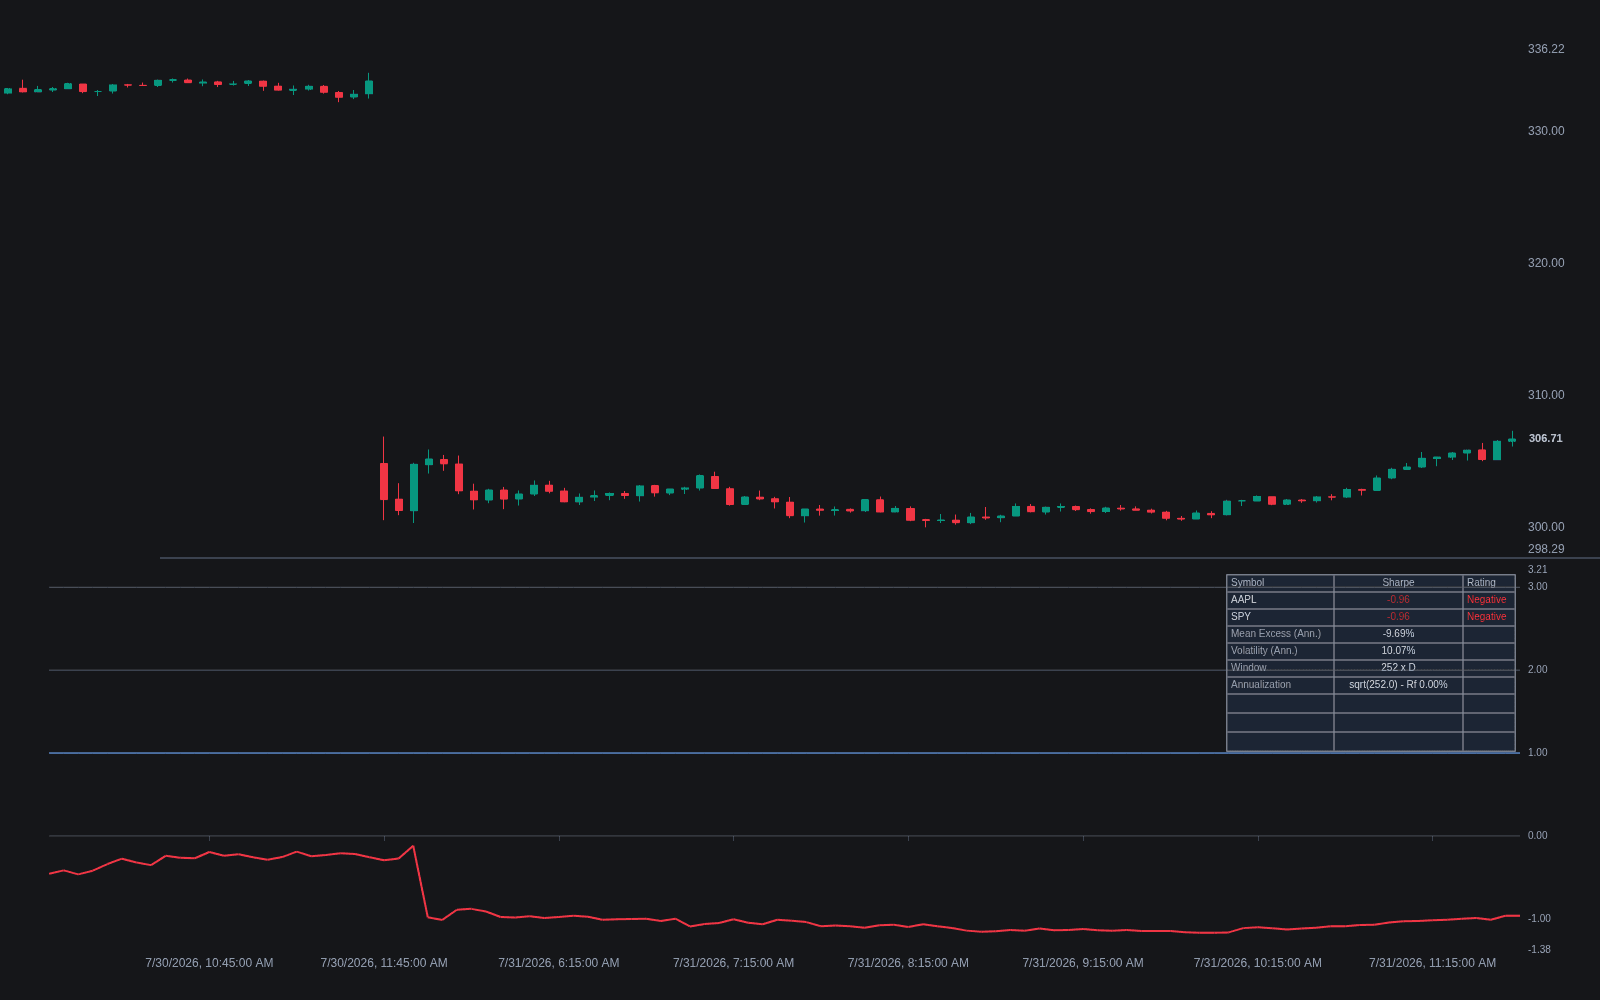
Sharpe Ratio is a Performance, Backtesting & Validation concept. The Library holds 1 implementation, a working definition you can pull into Quant.
Top Sharpe Ratio indicator
The top custom implementation, built on the original standard Sharpe Ratio formula.
1 total
This Sharpe Ratio implementation is strategy-ready: open it in Quant, set your rules, and it backtests automatically.
What is the Sharpe Ratio?
The Sharpe ratio, introduced by William F. Sharpe in 1966 as the reward-to-variability ratio, measures return per unit of risk: the average return earned in excess of the risk-free rate, divided by the standard deviation of those excess returns. It is conventionally annualized; a ratio computed from daily returns is typically scaled by the square root of 252, the usual count of trading days in a year. The result puts portfolios and strategies with different volatilities on one axis: how much excess return each unit of volatility bought.
The measure's authority is institutional: Sharpe, later a Nobel laureate for his asset-pricing work, revisited and formalized the ratio in 1994, and it has served since as the default risk-adjusted score across funds, desks, and backtests. Ubiquity is exactly why its arithmetic details matter, since a number everyone quotes gets compared across contexts where the inputs (return frequency, risk-free proxy, measurement span) quietly differ.
Its weaknesses are as well documented as its ubiquity. Standard deviation penalizes upside and downside moves equally, so a strategy with volatile gains scores worse than it deserves (the Sortino ratio answers this by using downside deviation only). More seriously, the ratio compresses risk into a single volatility number, a summary that is only adequate when returns are roughly normal: strategies with heavy negative skew, the kind that collect small steady gains against rare large losses, can print a high Sharpe for years before a single tail event erases it. Reading the ratio alongside the distribution's higher moments and the drawdown history is the honest use.
In backtesting the ratio has a second failure mode: selection. Search enough parameter combinations and the best in-sample Sharpe is largely a prize for luck, which is why research practice discounts reported ratios by the intensity of the search behind them (the logic of deflated and probabilistic Sharpe adjustments), demands out-of-sample confirmation, and checks that performance survives neighboring parameters rather than living on one fragile setting.
How to compute and read a Sharpe ratio
The arithmetic is trivial; the discipline is in the inputs and the context.
- 1Compute per-period excess returns: strategy returns minus the risk-free rate over the same periods (for short horizons the adjustment is small and often skipped).
- 2Divide the mean excess return by the standard deviation of excess returns, then annualize by the square root of periods per year.
- 3State the measurement span and frequency alongside the number; ratios from different frequencies or eras are not directly comparable.
- 4Inspect the return distribution before trusting the summary: heavy negative skew or fat tails mean the volatility denominator understates the real risk.
- 5Compare in-sample against out-of-sample: a large drop between them is the standard overfitting signature.
- 6Discount by search intensity: the more variants were tried, the higher the best Sharpe would be by chance alone, and the more deflation the reported number needs.
How it's calculated
Excess return earned per unit of return volatility, used to compare strategies and portfolios on a risk-adjusted basis.
William Sharpe's 1994 revision divides by the standard deviation of excess returns; the original 1966 version used the standard deviation of raw returns.
Annualizing with sqrt(k) assumes serially uncorrelated returns and overstates SR when returns are positively autocorrelated.
Upside and downside volatility are penalized equally; the Sortino ratio is the downside-only variant.
How traders use it
- Ranking strategies and portfolios on a risk-adjusted basis, where a smooth equity curve with moderate returns can legitimately outrank a volatile one with higher raw returns.
- As a backtest quality gate alongside win rate and maximum drawdown, with the caveat that an implausibly high in-sample Sharpe is more often an overfitting alarm than a discovery; the out-of-sample figure is the one that counts.
- In allocation and sizing frameworks: because the ratio is built on realized volatility, it pairs naturally with volatility-targeted position sizing when weighting multiple systems.
- As a live monitor: tracking the rolling live Sharpe against the backtest's expectation gives an early, standardized read on whether a deployed system is performing within its tested character or decaying.
- As one axis of a scorecard: pairing it with win rate, payoff ratio, and drawdown statistics prevents the single-number tyranny where a smooth-but-fragile system outranks a robust one on Sharpe alone.
Sharpe ratio vs neighboring validation measures
Win Rate: Win rate counts how often trades succeed and says nothing about magnitude; the Sharpe ratio aggregates magnitude and consistency and says nothing about frequency. A low-win-rate trend system and a high-win-rate fade system can share a Sharpe, which is why the pair is read together.
In-sample / Out-of-sample Split: The split is the honesty procedure the ratio depends on: any Sharpe can be manufactured in sample by searching hard enough. The out-of-sample ratio, and the gap between the two, carries most of the evidential weight.
Parameter Stability: Stability analysis asks whether the Sharpe survives small parameter changes. A ratio that collapses one setting away from the optimum describes a lucky point, not a strategy, so the stability surface is the context that decides whether the headline number means anything.
Concept family
Performance, Backtesting & Validation
30 concepts mapped · 30 in the Library
Sharpe Ratio FAQ
Turn Sharpe Ratio into a trading strategy.
Take the implementation from this page into Quant, then build on it, backtest it on real data, and keep refining it in conversation.