Latency Standards in Trading Systems
Latency in a trading system is the time between an event in the market and your response reaching the exchange, and the standards that govern it are far more specific than "faster is better." European rules set exact clock-synchronisation tolerances for anyone running high-frequency techniques, the physics of light through glass fibre sets a floor that no budget can beat, and the venue you trade on may deliberately add delay. Most of what circulates as "latency standards" is either vendor marketing or numbers copied without a source. This guide lays out what is actually measurable and actually regulated: the components of tick-to-trade latency, the physical limits, the MiFID II tolerances, how to measure your own system with percentiles rather than averages, what each tier of participant can realistically achieve, and where a retail algorithmic trader's latency really lives, which is rarely where the marketing says. It closes with how Quant Charts fits in as an analysis and research surface, including how Quant, our coding agent, builds strategies whose cost assumptions you can stress.
Key points:
- Latency is a chain, not a number. Feed handling, decision logic, order gateway, network transit and exchange matching each add time; the slowest link sets the total.
- Physics sets the floor. Light in fibre covers roughly 200 kilometres per millisecond, so a venue 150 kilometres away cannot be reached and answered in under a millisecond.
- The written standards are about clocks and controls. MiFID II requires high-frequency participants to keep clocks within 100 microseconds of UTC and to have kill functionality and pre-trade controls; it does not prescribe a speed.
- Measure percentiles, not means. The 99th percentile and the maximum decide whether a system is usable; the average hides the tail that costs money.
Video: Low-Latency Programming Masterclass
A masterclass from Quants Hub and BTRM with Paul Bilokon on low-latency programming for high-frequency trading. It goes deep on the engineering side; the rest of this article covers the standards and measurement side.
What Latency Is Made Of
The figure that matters to a trading system is tick-to-trade: the time from a market data event arriving at your network interface to your order leaving it. Round-trip latency adds the network transit to the venue, the matching engine's processing time and the acknowledgement coming back. Each stage has its own cause and its own fix, which is why a single "latency" figure without a definition is useless.
| Stage | What happens | What determines its speed |
|---|---|---|
| Market data ingestion | Packets from the feed are decoded into price updates | Direct feed versus consolidated feed, network card, kernel bypass, feed handler design |
| Decision | Strategy logic evaluates the update and decides whether to act | Code path length, memory allocation, language and hardware (CPU versus FPGA) |
| Order gateway | The order is encoded into the venue's protocol and sent | Protocol (binary versus FIX), session handling, serialisation |
| Network transit | The order travels to the venue | Distance and medium: co-located cross-connect, fibre, microwave |
| Matching and acknowledgement | The venue processes the order and confirms | Outside your control; includes any deliberate delay the venue imposes |
Units
A millisecond is a thousandth of a second, a microsecond a millionth, a nanosecond a billionth. Co-located high-frequency systems talk in microseconds and, for the hardware path, nanoseconds. Broker-routed retail systems live in milliseconds. Human reaction lives in hundreds of milliseconds. Keeping the units straight is the first defence against claims like "HFT requires latency under 100 milliseconds," which is off by several orders of magnitude and appears in a surprising number of articles.
The Physical Limits
Light travels at 299,792 kilometres per second in a vacuum, about 3.3 microseconds per kilometre. In optical fibre the refractive index of the glass slows it to roughly two thirds of that, so a signal covers about 200 kilometres per millisecond, or around 5 microseconds per kilometre. Microwave links through air run closer to the vacuum speed, which is why they replaced fibre on the busiest inter-venue routes despite lower bandwidth and weather sensitivity. Nothing you buy changes these figures; they set the floor under every latency budget.
| Distance to venue | One-way fibre time (approx.) | Round trip | Implication |
|---|---|---|---|
| Cross-connect inside the data centre | Microseconds | Microseconds | Distance is no longer the bottleneck; software and hardware are |
| 150 km | About 0.75 ms | At least 1 ms, even in a vacuum | Sub-millisecond round trips are physically impossible |
| 1,000 km | About 5 ms | About 10 ms | Typical of a regional server reaching a distant venue |
| Intercontinental | Tens of milliseconds | Tens to over a hundred milliseconds | Latency-sensitive strategies are not viable from here |
Venues can also add delay on purpose. IEX placed a 38-mile coil of optical fibre in front of its matching engine, which imposes a 350-microsecond delay on every message, a design intended to blunt certain speed advantages. It is a useful reference point: a regulator-approved exchange decided that a third of a millisecond is a meaningful amount of time in equity markets, which tells you the scale on which the fastest participants compete.
The Standards That Actually Exist
Clock Synchronisation Under MiFID II
The most concrete latency-related standard in any major jurisdiction is not a speed requirement but a timing one. Commission Delegated Regulation (EU) 2017/574, known as RTS 25, requires trading venues and their members to synchronise the business clocks they use to timestamp reportable events to UTC, with tolerances that scale with how fast the system is.
| Who | Condition | Maximum divergence from UTC | Timestamp granularity |
|---|---|---|---|
| Trading venue | Gateway-to-gateway latency above 1 millisecond | 1 millisecond | 1 millisecond or better |
| Trading venue | Gateway-to-gateway latency of 1 millisecond or less | 100 microseconds | 1 microsecond or better |
| Member or participant | Using a high-frequency algorithmic trading technique | 100 microseconds | 1 microsecond or better |
| Member or participant | Voice trading systems | 1 second | 1 second or better |
The logic is that regulators reconstruct events across venues after the fact, and that is only possible if every participant's timestamps agree to within less than the time the events took. The regulation therefore defines, indirectly, what "fast" means in European markets: a venue whose gateway-to-gateway latency is at or below one millisecond is in the tight tier, and anyone running high-frequency techniques must timestamp to the microsecond.
Resilience and Controls Under RTS 6
Commission Delegated Regulation (EU) 2017/589, RTS 6, sets the organisational requirements for investment firms that trade algorithmically. It says nothing about how fast a system must be and a great deal about how it must behave. Firms must be able to cancel all or some of their orders immediately, the kill functionality of Article 12. Article 15 requires pre-trade controls on every order: price collars that block orders outside set parameters, maximum order values, maximum order volumes and message limits. Systems must be stress-tested, including high-messaging tests at twice the highest message count the firm sent or received in the previous six months. For anyone building a trading system, that list is a better checklist than any latency target: a fast system without those controls is a liability, and regulators treat it as one.
The United States
US equity market structure regulates latency mainly through the order protection rule of Regulation NMS, which requires venues to respond to protected quotations immediately, and through the SEC's interpretation that small intentional delays are de minimis. IEX's speed bump was approved on that basis. Beyond that, US standards are set by the venues themselves through their co-location offerings, direct feeds and published protocol specifications, and by the consolidated tape, which is by design slower than the direct feeds the fastest participants use.
Measuring Your Own Latency
What to Record
Measurement has to happen at boundaries you control with clocks you trust. Timestamp the moment a market data packet arrives at the interface, the moment your decision is made, the moment the order leaves, and the moment the acknowledgement returns. Hardware timestamps on the network card are the gold standard because they exclude operating-system jitter; software timestamps from a monotonic clock are acceptable for a broker-routed system where the network dominates anyway. If you compare timestamps across machines, synchronise them with Precision Time Protocol; NTP's typical accuracy is measured in milliseconds, which is coarser than the thing you are trying to measure.
Percentiles, Not Averages
Latency distributions have long right tails. A system with a median of 200 microseconds and a 99th percentile of 40 milliseconds is not a 200-microsecond system; it is a system that is slow exactly when the market is busiest, because the tail is caused by bursts. Report the median, the 95th and 99th percentiles and the maximum, and report jitter, the spread between typical and worst-case. The snippet below computes them from a log of send and acknowledgement timestamps.
import numpy as np
import pandas as pd

log = pd.read_csv("orders.csv")                 # columns: sent_ns, acked_ns (monotonic clock)
rtt_us = (log["acked_ns"] - log["sent_ns"]) / 1_000.0

summary = pd.Series({
    "count": len(rtt_us),
    "median_us": np.percentile(rtt_us, 50),
    "p95_us": np.percentile(rtt_us, 95),
    "p99_us": np.percentile(rtt_us, 99),
    "max_us": rtt_us.max(),
    "jitter_us": np.percentile(rtt_us, 99) - np.percentile(rtt_us, 50),
})
print(summary.round(1))

# Where does the tail live? Group by minute and look at p99 during busy periods.
log["minute"] = pd.to_datetime(log["wall_ns"], unit="ns").dt.floor("min")
by_minute = rtt_us.groupby(log["minute"]).quantile(0.99)
print(by_minute.sort_values(ascending=False).head(10))
The second block is the one that finds problems. If the worst minutes cluster at the open, around scheduled news or when your own message rate spikes, the bottleneck is capacity, not distance, and no amount of co-location will fix it.
Separate the Links
A single round-trip number cannot tell you which stage is slow. Measure at least three intervals separately: feed arrival to decision (your software), decision to wire (your gateway), and wire to acknowledgement (network plus venue). The last one is the only one a broker-routed retail trader can meaningfully act on, usually by moving the server closer to the broker's gateway. The first two are where a co-located firm spends its engineering budget.
What Each Tier Can Realistically Achieve
| Participant | Where the system sits | Latency scale | What actually decides profitability |
|---|---|---|---|
| Co-located market maker or arbitrageur | Inside the venue's data centre, direct feeds, often FPGA in the hot path | Microseconds tick-to-trade | Queue position, hardware engineering, inter-venue links |
| Institutional execution desk | Proximity hosting, sliced orders via VWAP, TWAP or percent-of-volume algorithms | Milliseconds | Market impact and benchmark slippage, not raw speed |
| Retail algorithmic trader via broker API | Cloud or home server, internet to the broker, broker to venue | Tens to hundreds of milliseconds, dominated by the broker path | Fill quality, spread, order type; latency matters only for very short holding periods |
| Discretionary trader | Charting platform and broker front end | Seconds, set by the human | Decision quality; latency is irrelevant next to slippage and costs |
The honest conclusion for most readers is that they are in the third or fourth row, where the latency that matters is the broker's, not theirs. A retail system that decides in 50 microseconds and then waits 80 milliseconds for a broker gateway has spent its effort in the wrong place. What such a trader can control is the choice of broker and venue, the physical location of the server relative to the broker's gateway, the order type, and above all whether the strategy's edge per trade survives realistic slippage. Our guide to choosing an algorithmic trading platform or API covers the broker side, and minimising slippage covers the cost side.
Reducing Latency, Tier by Tier
Where the Fastest Participants Spend
- Co-location and cross-connects remove distance from the equation, leaving only the venue's own processing and your stack.
- Direct feeds instead of the consolidated tape, which aggregates and is slower by construction.
- Kernel bypass networking delivers packets to the application without passing through the operating system's network stack.
- FPGA or hardware-assisted hot paths for feed decoding and risk checks, with software handling everything that is not on the critical path.
- Software discipline: a single-threaded hot path, pre-allocated memory, no garbage collection or logging on the critical path, and binary protocols rather than text where the venue offers them.
What a Retail or Small Systematic Trader Should Do Instead
- Measure first. Log send and acknowledgement times for a week and compute the percentiles above before spending anything.
- Move the server, not the strategy. A virtual server in the same region as the broker's gateway usually removes more latency than any code change.
- Prefer limit orders where the strategy allows, so that latency changes the fill probability rather than the fill price.
- Model the cost. Estimate spread, slippage and commissions per round trip and compare them with the strategy's gross edge per trade; if the edge is a few ticks, latency-driven slippage decides the outcome and the strategy should be redesigned, not accelerated.
- Build the controls regulators require of professionals even if they do not apply to you: a kill switch, maximum order size, a price collar and a message-rate limit. They cost nothing in latency and prevent the failures that end accounts.
Where Quant Charts Fits
Quant Charts is an analysis and research surface, not a co-located execution stack, and it is worth being precise about that. Its charts use LuxAlgo market data delivered by a single provider that sits in front of several venues, with no exchange accounts or API keys to connect, so the latency between a trade printing at the venue and the bar updating on your screen is a display latency, which the platform lets you minimise by turning off bar animation. That is the right tool for watching a market and for research; it is not, and does not claim to be, a path to the matching engine.
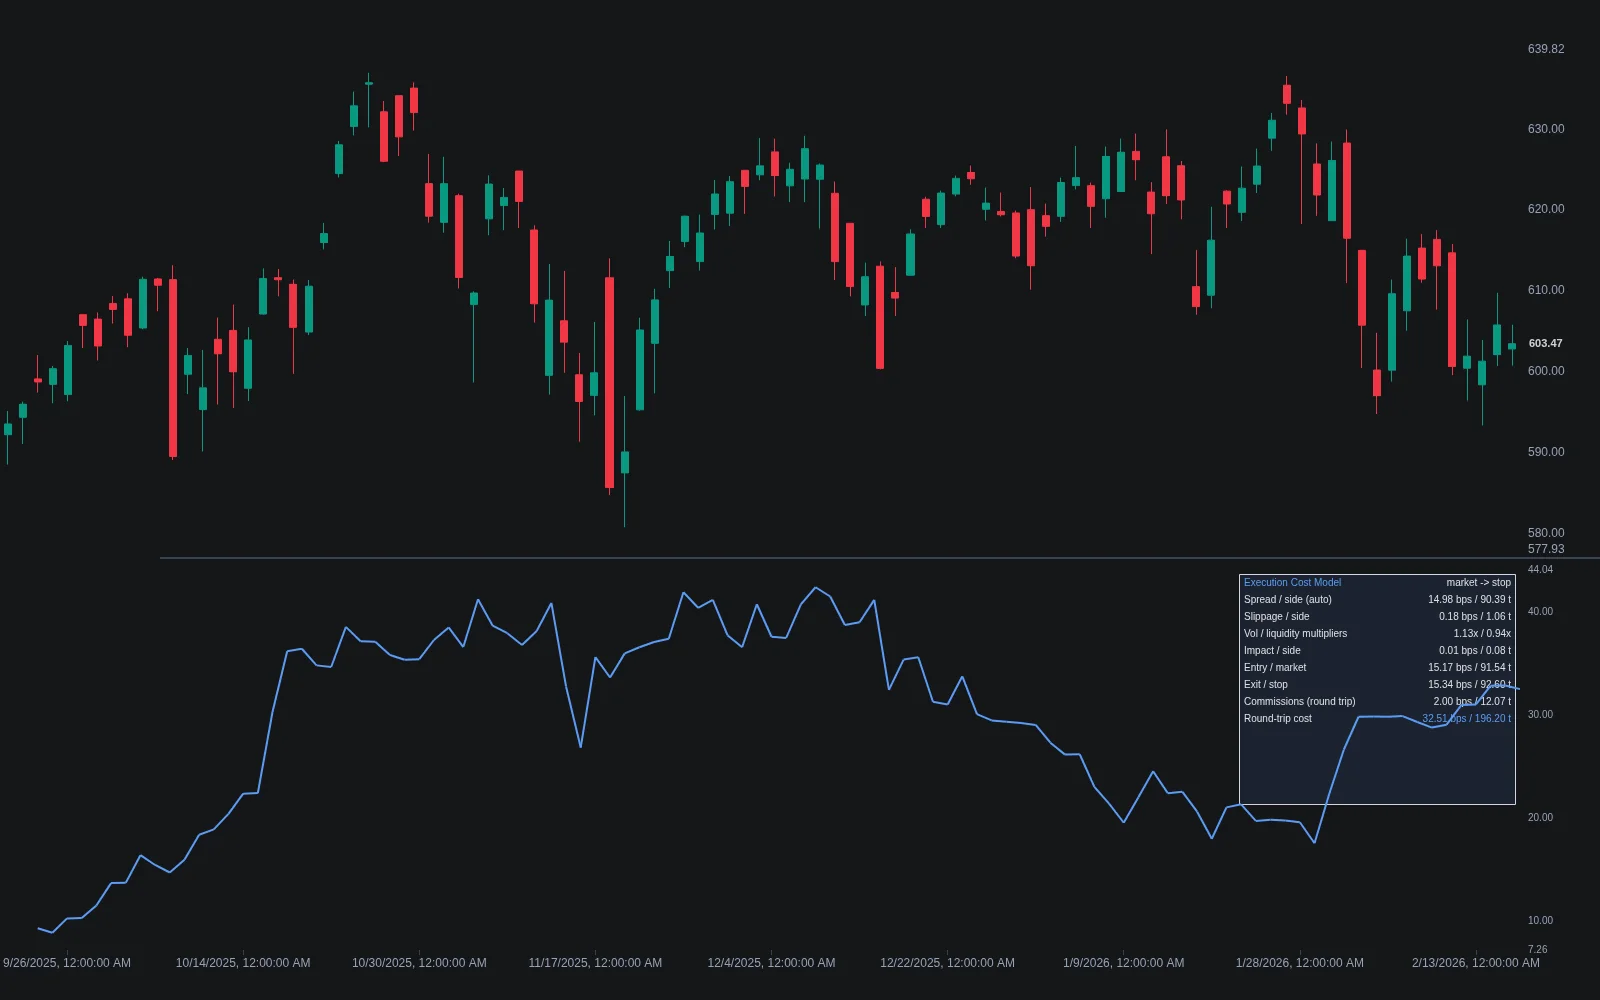
Where it earns its place in a latency discussion is on the cost side. The Library's Execution Cost Modeling indicator estimates a round trip's spread, slippage, impact and commission bar by bar, treats stop orders more harshly than resting limits, and shades the region where cost exceeds a gross edge you specify, which is exactly the viability screen a latency-constrained strategy needs. The Journal logs fills from a connected broker or by hand and paints entries and exits on the chart, so decision price and fill price can be compared trade by trade, the raw material for measuring your own slippage distribution. And when you describe a strategy to Quant, it writes it in Pine Script, you can open Code to read it and click Run, and the Backtest Summary reports it with the commission and slippage you set in the properties; raising the slippage assumption until the edge disappears tells you how much latency the strategy can tolerate. The Making Strategies with Quant guide shows the workflow.
One boundary. The LuxAlgo platform does not place orders for you at a broker or venue, so nothing here changes your execution latency. For the wider picture of high-frequency market structure, see The Millisecond Manifesto; for the dashboard side of the problem, latency optimisation in trade execution dashboards.
Conclusion
The standards that actually govern trading latency are about clocks, controls and physics, not about a speed you must hit. MiFID II tells high-frequency participants to timestamp to the microsecond and to keep their clocks within a tenth of a millisecond of UTC; RTS 6 tells every algorithmic firm to be able to kill its orders and to bound them before they leave; the speed of light in glass tells everyone that distance costs about five microseconds a kilometre and that a venue 150 kilometres away can never answer in under a millisecond. Inside those bounds, the useful work is measurement: percentiles at each boundary, the tail traced to its cause, and the honest comparison between the latency you can change and the slippage it produces. For most traders that comparison ends in the same place: the strategy's edge per trade, not the server's clock speed, decides whether latency matters at all.
Key Takeaways
- Define before measuring. Tick-to-trade, round trip and display latency are different numbers; name the one you mean.
- Respect the floor. About 5 microseconds per kilometre in fibre; 150 kilometres means at least a millisecond round trip.
- Know the written standards. RTS 25 clock tolerances (100 microseconds and 1 microsecond for high-frequency techniques); RTS 6 kill functionality and pre-trade controls.
- Report the tail. Median, p95, p99, maximum and jitter, grouped by time of day to find capacity problems.
- Spend where you sit. Co-located firms buy hardware; broker-routed traders move servers, choose order types and model cost. Quant Charts is for the analysis, with Execution Cost Modeling and the Journal for the cost side.
FAQs
What is latency in a trading system?
Latency is the delay between an event and a response. Tick-to-trade latency runs from a market data update arriving at your system to your order leaving it; round-trip latency adds network transit, the venue's matching time and the acknowledgement. Display latency, the delay before a chart updates, is a separate figure. Each is measured differently and each has different causes, so a latency claim without a definition means little.
Is there an official latency standard for trading?
Not as a speed. The concrete standards are MiFID II's clock synchronisation rules in RTS 25, which require participants using high-frequency techniques to keep clocks within 100 microseconds of UTC with microsecond timestamps, and RTS 6's organisational rules, which require kill functionality, pre-trade controls and stress testing. In the US, Regulation NMS and the SEC's treatment of small intentional delays as de minimis shape venue behaviour, such as IEX's 350-microsecond speed bump.
What is the fastest possible latency?
Distance sets the floor. Light in optical fibre covers roughly 200 kilometres per millisecond, about 5 microseconds per kilometre, and even in a vacuum a venue 150 kilometres away cannot be reached and answered in under a millisecond. Co-location removes distance, after which the venue's own processing and your hardware and software determine the result, measured in microseconds for the fastest participants.
How should I measure my system's latency?
Timestamp at boundaries you control, ideally with hardware timestamps or at least a monotonic clock, and synchronise machines with Precision Time Protocol if you compare across them. Report the median, 95th and 99th percentiles, the maximum and jitter rather than the mean, and group the 99th percentile by time of day; tails that cluster at the open or during bursts indicate a capacity problem rather than a distance problem.
Does latency matter for retail algorithmic traders?
Usually much less than slippage and spread do. A broker-routed system spends most of its round trip in the broker's path, so the effective controls are the choice of broker, the server's location relative to the broker's gateway, and the order type. The decisive question is whether the strategy's gross edge per trade survives realistic execution costs; if it is a few ticks, latency-driven slippage settles the matter and the strategy needs redesign, not acceleration.
How does Quant Charts relate to trading latency?
Quant Charts is an analysis and research platform, not an execution stack: it uses LuxAlgo market data from a single provider in front of several venues and does not place orders. Its role in a latency discussion is on the cost side. The Execution Cost Modeling indicator estimates spread, slippage and commissions per round trip, the Journal records fills for comparing decision and fill prices, and Quant writes strategies whose commission and slippage assumptions you can stress in the Backtest Summary.
References
LuxAlgo Resources
- Quant Charts
- LuxAlgo Quant
- Making Strategies with Quant
- Quant Charts Data Documentation
- Journal Documentation
- Execution Cost Modeling Indicator
- Execution Cost Modeling Concept
- Cost Sensitivity Concept
- TWAP, VWAP and POV Execution Concept
- The Millisecond Manifesto: High-Frequency Trading in 2026
- Latency Optimization in Trade Execution Dashboards
- Trading Slippage: Minimize Hidden Costs
- Choosing an Algorithmic Trading Platform or API
External Resources
Read next