Concept
Execution Cost Modeling
Execution Cost Modeling, also known as slippage, spread, partial fills, requotes/latency, is a Risk, Sizing & Exits concept. The Library holds 1 implementation, a working definition you can pull into Quant.
Top Execution Cost Modeling indicator
The top custom implementation, built on the original standard Execution Cost Modeling formula.
1 total
The Execution Cost Modeling implementation below can become a backtested trading strategy — describe your rules and Quant writes the code.
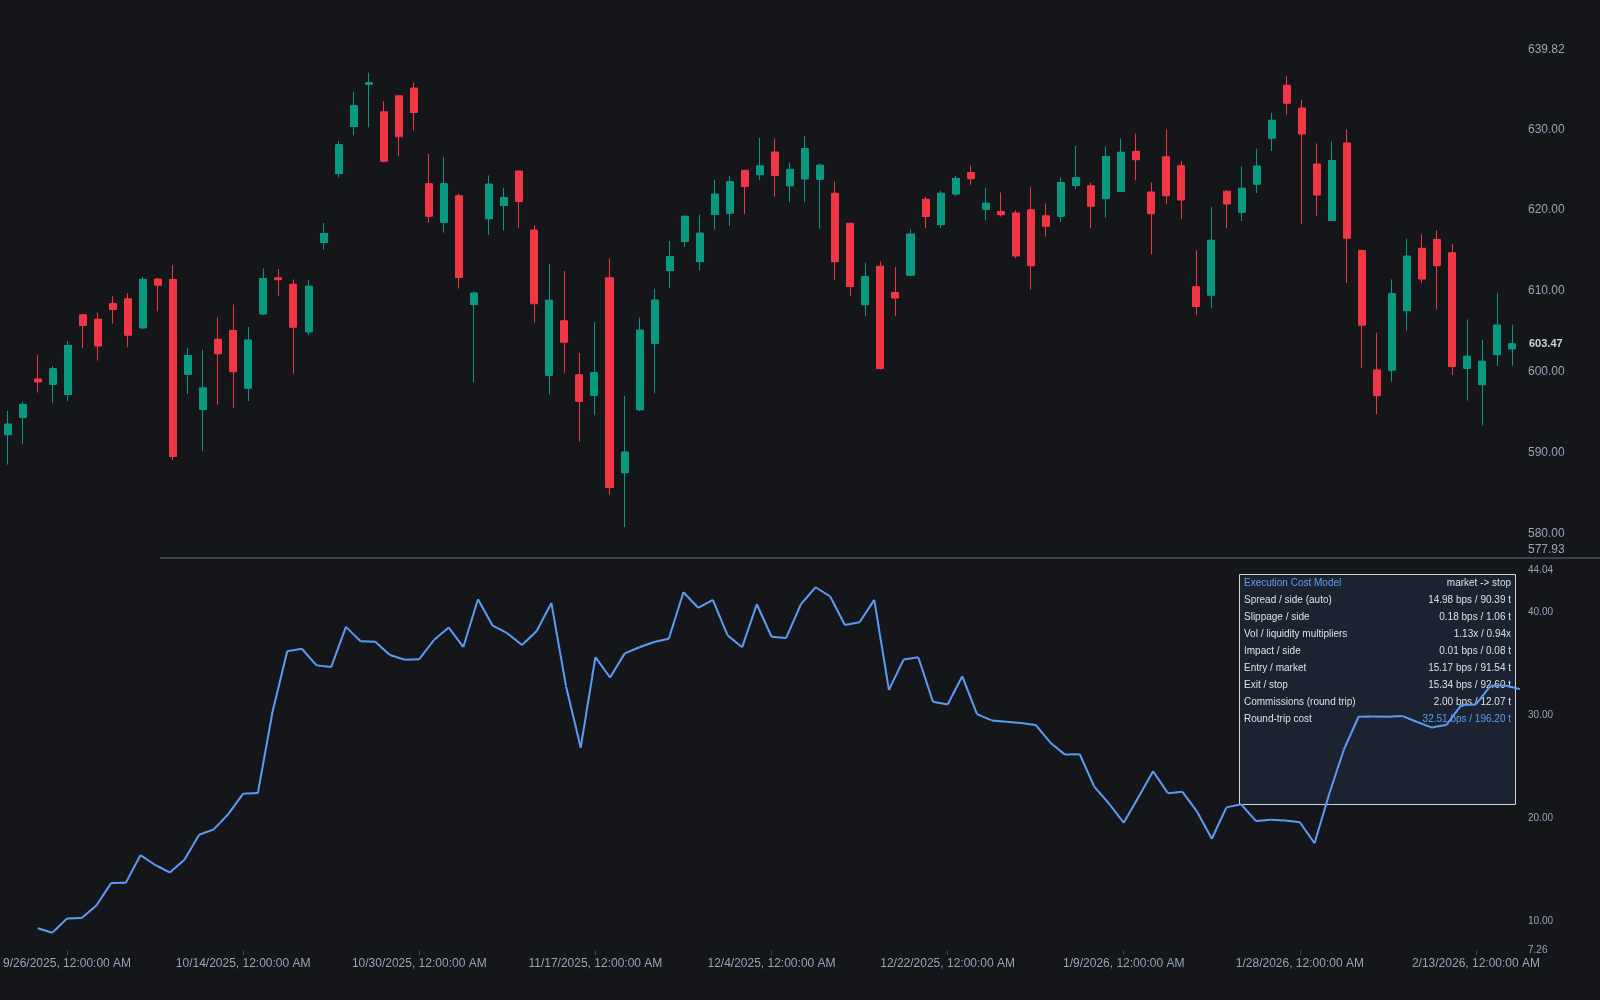
What is Execution Cost Modeling?
Execution cost modeling is the practice of estimating the gap between the prices a strategy assumes and the prices real orders achieve. The gap has several components: the bid-ask spread paid when crossing the book, slippage between the decision price and the fill price, commissions and exchange fees, partial fills that leave intended size unexecuted, and, in dealer-quoted markets, requotes and latency effects where the quoted price is gone by the time the order arrives. Together these are the frictions that separate a backtest from a brokerage statement.
The discipline exists because untreated costs are one of the most common ways a profitable-looking system fails live. A backtest that fills every signal at the printed close pays no spread, suffers no slippage, and never misses size. For a low-frequency system with large average wins the distortion may be tolerable; for a high-turnover strategy whose average trade earns a few ticks, realistic costs routinely erase the entire edge. Modeling costs explicitly, and stress-testing the strategy's sensitivity to cost assumptions, is therefore a core part of honest strategy evaluation rather than an accounting afterthought.
Cost models range from crude to elaborate. The simplest charge a fixed amount per trade. Better models scale costs with the instrument's spread and volatility, condition slippage on relative volume and time of day, and treat stop orders (which chase price) more harshly than resting limits (which risk non-fill instead). Institutional models add market impact, the adverse price movement caused by the order itself, which grows with order size relative to available liquidity. No model is exact; the practical goal is a conservative estimate that the live strategy tends to beat rather than an optimistic one it tends to miss.
How it's calculated
There is no single canonical formula; the standard per-round-trip accounting is:
Market-impact terms for large orders are often modeled as increasing with the square root of order size relative to daily volume; parameters are venue and instrument specific.
Limit-order strategies substitute a fill-probability model for spread cost, since the cost of passivity is missed trades rather than paid spread.
How traders use it
- In backtesting, as a deduction applied to every simulated trade, ideally scaled to spread and volatility rather than fixed; this is the difference between realistic and decorative cost assumptions.
- As a viability screen: computing the strategy's average gross profit per trade in ticks and comparing it to modeled round-trip cost quickly reveals whether an edge survives friction at all.
- In live monitoring, by recording decision price versus fill price on every order so the realized slippage distribution can be compared with the model and the model corrected, a feedback loop that also feeds walk-forward evaluation.
- In execution design: modeled costs guide choices between market and limit orders, between taking liquidity and posting it, and whether large orders should be sliced algorithmically via TWAP, VWAP, or POV schedules.
- With honest limits: slippage in fast markets, around news, and at stop-loss prices is fat-tailed, so average-based models understate worst cases and should be paired with stress scenarios.
Execution cost modeling vs adjacent concepts
Cost Model Realism: The evaluation standard this modeling serves: whether a backtest's assumed frictions plausibly match live trading. Cost modeling supplies the numbers; realism judges them.
Cost Sensitivity: The stress test built on top of a cost model: re-running results across a range of cost assumptions to see how quickly the edge degrades.
TWAP/VWAP/POV Execution: Execution algorithms designed to reduce the very costs being modeled, chiefly market impact, by slicing large orders across time or volume.
Concept family
Risk, Sizing & Exits
37 concepts mapped · 37 in the Library
Execution Cost Modeling FAQ
Turn Execution Cost Modeling into a trading strategy.
Take the implementation from this page into Quant, then build on it, backtest it on real data, and keep refining it in conversation.