Trading Slippage: Minimize Hidden Costs
Trading slippage is the difference between a chosen reference price and the price at which your order actually fills. It can be unfavorable or favorable. To control it, define the benchmark, understand the order’s trade-offs, and measure actual fills rather than assuming the quote on your screen is an executable promise.
Use LuxAlgo’s native charts to plan the setup, Quant to help test rules with realistic trading costs, and the Journal to review supported trade records. Your broker or execution venue handles live orders. An AI-generated strategy does not automatically route trades or eliminate slippage.
Trading Slippage Basics
What Is Slippage?
Suppose Apple’s displayed bid/ask is $183.50/$183.53. You intend to buy 100 shares and use the $183.53 ask as your reference. If the order fills at $183.54, unfavorable slippage is $0.01 per share, or $1 total, before fees. A fill at $183.57 would instead produce $4 of unfavorable slippage.
If the quote changes before execution, keep the original reference and timestamp when evaluating that decision. Comparing with a later quote answers a different question. A fill can be worse than the decision-time ask while still being better than the ask available when the order reaches the market.
Use a consistent sign convention. With positive values representing unfavorable slippage:
- Buy cost: (average fill price − reference price) × quantity.
- Sell cost: (reference price − average fill price) × quantity.
- Basis points: signed per-unit price difference ÷ reference price × 10,000.
A negative result represents improvement against that benchmark. For futures and other contracts, include the applicable multiplier and currency conversion; a one-point price difference is not necessarily one dollar.
Slippage, Spread, and Market Impact
The bid–ask spread is the gap between quoted selling and buying prices. Market impact is the price effect of executing your own order. Slippage against a decision-time benchmark can reflect movement during a delay, changing liquidity, and your order’s impact.
Keep fees separate and avoid double-counting the spread. If you measure a buy against the midpoint, the cost of crossing to the ask is already part of the price difference. If you measure against the displayed ask, that initial half-spread is not included in the same way. Label the benchmark before comparing brokers or strategies.
What Causes Slippage?
| Cause | What changes | What to inspect |
|---|---|---|
| Volatility and news | Prices move between decision and execution | Announcements, gaps, changing quotes |
| Limited liquidity | Insufficient quantity at the expected price | Spread, available size, venue and session |
| Large order size | The order consumes multiple price levels | Quantity relative to available liquidity |
| Latency or processing delays | The market changes while the order is in transit or queued | Decision, submission, acknowledgment and fill times |
For example, a 300-share buy could receive 100 shares at $50.00 and 200 at $50.03. The weighted average fill is $50.02, making the cost $6 against a $50.00 reference. The last fill alone would overstate the average cost.
How Slippage Affects a Strategy
Small costs matter when trades are frequent or the expected advantage per trade is thin. If a strategy averages $20 gross per completed trade, then $4 of entry slippage, $4 of exit slippage, and $2 of fees leave $10 before any other costs. Across 100 comparable trades, those costs total $1,000.
Do not infer your likely slippage from a broker’s aggregate fill percentage or an unrelated latency study. Product, order size, benchmark, market conditions, and measurement period determine what a statistic means. Keep both favorable and unfavorable fills in your own analysis.
When Slippage Risk Increases
Earnings, central-bank announcements, thin sessions, trading halts, and market reopenings can change both prices and available liquidity. The opening and closing periods may have substantial volume alongside substantial volatility. “Trade at the open” is not a universal cost-reduction rule.
Compare the actual instrument and venue across sessions. Forex liquidity is not defined by the London Stock Exchange’s opening hours: currency pairs trade through a global dealer market, and activity depends on the relevant financial centers, overlap, news, and broker. High volume alone also does not tell you how much liquidity is available at your desired price.
Latency matters most when the opportunity or quote changes quickly, but there is no universal conversion from 300 milliseconds to a fixed annual loss. First establish where your delay occurs and whether it materially affects the strategy’s execution. A faster connection cannot restore liquidity that has disappeared.
Methods to Reduce Slippage
Choose the Order’s Trade-Off
| Order | Control offered | Trade-off |
|---|---|---|
| Market | Seeks available execution | No specified price boundary |
| Limit | Maximum buy or minimum sell price | Partial fill or no fill is possible |
| Stop-market | Activates a market order after a trigger | Can fill beyond the stop during a gap |
| Stop-limit | Activates a limit order after a trigger | May fail to exit when price moves away |
| Eligible guaranteed stop | Provider-specific contractual stop-price protection | Availability, premium and product terms apply |
A limit controls execution price, not the profit or loss after execution. A stop-limit can reduce the acceptable exit-price range while leaving you in the position. Review our order types guide before changing a protective exit solely to avoid slippage.
Some providers offer guaranteed stops on eligible products. For example, CMC Markets’ UK execution FAQ describes a premium-based guaranteed stop and a premium refund if it is not triggered. This is a specific provider feature, not a standard guarantee attached to every stop order or every market.
Compare Liquidity and Volatility Together
Review spreads, available size, event timing, and your own fills by session. Regular market hours may offer deeper liquidity for a particular stock, but a major announcement can still overwhelm that advantage. If a strategy does not require trading an announcement, test whether avoiding that window improves results after costs and missed opportunities.
Manage Large Orders Deliberately
Splitting an order can reduce the amount demanded at one instant. It also introduces waiting risk, more opportunities for prices to move away, and potentially more fees. A stream of small orders is not automatically less costly than one larger order.
Where supported, compare broker execution algorithms, participation constraints, limit prices, and completion deadlines. Evaluate the whole order’s weighted-average fill against a consistent benchmark. Include the cost of unfinished quantity rather than judging only the pieces that filled favorably.
Execution Tools and AI
Smart Order Routing
Smart order routing evaluates available execution venues according to its rules. Interactive Brokers UK’s execution policy describes routing that considers price or total consideration alongside speed. Direct-routing instructions can change the outcome and constrain the broker’s routing choices.
Compare execution quality for your product and order sizes, not just a platform’s feature count or award. Check routing choices, fees, market-data coverage, supported order types, and reports. An interface such as MetaTrader, TradeStation, or a broker API does not by itself guarantee access to deeper liquidity.
Distinguish Execution AI from Strategy Research
RBC Capital Markets describes Aiden as an electronic trading platform using deep reinforcement learning to adapt execution around benchmarks such as arrival price and VWAP. That is a specific institutional execution service; it is not evidence that every AI trading product can route orders or achieve the same results.
LuxAlgo’s Quant supports strategy development and testing. Its value here is making the rules and cost assumptions explicit, then examining whether the strategy remains viable. It does not automatically optimize your broker’s routing or measure historical live slippage from a backtest alone.
Track and Control Slippage with LuxAlgo
Define the Benchmark on Your Chart
Start with the intended symbol, venue, session, and timeframe in LuxAlgo’s native charts. Record the decision price and time before entry. If you evaluate against VWAP, specify the data and exact time window; a chart’s current anchored VWAP is not automatically the benchmark used by a broker’s execution algorithm.
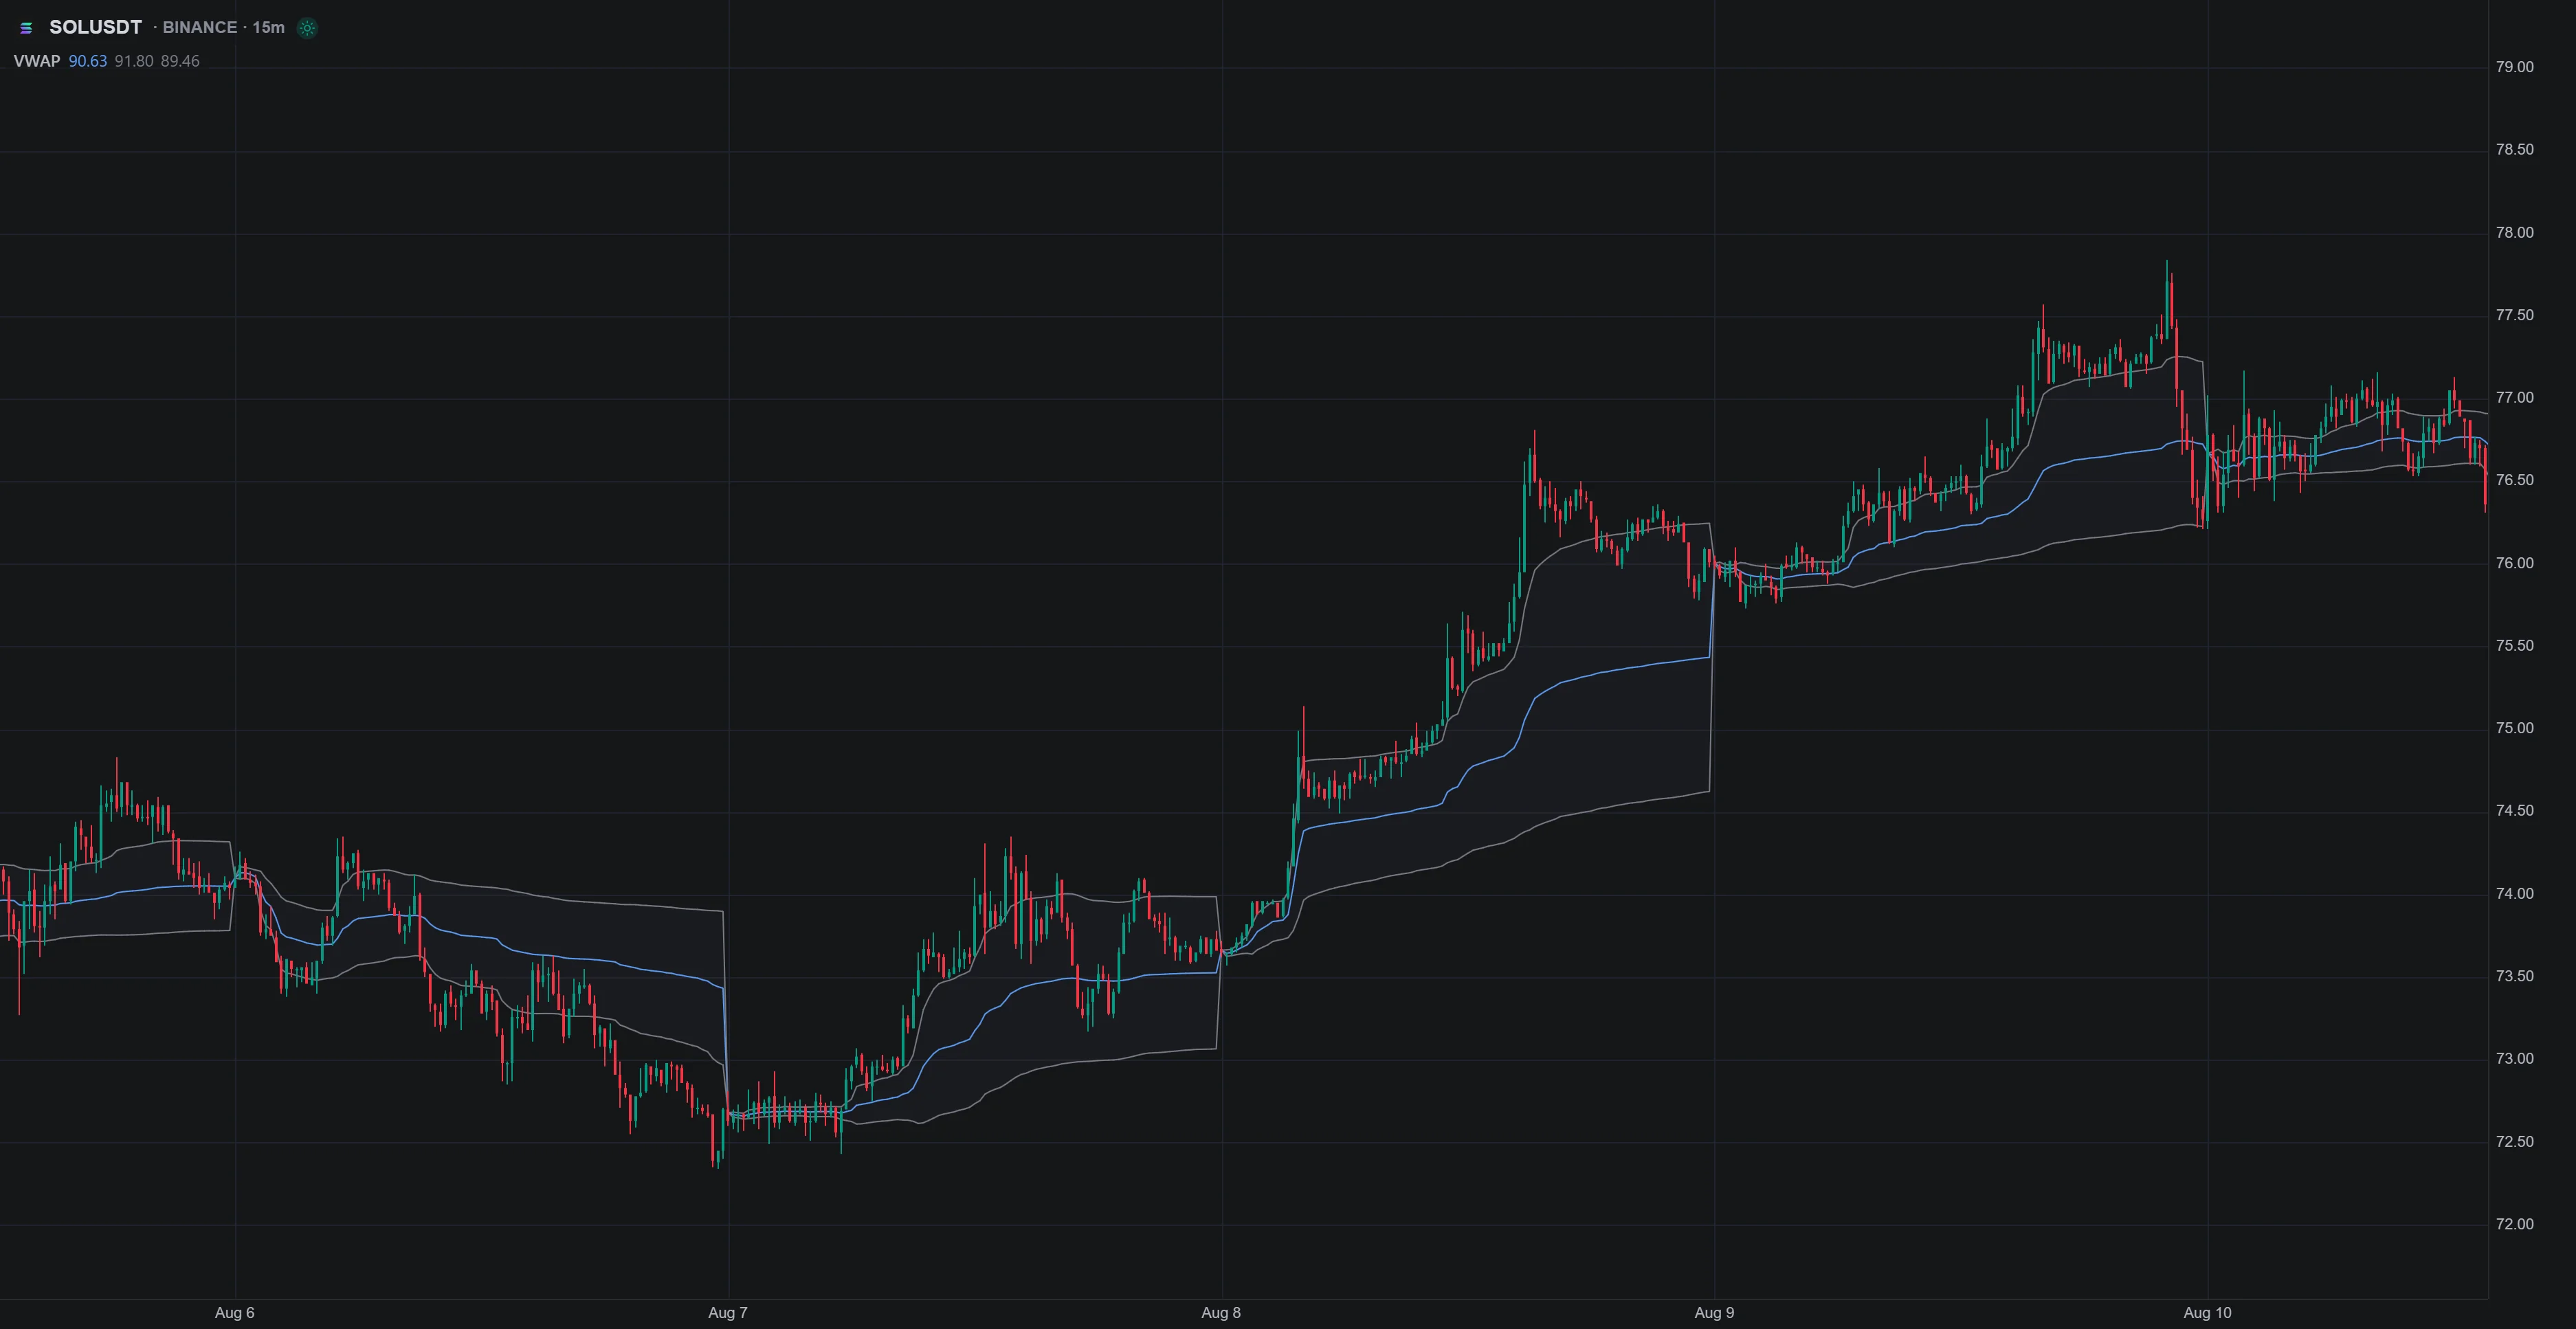
Use the VWAP documentation to check the anchor and calculation settings. A different feed or window can produce a different average, so avoid calling every difference from the line “broker slippage.”
Stress-Test Costs in Quant
Ask Quant to help create an explicit entry and exit strategy, inspect the generated logic, then compare results under different commission and slippage assumptions. Hold the trading rules constant while changing costs so you can identify how sensitive the result is.
Example research prompt: “Create this strategy with explicit entry, exit, and sizing rules. Explain the fill assumptions and the units used for slippage. Help compare baseline and higher-cost scenarios without changing the signal rules. Show which results depend on assumptions that historical bars cannot verify.”
Include both entry and exit costs, use the correct tick size and contract multiplier, and check partial-fill or missed-fill limitations. Constant simulated slippage is an approximation; it does not reproduce changing liquidity, queue position, news gaps, or your actual routing.
If you export Pine Script® to TradingView, validate the cost settings there. TradingView’s strategy documentation explains its commission and slippage simulation. A zero-cost backtest should not be treated as a live execution forecast.
Reconcile Actual Fills in the Journal
Use the LuxAlgo Journal for supported trade records and add the decision-time context that imports may not contain. Record intended price, actual weighted-average fill, side, quantity, fees, session, order type, and any execution problem. A trade record alone cannot reconstruct a missing historical quote.

Group results by instrument, session, order size, event window, and order type. Review average cost and unusually poor fills, and include favorable slippage too. Investigate whether a change improves total net results rather than just the execution cost on a selected set of filled trades.
Set Meaningful Limits and Tolerances
There is no universal “normal” slippage tolerance of 0.3–0.5%. A percentage may be far too large for one strategy and irrelevant to the controls available for another. Distinguish these mechanisms:
- A broker limit price constrains the acceptable execution price of that order.
- A monitoring threshold flags unexpectedly costly fills for review but does not prevent them.
- A crypto swap tolerance controls acceptable changes under the application’s transaction rules.
Uniswap’s swap documentation describes minimum-output or maximum-input constraints that can make a swap revert when they are violated. Price impact from the trade’s own size is a separate consideration. Raising tolerance permits a worse outcome within that bound; it is not a promise of an accurate or profitable trade.
Choose controls using the strategy’s expected edge, observed execution data, position risk, and the actual venue’s features. Do not widen tolerances reflexively during volatility or assume a percentage setting applies to ordinary stock or futures market orders.
A Practical Slippage Review Routine
- Define the decision-time benchmark and record it before trading.
- Choose order type, size, and timing with explicit price-versus-fill trade-offs.
- Include realistic costs and adverse scenarios in strategy tests.
- Compare actual fills with the benchmark using consistent units and signs.
- Adjust the execution process only after reviewing net results and missed trades.
Slippage cannot always be avoided, but it can be measured and incorporated into decisions. Better records and realistic testing help reveal when execution costs are consuming the strategy’s expected advantage.
Read next