Moon Phases: Lunar Cycles in Trading
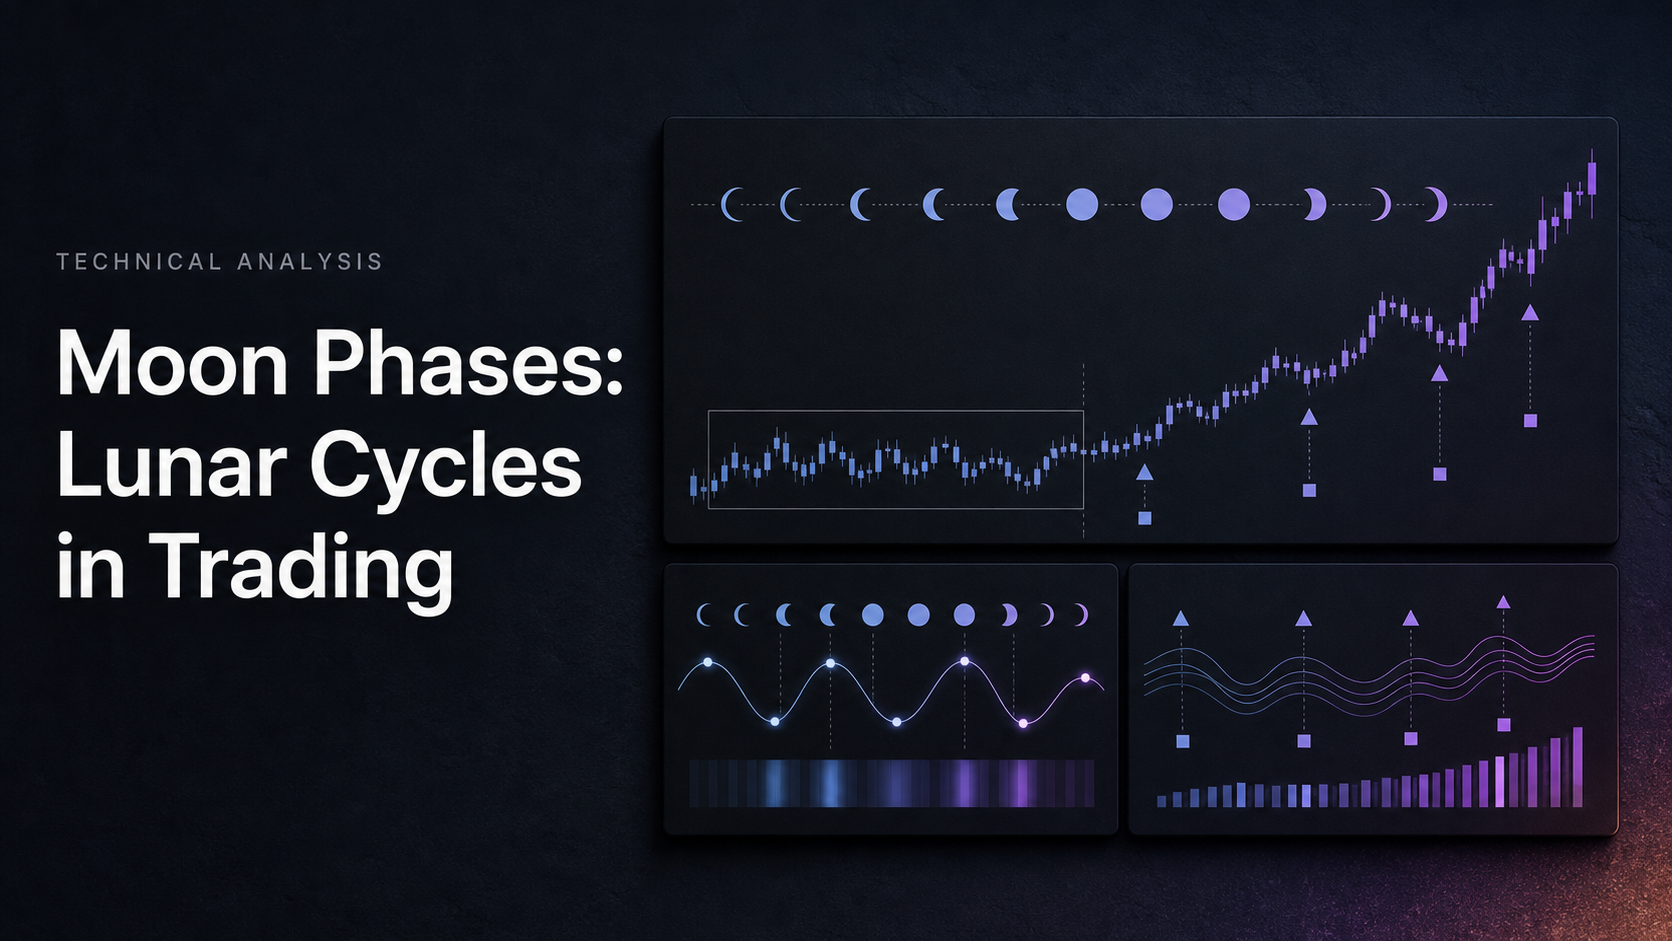
Moon phase trading assigns market meaning to the lunar cycle: the synodic month of about 29.53 days that runs from one new moon through first quarter, full moon and last quarter to the next new moon. The usual claim is that returns behave differently in the new-moon half of the cycle than in the full-moon half. That claim has been tested in academic finance. The measured effects are small, they vary by sample, and no mechanism has been established, so lunar timing is a hypothesis to test rather than an edge to trust.
Lunar traders typically assume that a New Moon marks fresh trends, a First Quarter builds momentum, a Full Moon brings volatility or reversals, and a Third Quarter brings consolidation. None of these assumptions is supported by a known cause. What the literature does contain is a handful of studies reporting higher average returns around new moons than around full moons in some markets and decades, alongside work that finds the effect weak, unstable or absent.
The tools to test the idea are ordinary. TradingView ships a built-in Moon Phases indicator, and the LuxAlgo Moon Phases Strategy in the Library opens on Quant Charts in one click, where its rules can be run against history. To change a rule, ask Quant, our coding agent, to help edit it, inspect the Code and click Run. This guide covers the cycle, the common rules, the published evidence, and how to evaluate a lunar strategy honestly.
Can Moon Phases Predict Stocks? A Backtesting Video
Quantified Strategies published this video, “Can Moon Phases Predict Stocks? Backtests Say Yes!”, in April 2025. The title states the channel’s conclusion. Treat any backtest shown as one sample with its own rules, costs and period, and compare it with the studies and the testing protocol below before drawing your own.
How the Moon Phases Indicator Works
A moon phase indicator converts the lunar calendar into chart marks. It does not read price; it computes where the Moon is in its cycle at the time of each bar and labels the bars that contain a new or full moon. Everything else, including any trading rule, is a layer added on top of that calendar.
The 4 Main Moon Phases Explained
The synodic month averages 29.530589 days, so each quarter phase arrives about 7.38 days after the previous one. Individual cycles vary by several hours around that mean, which is why a fixed-period approximation drifts slowly unless it is re-anchored to a documented new moon.
| Phase | Astronomy | Approximate timing | What lunar traders typically assume |
|---|---|---|---|
| New Moon | Moon between Earth and Sun; disc dark | Day 0 | Start of a new trend or sentiment cycle |
| First Quarter | Half illuminated, waxing | About day 7.4 | Momentum builds behind the prevailing move |
| Full Moon | Earth between Sun and Moon; disc fully lit | About day 14.8 | Volatility, exhaustion or reversal |
| Last Quarter | Half illuminated, waning | About day 22.1 | Consolidation and weakening trends |
The right-hand column is belief, not measurement. Published studies compare average returns in windows around new and full moons; they do not test the quarter-phase stories at all, and none of them claims that a particular phase reverses trends.
Common Moon Phase Trading Strategies
Because the calendar is known years in advance, lunar rules are easy to state precisely. The four variants below correspond to the condition options in the LuxAlgo Moon Phases Strategy, where the buy rule and the sell rule are chosen independently.
| Rule | Entry logic | What it assumes | How to judge it |
|---|---|---|---|
| Buy the new moon, sell the full moon | Long during the waxing half, flat or short during the waning half | Returns are higher around new moons | Compare with buy-and-hold and with shuffled dates |
| Buy the full moon, sell the new moon | The inverse cycle | The opposite bias, or a market where the first rule failed | If both directions “work” in different samples, neither is evidence |
| Higher moon | Buy when the close at the latest lunar event is above the close at the previous event | Trend persistence measured on a lunar clock | Compare with a plain 15-day momentum rule |
| Lower moon | Buy when the close at the latest event is below the previous one | Mean reversion on a lunar clock | Compare with a plain 15-day reversal rule |
Every variant flips position on a schedule of about 24.7 lunar events per year, so trade count and transaction costs are built into the design. A lunar rule that “works” only before costs has not worked.
Using Moon Phases with Other Indicators
Traders often add a filter, such as taking new-moon longs only when price is above a rising moving average or when a momentum oscillator confirms. A filter can improve a rule, but each added condition is another parameter fitted to the same history. The more combinations tried, the more likely one of them looks good by chance, which the multiple testing problem describes in detail.
Claims that volume or sentiment “spikes” around lunar events would confirm a lunar influence are untested assertions. Yuan, Zheng and Zhu found that the return difference they measured was not explained by changes in volatility or trading volume, which cuts against the idea that lunar dates visibly change market activity. Define the complete rule, including every filter, before the test, and record how many rules were tried.
Historical Performance and Market Analysis
The evidence is more interesting than either “the moon moves markets” or “studies find nothing”. Several peer-reviewed papers report a lunar return difference. The reasons for caution are the size of the effect, its instability across samples, the absence of a mechanism, and the ease of finding calendar patterns in noisy data after the fact.
Backtested Results Analysis
| Study | Sample | Reported finding |
|---|---|---|
| Dichev and Janes (2003) | Major US indexes over about 100 years and indexes of 24 other countries over about 30 years | Returns in the 15 days around new moons roughly double those in the 15 days around full moons |
| Yuan, Zheng and Zhu (2006), Journal of Empirical Finance | 48 countries, global equal- and value-weighted portfolios | Returns lower around full moons than new moons by about 3% to 5% per year; not explained by volatility, volume, macro announcements or other calendar anomalies |
| Keef and Khaled (2011), Journal of Empirical Finance | 62 international indices, 1988 to 2008, panel model with calendar controls | An enhanced new-moon effect independent of GDP; an overall full-moon effect absent |
| LuxAlgo Library, astro cycles | Review of the method family | No robust statistical evidence; reported lunar correlations are tiny, unstable across periods and markets, and consistent with false positives from testing many calendars |
A difference of 3% to 5% per year between halves of the cycle sounds tradable until costs enter. A rule that flips at every new and full moon trades about 25 times a year. At a hypothetical all-in cost of 0.10% per flip, including spread and slippage, the drag is roughly 2.5% per year; at 0.05% it is about 1.2%. Either figure consumes a large share of the reported effect before any drift in the effect itself is considered.
The studies also measure average returns over long windows and many markets. A single trader on a single index over a few years faces a much noisier sample, in which a real 0.3% monthly difference is indistinguishable from luck. Long-horizon backtests are the minimum, and they still cannot rule out data mining in the original discovery.
Moon Phase Strategies vs. Traditional Methods
A lunar rule differs from a price-based rule in one important way: it never looks at the market. A moving-average or breakout rule at least responds to what price is doing, so its trades cluster in the conditions the rule was built for. A calendar rule trades on schedule regardless of trend, news or liquidity, and its performance is entirely a bet that the calendar itself carries information.
That makes the right benchmark clear. Compare the lunar rule with buy-and-hold over the same period, and with the same rule run on randomly shifted or shuffled dates using randomization tests. If the true lunar dates do not beat most random calendars, the rule has no case. Other calendar effects, such as turn-of-month or day-of-week patterns, should be controlled for in the same way, because a lunar window can overlap them by accident.
Problems and Criticisms of Lunar Cycle Trading
Critics start with mechanism. Tidal forces are real but act on oceans, not on order flow, and the mood-based explanations offered in the literature are conjectures rather than measured channels. Writing on the subject in March 2025, Sofien Kaabar, CFA, concluded that “despite its intrigue, it lacks scientific validity.”
The second problem is statistical. An unlimited supply of astronomical events can be matched to any price history after the fact, and the appearance of a pattern in one sample says little about the next. The third is behavioral: hits are remembered, misses are reinterpreted, and a rule with a 50% hit rate can feel reliable. Finally, the cycle itself drifts by hours from cycle to cycle, so a fixed-period approximation needs a documented reference date, and results on intraday charts depend on session boundaries and on which clock the chart uses.
Practical Implementation with Modern Trading Tools
If you want to examine lunar timing, do it the same way you would examine any other rule: plot it, define it completely, run it over long history with costs, and compare it with sensible baselines.
Setting Up the Moon Phases Indicator
On TradingView, the built-in Moon Phases indicator marks a new moon with a dark circle and a full moon with a bright circle, and colors the bars between them as waxing or waning. It is a visual overlay only; it takes no trades and exposes no strategy settings.
On Quant Charts, open the Moon Phases Strategy page in the LuxAlgo Library and click Open on Quant Charts. Because it is a strategy script, it plots the lunar labels and also records simulated entries and exits, so the Backtest Summary is available as soon as you click Run.
A new moon is an instant in universal time. On a daily chart the marker lands on the bar that contains that instant, which can differ by a day between an exchange session in New York and one in Tokyo. On intraday charts, check which session the marked bar belongs to before comparing results across markets.
Best Practices for Effective Usage
- Write the rule first. Direction, entry event, exit event, stop, costs and the markets to test, all before looking at results.
- Use long history. Ten years of daily data contains only about 124 lunar cycles. Fewer than that leaves almost no statistical power.
- Include costs. A schedule of about 25 flips a year makes commission, spread and slippage first-order inputs, not afterthoughts.
- Compare with random calendars. Run the identical rule on shuffled or shifted dates many times and see where the true dates rank.
- Hold out data. Choose the rule on one period and evaluate it on another that was never used for selection.
- Keep a log. Record every variant tried, so the final result can be read in the context of how many attempts produced it.
Using LuxAlgo’s Moon Phases Strategy
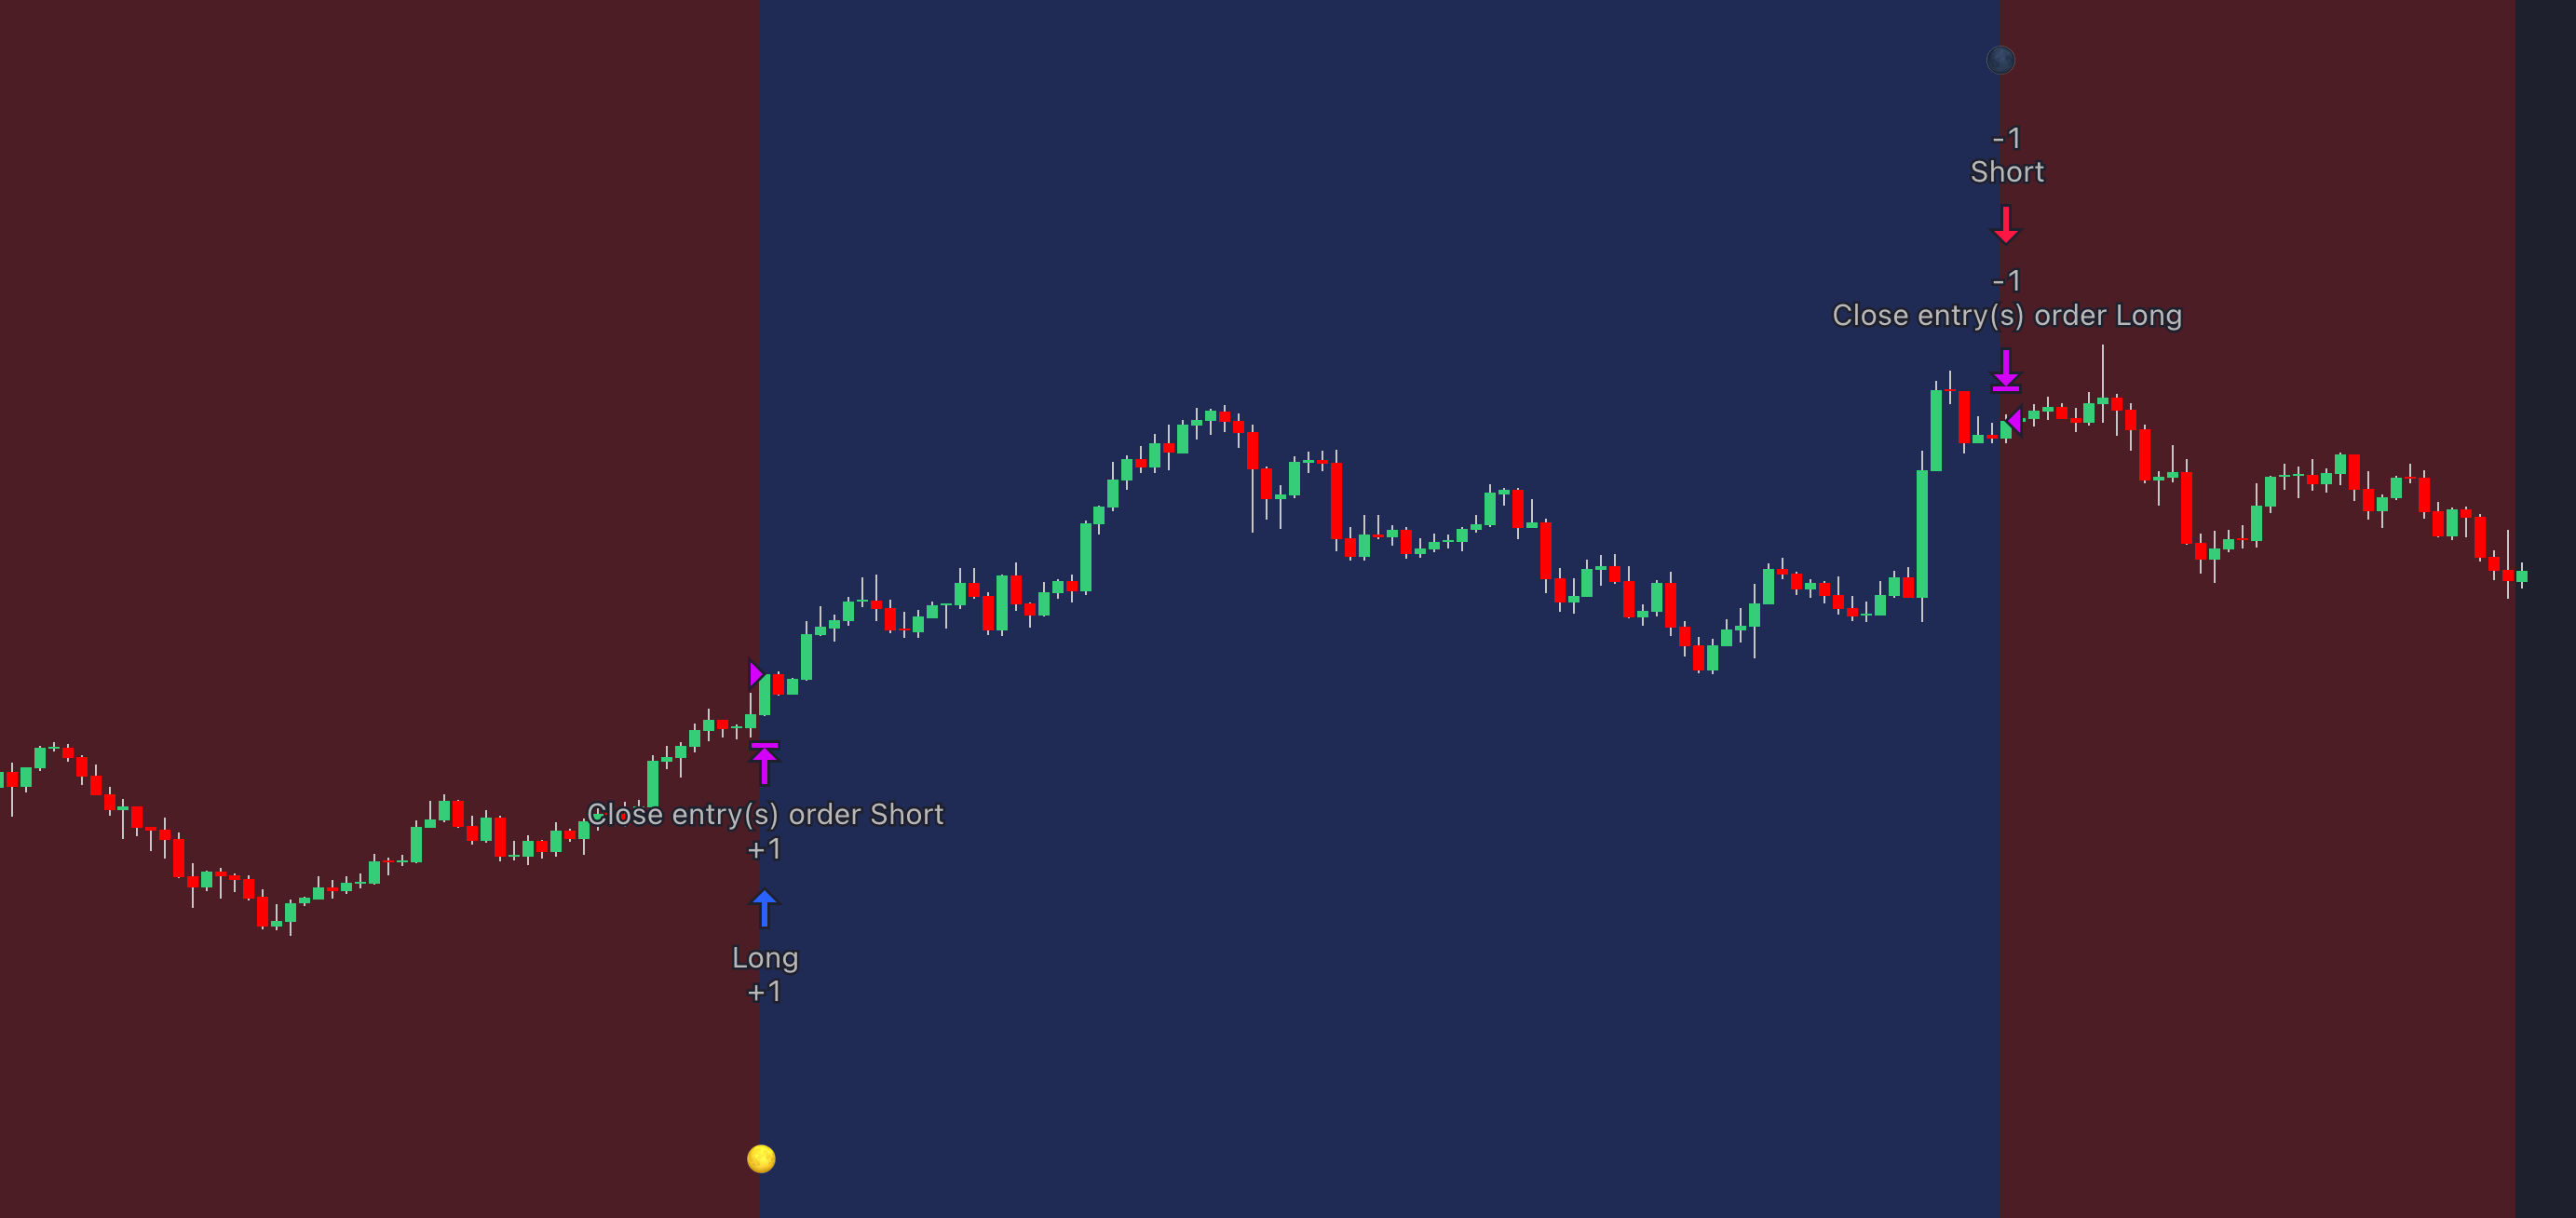
The strategy is published under a Creative Commons BY-NC-SA 4.0 license, and its source is available on the Library page. It approximates the cycle with a constant synodic period of 29.530588853 days counted from a reference new moon, and it marks two events per cycle: a new moon and a full moon. Position changes are processed on the close of the bar in which the event occurs.
| Setting | Default in the published source | What it does |
|---|---|---|
| New Moon Reference Date | 13 January 2021, 05:00 | Anchor from which every later phase is projected |
| Buy Conditions | Full Moon | Lunar event that opens a long and closes any short; options are New Moon, Full Moon, Higher Moon, Lower Moon |
| Sell Conditions | New Moon | Lunar event that opens a short and closes any long; same four options |
| Long and short colors | Blue and red at 80% transparency | Background shading for the active position |
Higher Moon and Lower Moon compare the close at the most recent lunar event with the close at the previous one, which turns the script into a trend-following or contrarian rule sampled on the lunar clock. Because the buy and sell inputs are independent, the same event can be selected for both, which would open and close on the same bar; check the combination makes sense before reading a result.
// excerpt from Moon Phases Strategy, © LuxAlgo, CC BY-NC-SA 4.0
cycle = 2551442876.8992
diff  = (new + time + day*2) % cycle / cycle
newmoon  = ta.crossover(diff, .5)
fullmoon = diff < diff[1]
The constant is the synodic month in milliseconds. The phase position is the remainder of elapsed time divided by that period, expressed as a fraction of a cycle; one event is detected when the fraction crosses one half and the other when it wraps back toward zero. This is a mean-period approximation, so on lower timeframes the marks can sit a few hours from an almanac time.
After clicking Run, read the whole Backtest Summary rather than the net profit alone: trade count, win rate, maximum drawdown and profit factor, with commission and slippage entered in the strategy properties. The native backtest guide explains each field. To add a filter, a stop or a time-based exit, ask Quant to help implement the change, inspect the Code and click Run again; the Making Strategies with Quant guide shows the workflow. The legacy Backtesting Assistant is a separate product with its own strategy-search workflow and is not required for this test.
The TradingView version of the script runs in TradingView’s strategy tester with the same inputs. TradingView toolkits such as Price Action Concepts can add structure context on that platform, but they do not evaluate lunar rules, and a structure signal near a lunar date is a coincidence until a test says otherwise.
Limitations and Final Considerations
Understanding the Risks and Limitations
The central limitation is the missing mechanism. Earnings, rates, liquidity and positioning move prices through channels that can be observed; the lunar calendar has no such channel, only a statistical association that some samples show and others do not. An association without a mechanism can vanish at any time, and there is no way to know in advance when.
The practical limitations follow from the design. The rule trades on schedule, so it takes every flip through news and illiquid periods alike. It generates roughly 25 trades a year, so costs matter. Its historical results depend on which markets and decades were tested, and a test that tried several variants before settling on one has already spent much of its evidential value.
The Need for Diversified Analysis
If lunar timing is used at all, it belongs as a small, documented experiment beside methods whose inputs are observable: price structure, volatility, volume and the economic calendar. Keep position sizes for the experiment small enough that being wrong for a year costs little, and judge the result by the protocol above rather than by how the last few trades felt.
Key Takeaways for Traders
The lunar cycle is a precise, freely available calendar. Some studies report modest return differences between its halves; others find them weak or absent; none explains why they would exist. The LuxAlgo Moon Phases Strategy makes the rules explicit and testable on Quant Charts, which is the right way to treat the idea: as a hypothesis whose test is cheap and whose result should be read with costs, randomization and out-of-sample checks in view.
Whatever the test shows, the outcome is knowledge about a rule, not a forecast. Markets reward decisions grounded in evidence that can be checked, and a calendar strategy has to earn that standing like any other.
FAQs
Do moon phases actually affect stock returns?
Several published studies report slightly higher average returns around new moons than around full moons in some markets and periods. The differences are small, unstable across samples and unexplained by any known mechanism, so they should be treated as unconfirmed.
What are the four main moon phases used in trading?
New moon, first quarter, full moon and last quarter, spaced about 7.4 days apart across a 29.53-day cycle. Trading beliefs attached to each phase are folklore; the academic tests compare only new-moon and full-moon windows.
Does TradingView have a built-in moon phase indicator?
Yes. TradingView’s Moon Phases indicator marks new moons with a dark circle and full moons with a bright circle and colors the bars between them as waxing or waning. It is a visual overlay and does not trade.
How does the LuxAlgo Moon Phases Strategy decide when to trade?
It projects new and full moons from a reference date using a fixed 29.53-day period and opens or reverses positions at the events you select as buy and sell conditions. Higher Moon and Lower Moon compare closes at consecutive lunar events instead.
Can I backtest the Moon Phases Strategy on Quant Charts?
Yes. Open it from its Library page with Open on Quant Charts and click Run to see the Backtest Summary. Ask Quant to help add filters or exits, inspect the Code and run again. Enter commission and slippage before judging the result.
How should I test a lunar strategy honestly?
Define the full rule in advance, use at least ten years of data, include costs, compare with buy-and-hold and with the same rule on shuffled dates, evaluate on a held-out period and record every variant you tried.
References
LuxAlgo Resources
- Quant Charts
- LuxAlgo Quant
- Moon Phases Strategy
- Astro Cycles Concept
- Multiple Testing Correction
- Randomization Tests
- Turn-of-Month Effects
- Day-of-Week Effects
- Native Backtest Guide
- Making Strategies with Quant
- Price Action Concepts
- Understanding Moving Averages
- Backtesting Assistant
External Resources
- Dichev and Janes — Lunar Cycle Effects in Stock Returns (Semantic Scholar)
- Yuan, Zheng and Zhu — Are Investors Moonstruck? Lunar Phases and Stock Returns
- Keef and Khaled — Further International Evidence on Lunar Phases and Stock Returns
- Sofien Kaabar — Moon Phases in Trading: A Deep Dive
- TradingView — Moon Phases Indicator
- TradingView — Moon Phases Strategy [LuxAlgo] Script
Read next