Support and Resistance Basics in Range-Bound Markets
Want to trade range-bound markets effectively? Mastering support and resistance levels is key. These levels define predictable price zones where traders can plan entries, exits, and risk management.
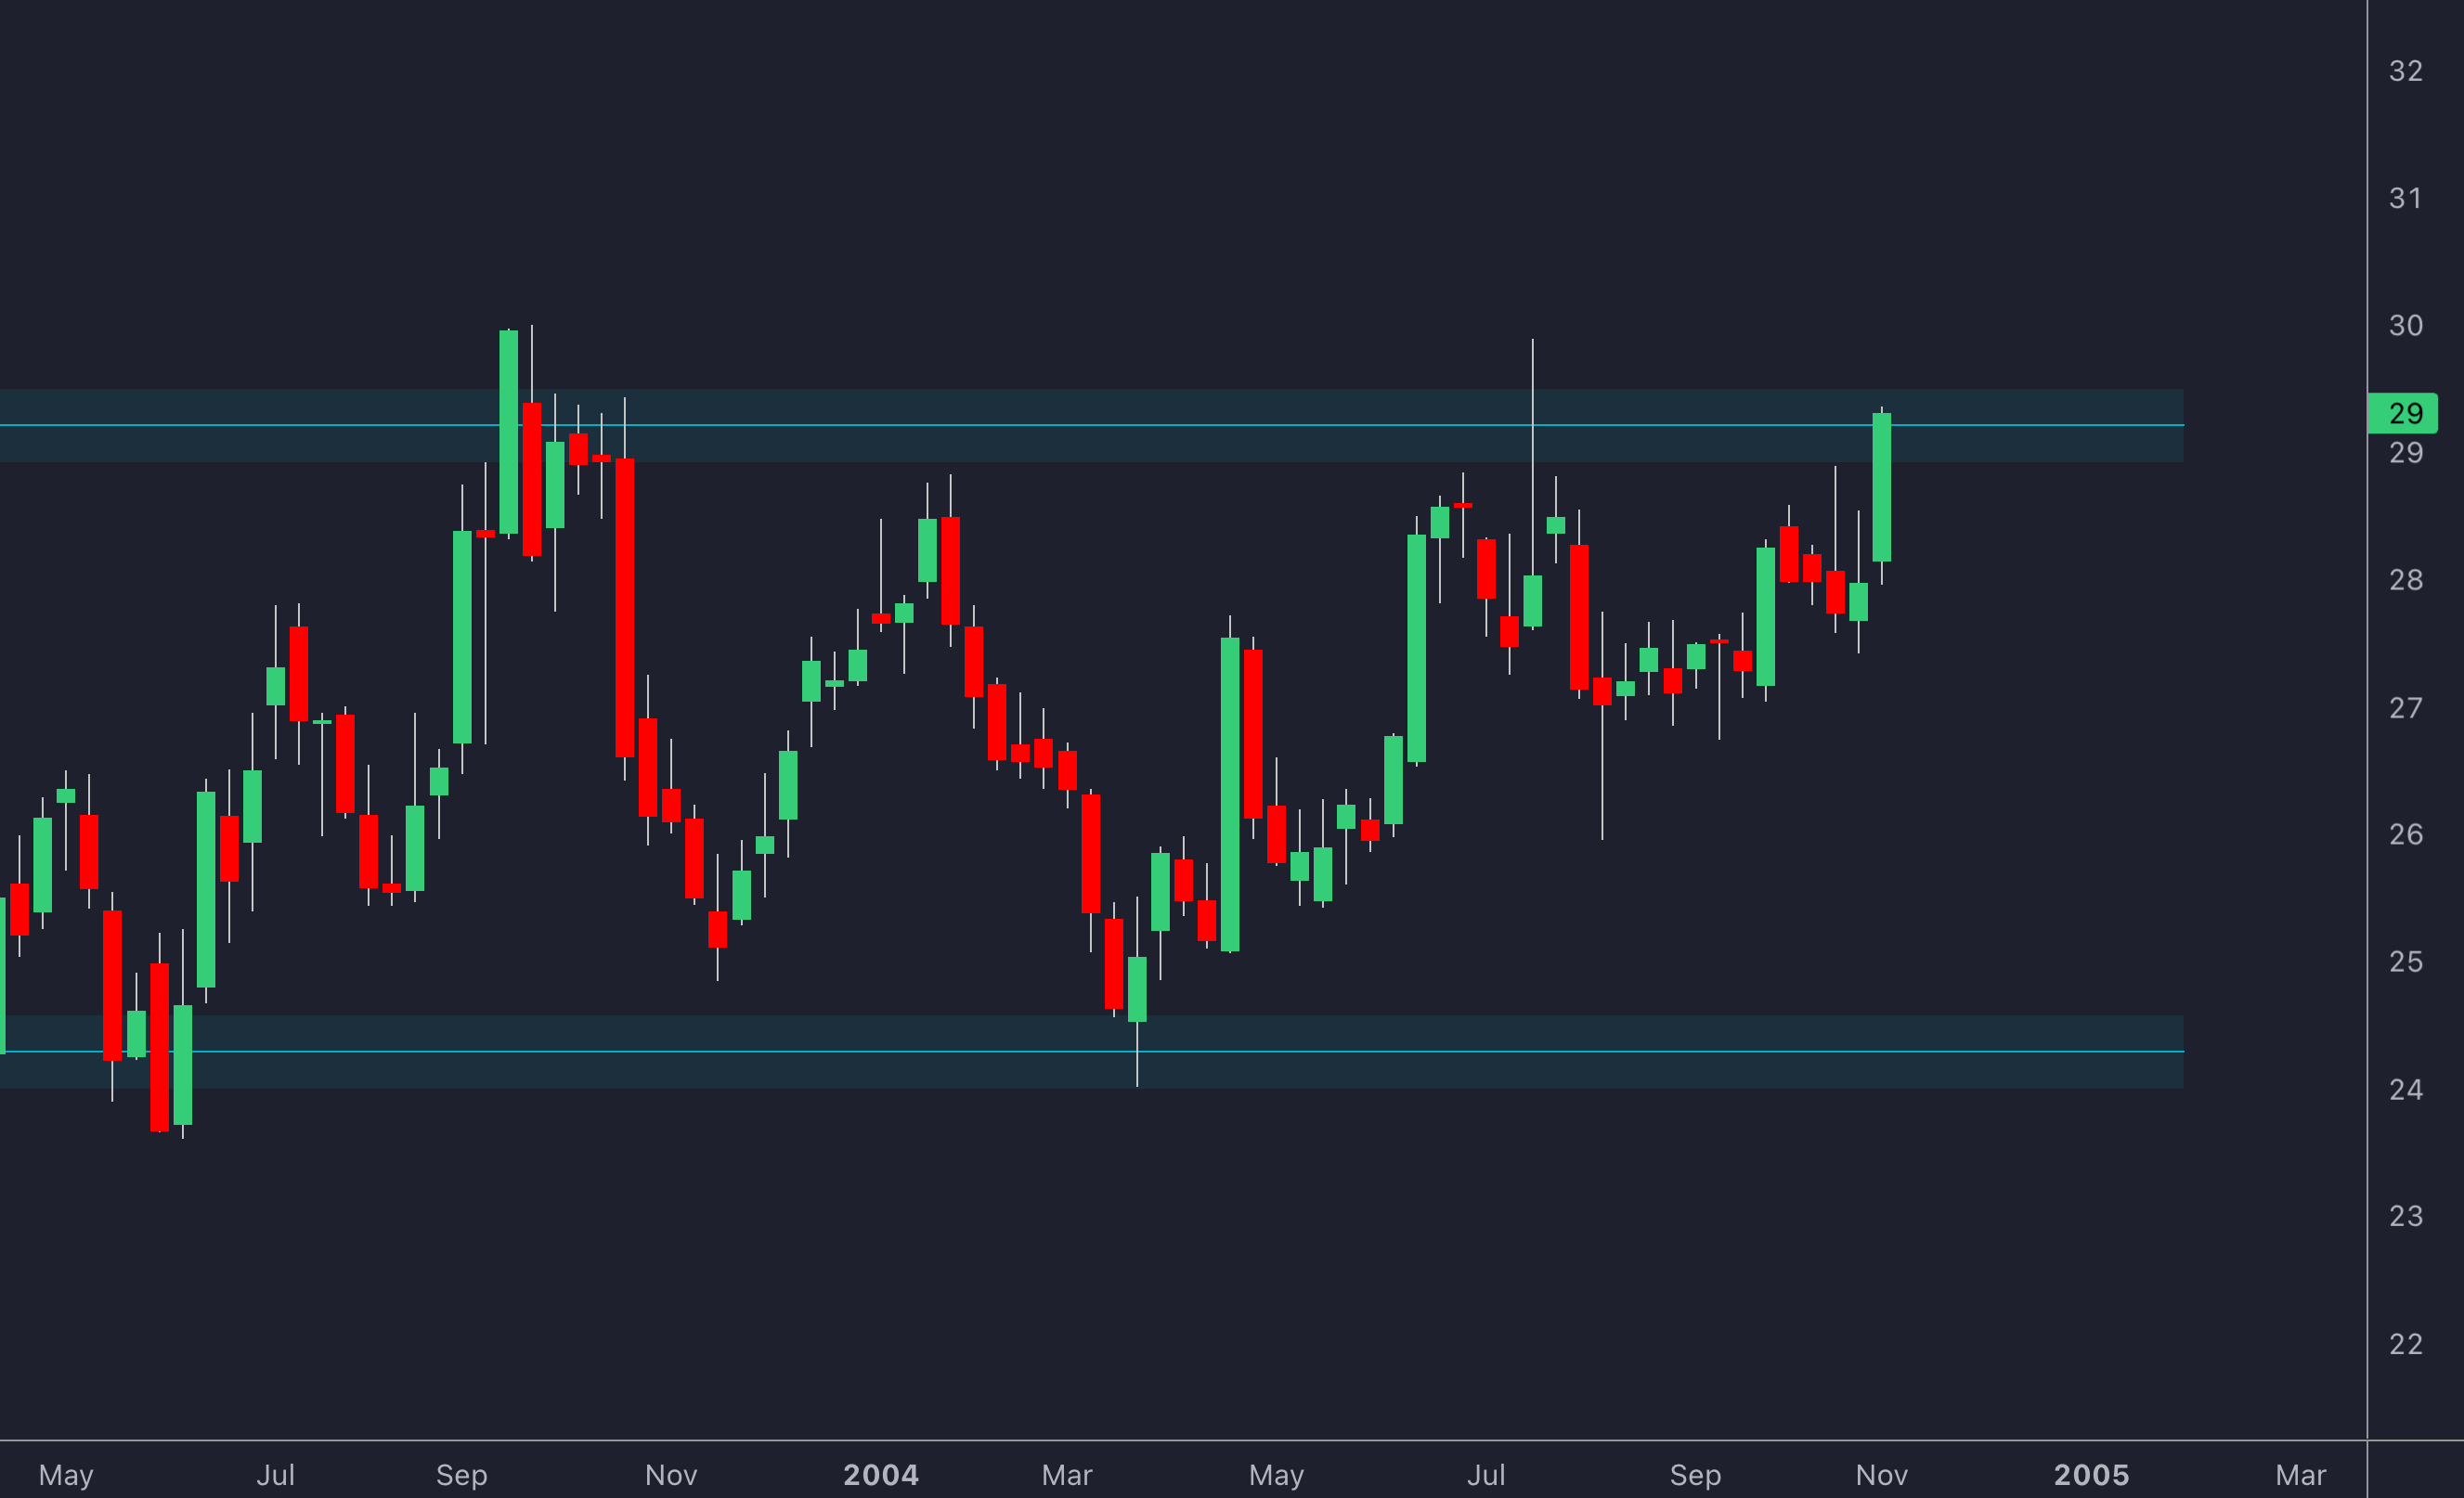
Key Takeaways:
- Support: Price level where buying prevents further declines.
- Resistance: Price level where selling halts upward moves.
- Range Trading Basics: Focus on price bouncing between support and resistance.
- Confirmation Tools: Use volume, price action, and indicators like RSI or moving averages.
- Risk Management: Place stop-loss orders beyond key levels and size positions based on range width.
Quick Tips:
- Identify support/resistance with price action and technical indicators.
- Avoid false breakouts by confirming with volume and multi-timeframe analysis.
- Manage risk by using ATR-based stops and adjusting for volatility.
This guide breaks down how to find and trade these levels, avoid common mistakes, and refine your strategy using the free trading indicators, exclusive signal alerts, and risk management features available on TradingView through LuxAlgo.
How to Trade Ranging Markets: 4 Useful Chart Patterns for Range Bound Markets
Finding Support and Resistance Levels
Traders pinpoint important price zones by analyzing charts and confirming patterns with technical signals.
Price Action Analysis
Price action is the starting point for spotting support and resistance areas. Instead of focusing on exact price points, look for zones where price repeatedly reacts. For example, if Bitcoin consistently attracts buyers between $39,800 and $40,200, this range represents a support area, not a strict level at $40,000.
Here are some common price action patterns that highlight potential support and resistance:
| Pattern Type | Description |
|---|---|
| Swing Points | Clusters of price reactions around levels |
| Round Numbers | Psychological levels like $50 or $100 |
Indicator Confirmation
Price action is essential, but technical indicators add another layer of validation – especially when deciding entry or exit points in range trading. Moving averages, such as the 50-day and 200-day MAs, often act as dynamic support or resistance. For instance, when a stock approaches its 200-day moving average from below, it often faces selling pressure, reinforcing that level as resistance.
Additionally, spikes in trading volume at reversal points strengthen the reliability of these levels.
LuxAlgo Price Action Concepts (PAC) Toolkit
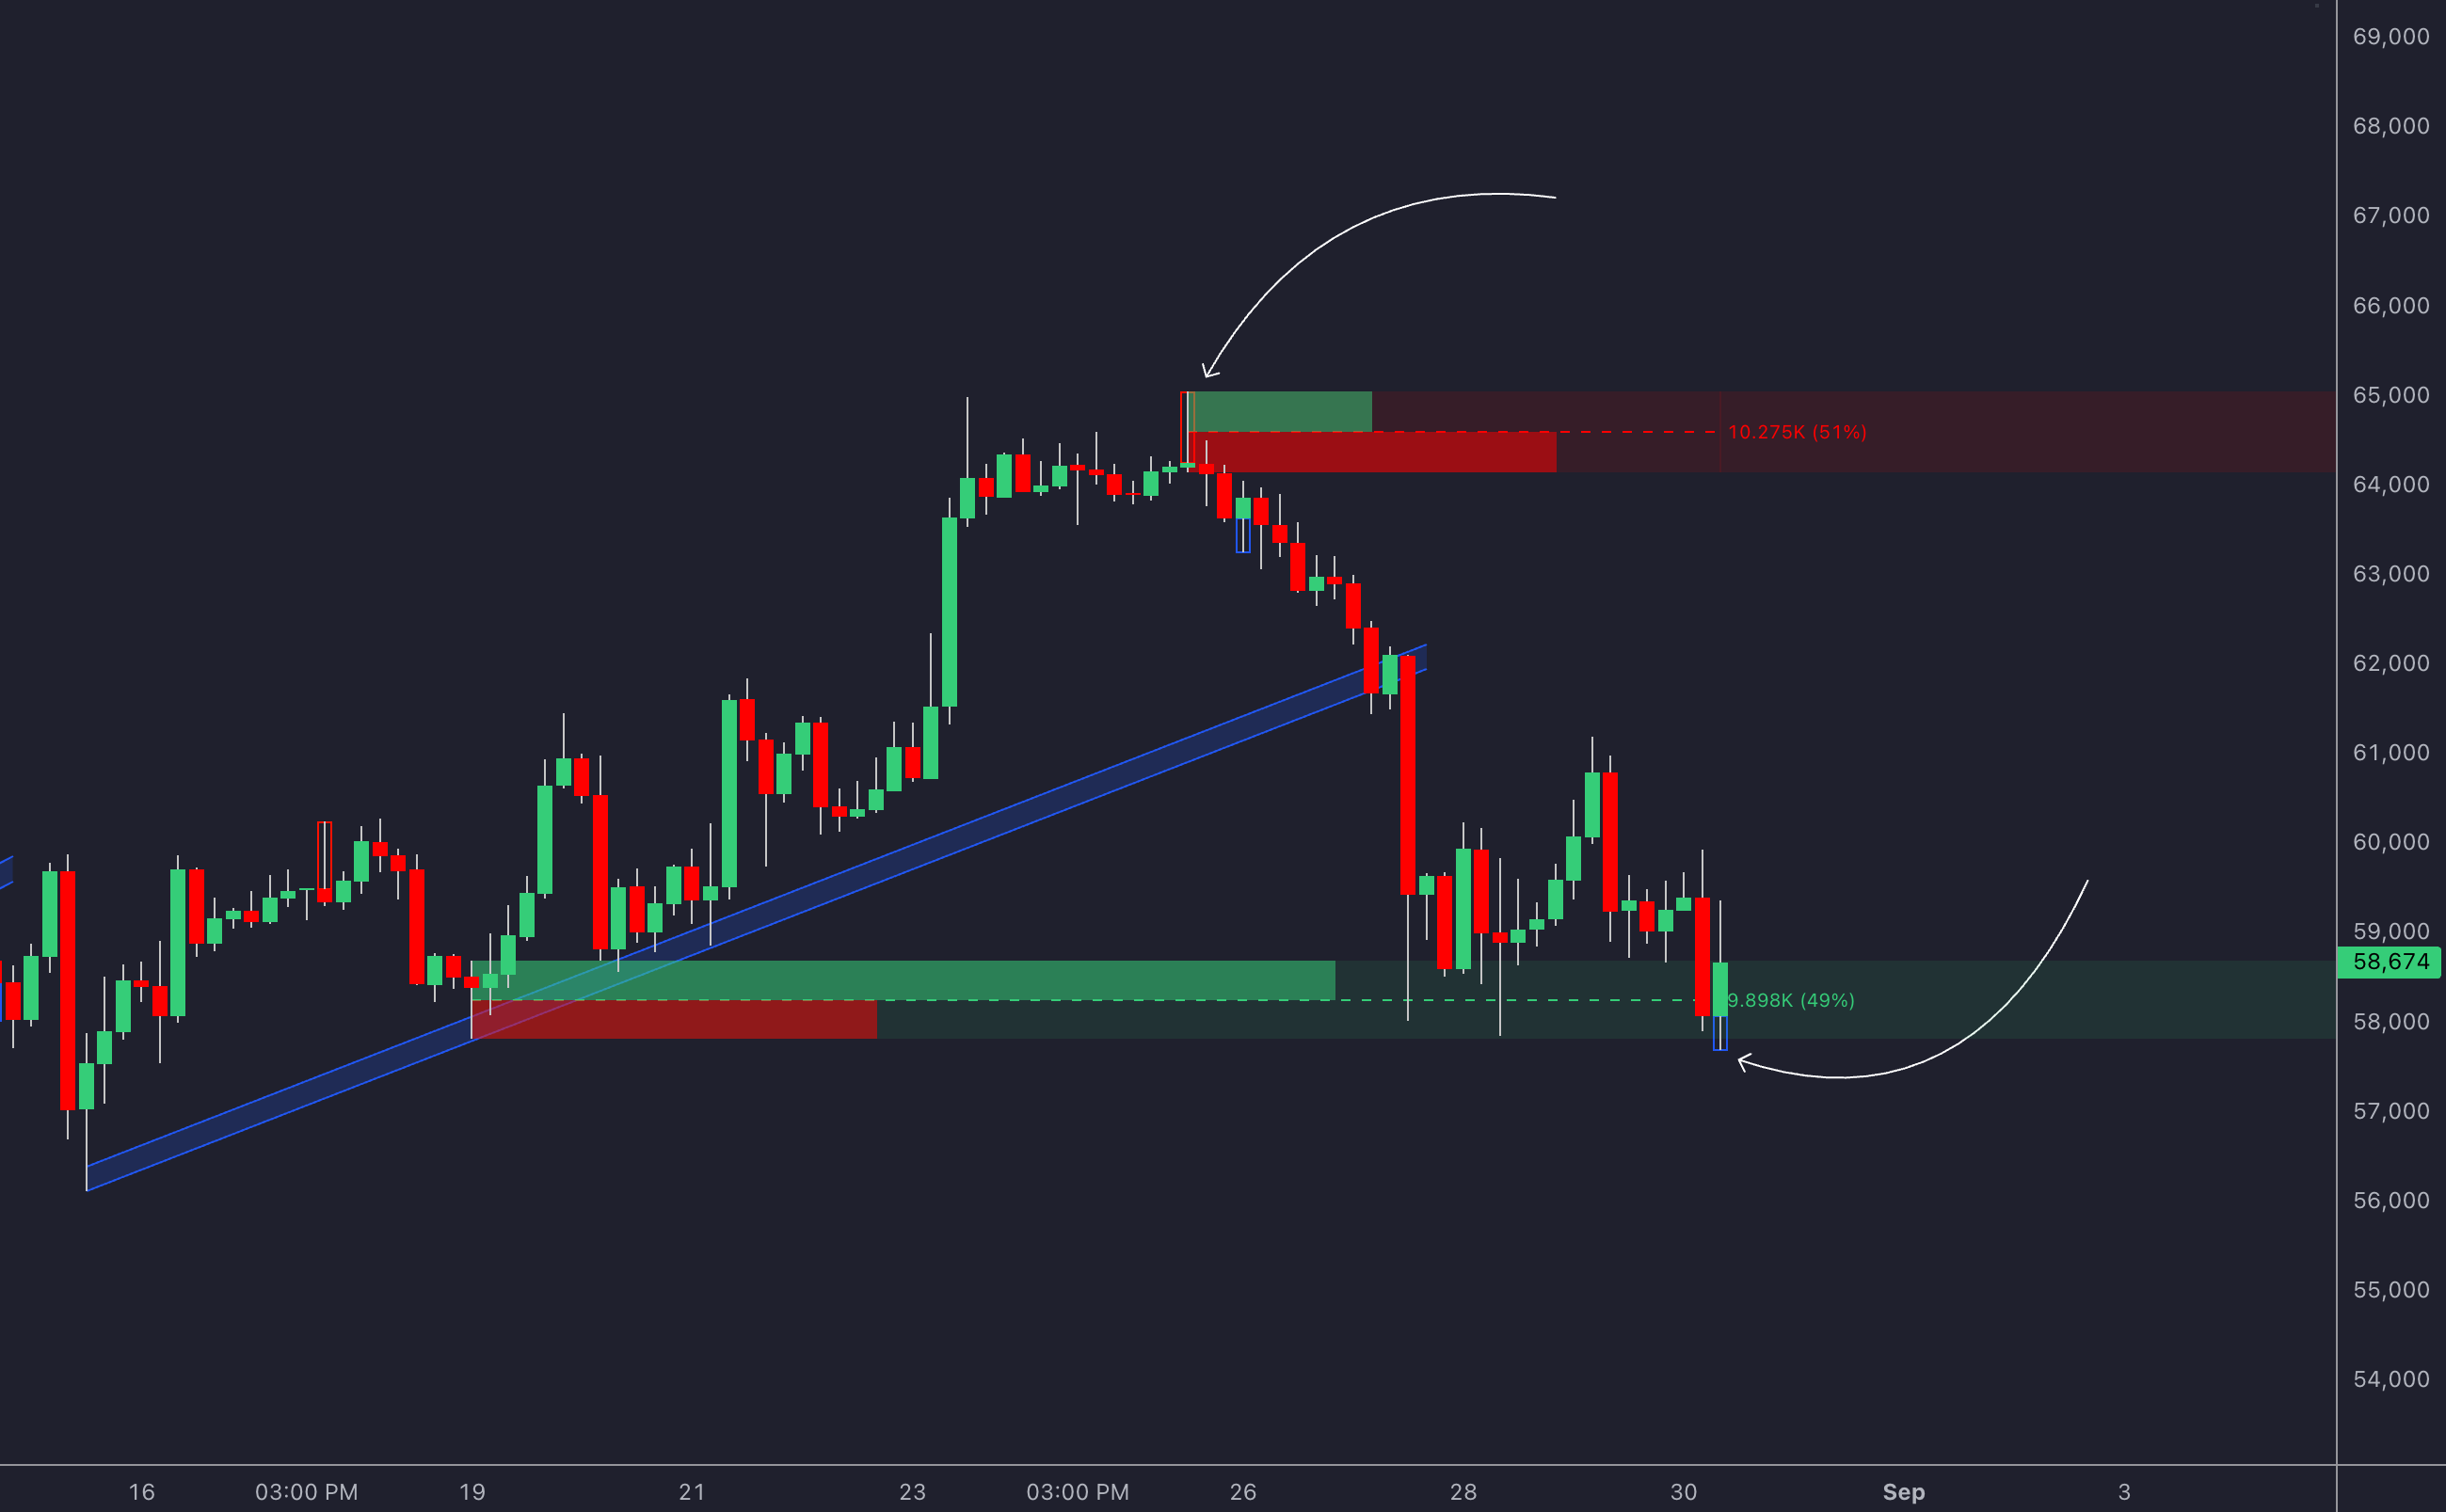
LuxAlgo’s Price Action Concepts (PAC) toolkit simplifies the process of detecting support and resistance by analyzing historical price data across different timeframes.
Here’s a breakdown of PAC’s key features:
| Feature | Function | Application |
|---|---|---|
| Dynamic Zone Detection | Automatically identifies reaction zones | Highlights active support/resistance areas |
| Multi-timeframe Analysis | Scans multiple timeframes simultaneously | Shows overlapping levels across periods |
Pair PAC’s automated insights with manual analysis to minimize false signals. These exclusive features are especially helpful for preparing range-based trading strategies.
LuxAlgo Range Detector Indicator
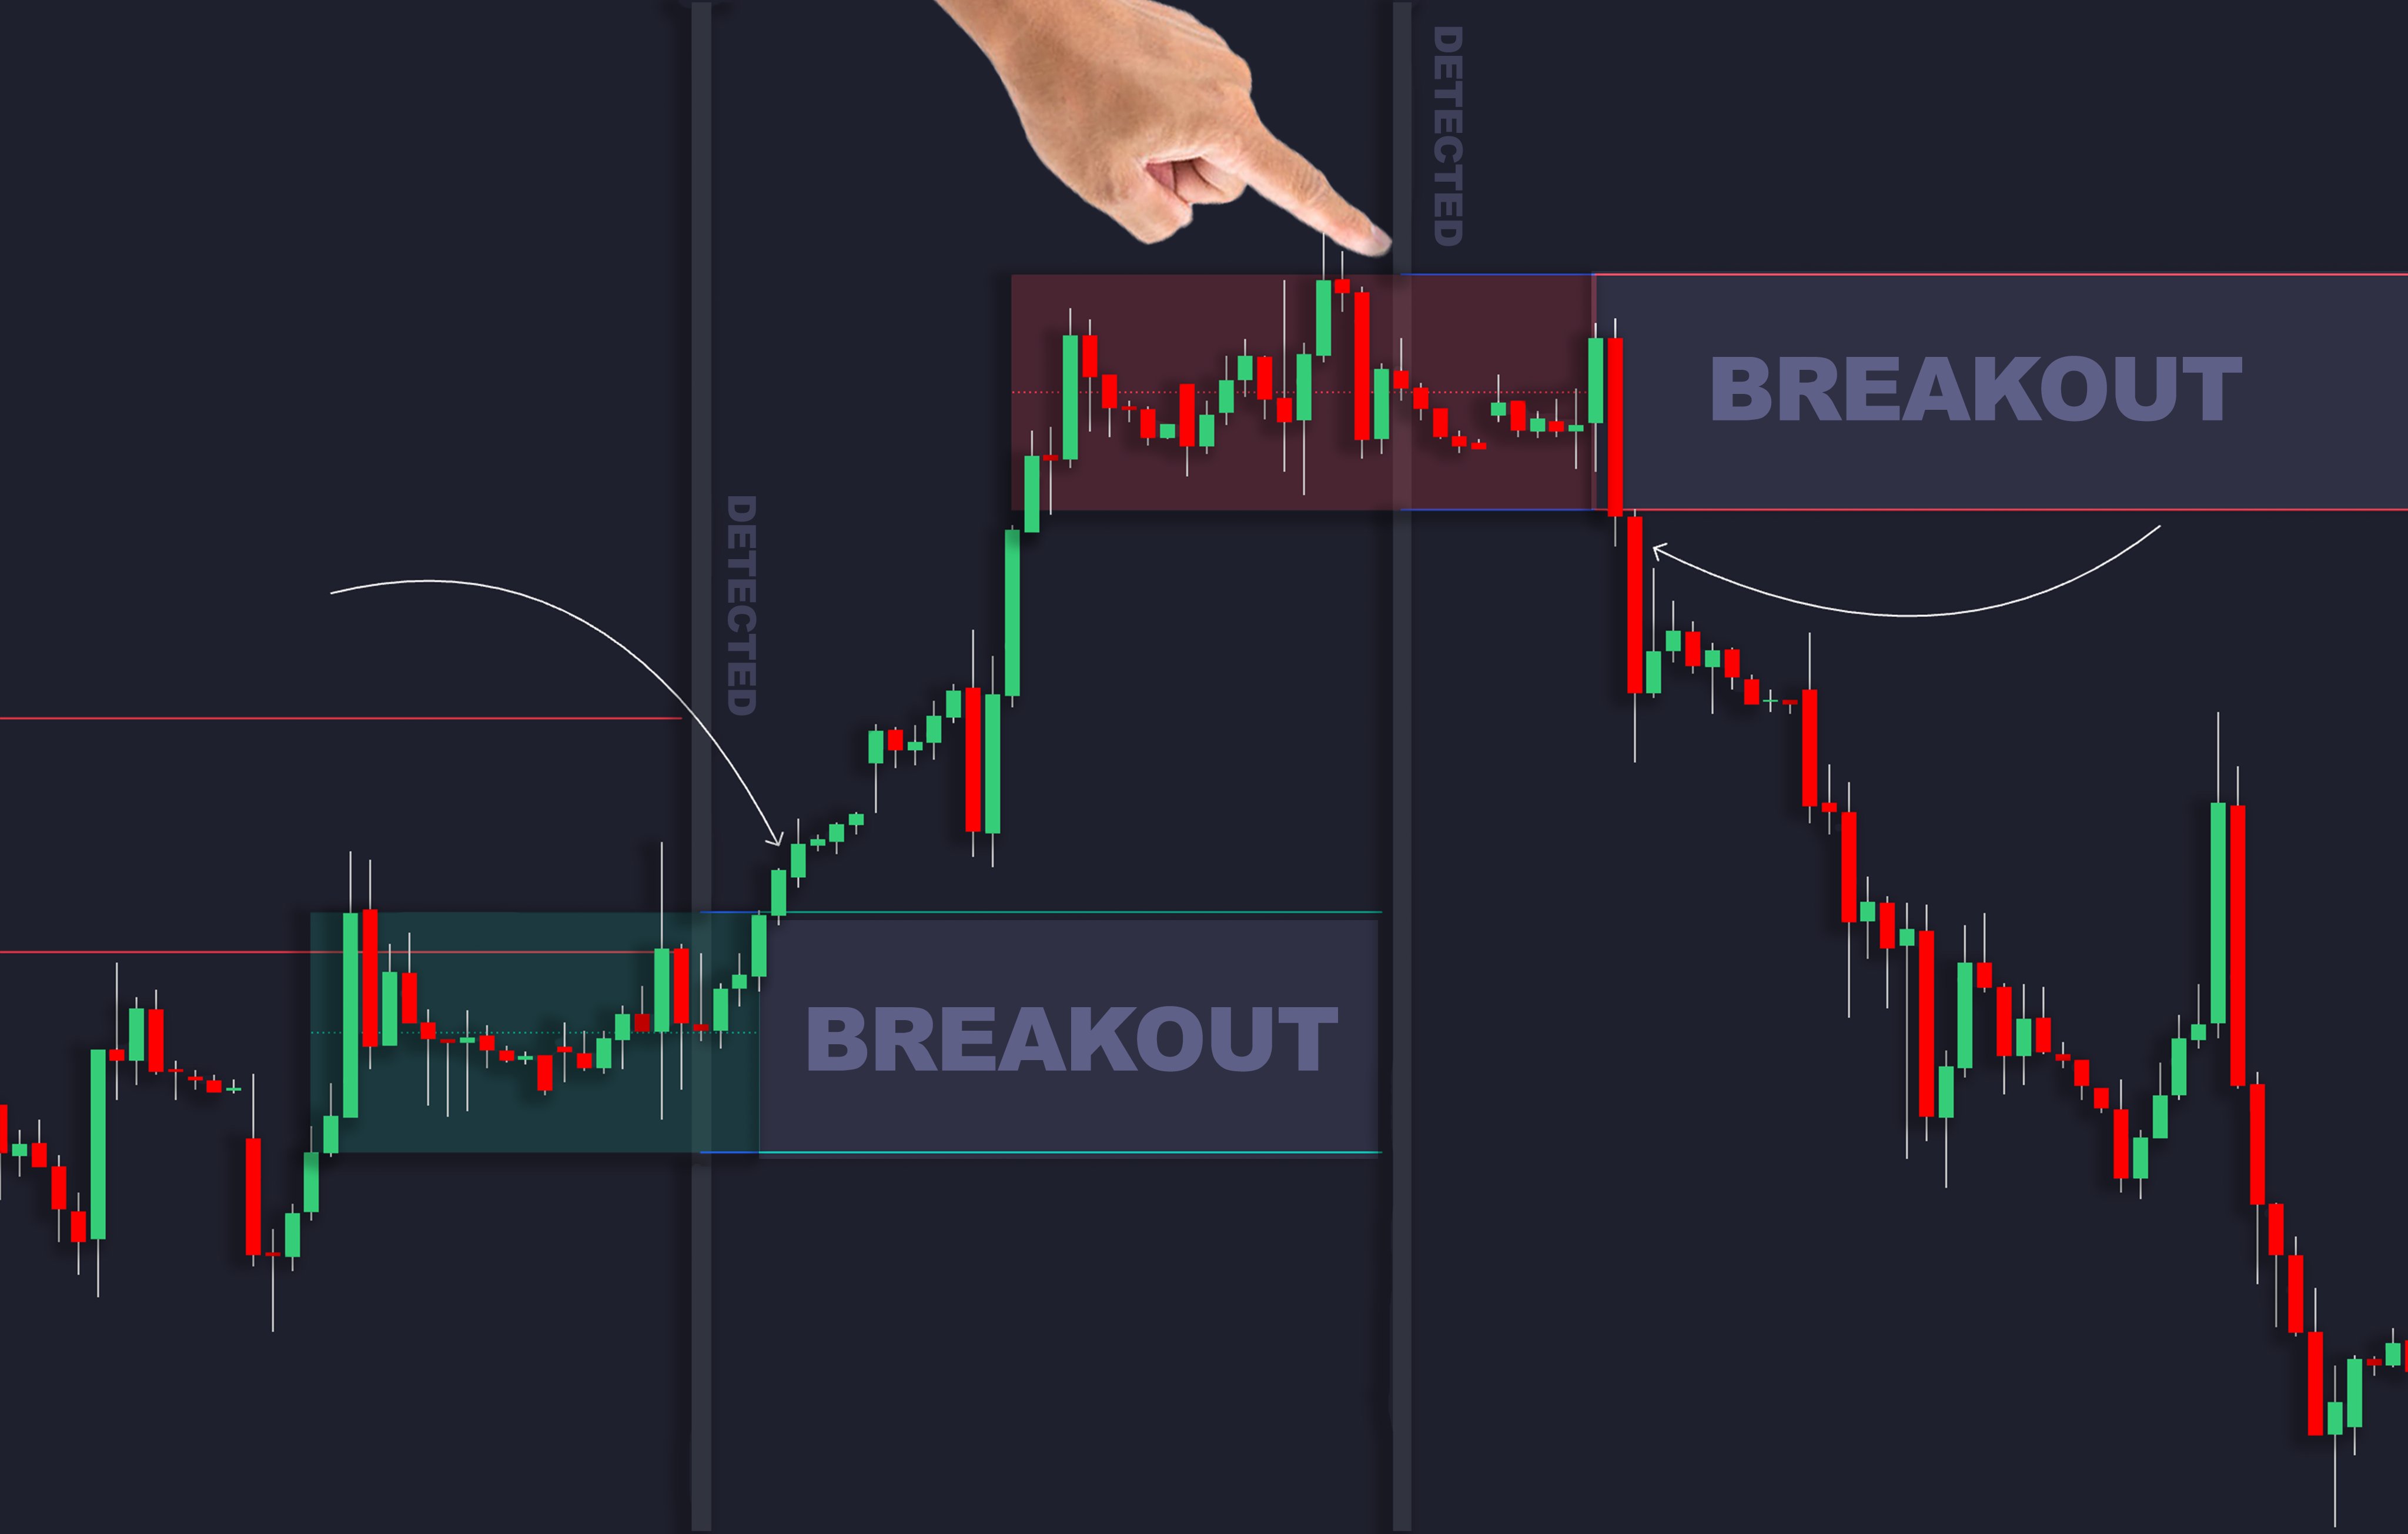
LuxAlgo’s Range Detector indicator is designed to automatically identify periods of market consolidation by distinguishing between trending and range-bound conditions. By utilizing dynamic thresholds based on volatility and historical price data, this indicator highlights potential support and resistance zones during low-volatility phases.
This clear visual representation enables traders to recognize consolidation periods, making it easier to plan entries and exits in range-bound trading setups. It’s an especially valuable feature for those who specialize in range trading, ensuring that you can capitalize on optimal market conditions.
Range Trading Methods
Trading in range-bound markets requires specific approaches to make the most of price movements between support and resistance levels. Here’s how you can effectively execute range trades.
Trading Price Bounces
The main strategy in range trading involves entering trades when the price bounces off well-defined support or resistance levels. To improve accuracy, wait for multiple confirmations before taking action.
Here’s what a solid bounce setup might include:
| Confirmation Type | Signal Requirements | Example |
|---|---|---|
| Price Action | Bullish or bearish engulfing pattern | A strong rejection candle at support |
| Technical Indicators | Oversold or overbought conditions | RSI below 30 at support or above 70 at resistance |
| Volume Profile | Spike in volume at the level | Higher volume on bounce confirmation |
When trading bounces, always place stop-loss orders just beyond the support or resistance level to account for potential volatility [4].
Spotting False Breakouts
False breakouts are common in range-bound markets and can trap unwary traders. To avoid falling for these, rely on volume and price action for confirmation. Genuine breakouts often exhibit:
- Strong momentum candles that break through the range.
- A noticeable increase in volume.
- A clean move beyond the range without an immediate pullback.
- Confirmation across multiple timeframes.
Using LuxAlgo Alerts
The exclusive Signals & Overlays available on TradingView simplify range trading by automating detection and alerting processes. To set up effective alerts, combine factors like:
- Support and resistance levels.
- Volume spikes.
- Momentum signals.
For example, you could configure an alert to trigger when the price nears a support level with rising volume and bullish momentum signals. Pair these alerts with sound risk management strategies to enhance your trading outcomes.
Risk Control for Range Trading
Managing risk is crucial when trading within a range. It helps shield against unexpected market shifts while aiming to make the most of range-bound opportunities.
Stop Loss and Target Rules
Set your stop loss 1-2× the Average True Range (ATR) beyond key swing points. For example, if you're entering at $51 in a $50-$55 range, you might place a stop at $49.50. Using ATR-based stops ensures your strategy adapts to market volatility. As the trade moves in your favor, consider shifting your stop to the breakeven point.
Position Size Calculation
Determine your position size based on a fixed percentage of your trading capital, typically 1-2% per trade. Factor in the range's width to keep your risk consistent. Narrower ranges mean smaller positions to stay within your risk limits.
Example: With a $10,000 account and a 1% risk tolerance ($100), if your stop is 50 pips, you would trade 0.2 lots. This is calculated as $100 divided by 50 pips, adjusted for your account size.
Breakout Response Plan
Keep an eye on breakouts by monitoring the same support and resistance levels that define your range. A breakout changes the market dynamics, so you'll need to reassess. Act quickly when these three signals confirm a valid breakout:
- Volume surpasses the 20-period average
- Price closes clearly beyond the range boundary
- Confirmation across multiple timeframes [6]
Range Trading Mistakes
Avoiding missteps is just as important as risk management when trading in range-bound markets. Here are some common errors that traders should steer clear of.
Early Entry Errors
Jumping into trades too soon can be a costly mistake. The National Futures Association reports that over 70% of retail forex traders lose money, and early entries are a big reason why [1]. Successful range trading depends on waiting for clear signals, not rushing in.
Make sure to look for rejection candles, align your analysis across multiple timeframes, and confirm with oversold or overbought indicators before making a move.
Ignoring News Impact
Ignoring scheduled economic events can disrupt even the most established ranges. Market structure shifts quickly during these times. According to the Bank for International Settlements, forex volatility increases by an average of 20% right after major economic announcements [2].
Keep an eye on economic calendars, adjust your exposure ahead of high-impact events, and consider widening your stop-loss levels to handle sudden price swings.
Overlooking Volatility Changes
Reduced volatility often signals an upcoming breakout. Research shows that most breakouts occur after periods of low volatility [7]. When you notice volatility dropping, it’s wise to scale down position sizes, adjust your stops, and keep an eye on multi-timeframe confirmations.
These adjustments align with the earlier strategies for handling breakouts effectively.
Conclusion
Key Takeaways
Using price action analysis and solid risk management strategies, range trading successfully combines identified support and resistance levels with disciplined execution. Examples like EUR/USD and Bitcoin highlight how these methods work in practice[1][2]. Validating setups across multiple timeframes and incorporating volume signals are crucial steps for better trade entries[2][3].
Tools and Techniques Recap
Modern trading platforms and technical indicators play a vital role in spotting and confirming range-bound opportunities. For instance, the volume-based indicators available on TradingView through LuxAlgo help to identify patterns across different markets. Their exclusive alert features assist traders in monitoring multiple ranges while ensuring confirmation rules are met.
These features complement the manual techniques discussed earlier, such as trendline validation and candlestick pattern analysis. When combined with traditional technical methods, they streamline the trading process, making it more efficient.
As emphasized in the Risk Control and Trading Methods sections, success in trading comes down to patience and sticking to your rules. The earlier examples of EUR/USD and Bitcoin demonstrate that consistent results rely on following entry criteria and leveraging technical indicators to simplify decision-making[3].
References
Read next