Swing Highs and Lows: Basics for Traders
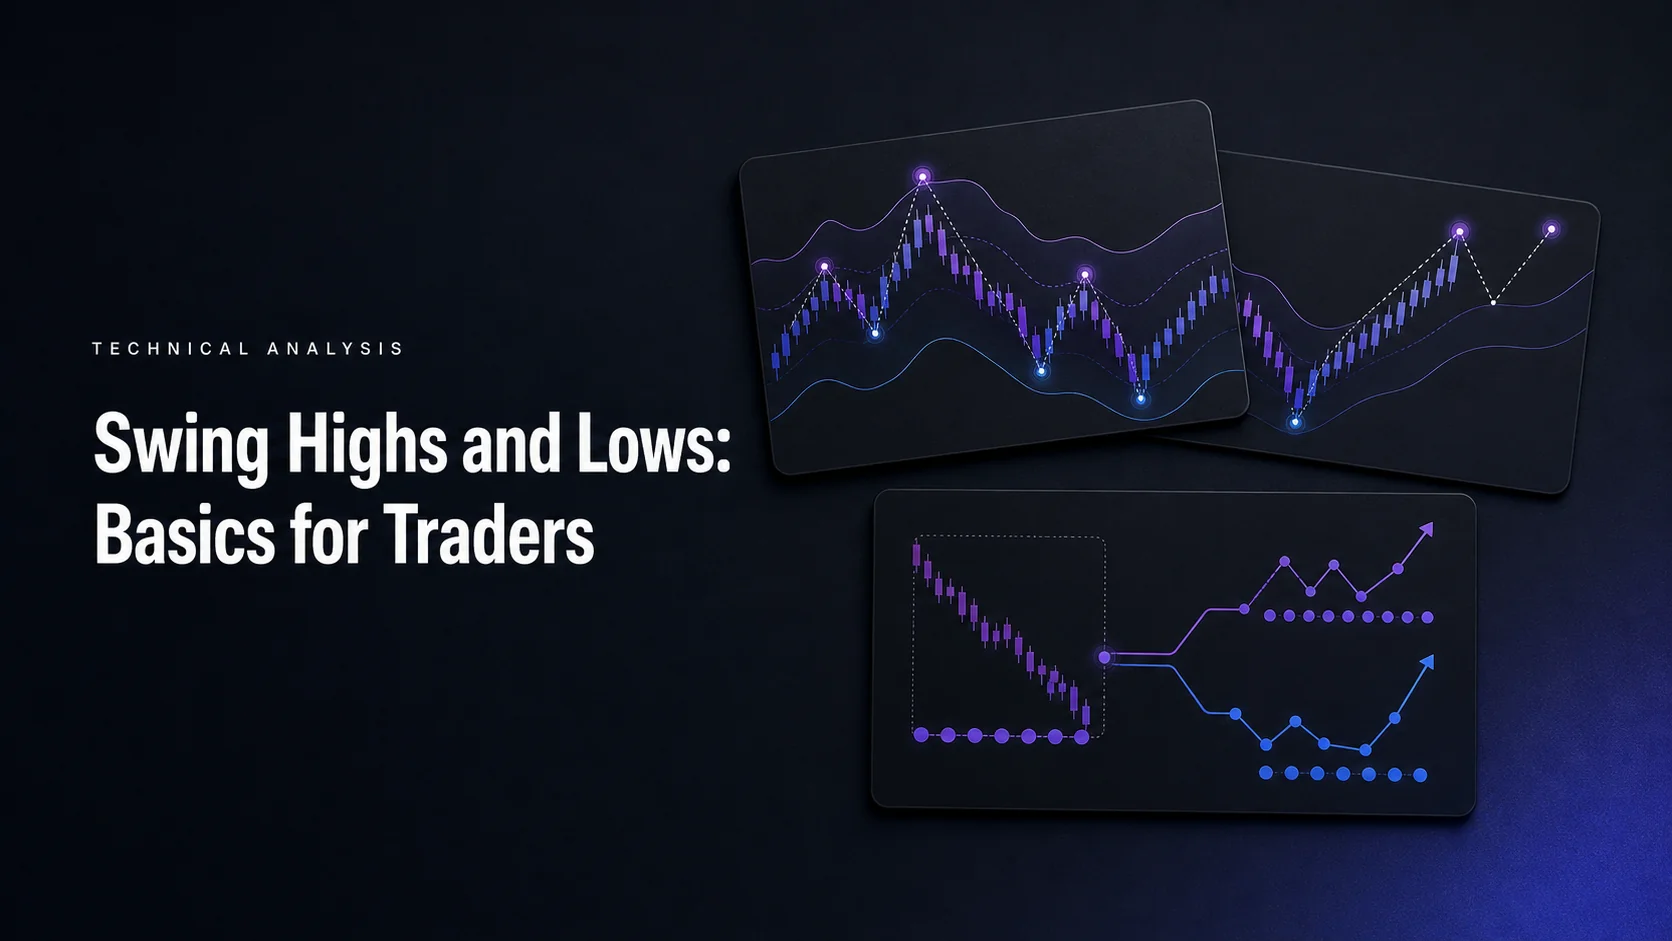
A swing high is a local price peak, and a swing low is a local trough, identified using a defined comparison with surrounding bars. Traders use these points to describe trend structure, mark possible support and resistance, and plan entries and exits. A swing is a reference point—not an automatic buy or sell signal.
The timing matters. A pivot rule that checks two bars to the right cannot confirm the candidate until those later bars have closed. A label drawn back on the turning candle does not mean the point was known then. There is also no universal requirement for exactly two bars; the chosen rule determines which moves count.
- Define: choose the price source, left/right comparison widths, and treatment of tied prices.
- Confirm: wait for the required later bars before using the pivot in a decision.
- Compare: relate highs to earlier highs and lows to earlier lows to describe structure.
- Test: evaluate explicit entry, exit, sizing, and cost rules rather than trading every marked turn.
Steps to Identify Swing Highs and Lows
How to Spot Swing Highs
Under one simple rule, a candidate high must exceed the highs of the two bars before it and the two bars after it. This is a five-bar comparison centered on the candidate. Other methods use different widths, unequal left/right widths, or a minimum price-move filter. State the method before marking the chart.
The two following highs need to be below the candidate—not necessarily lower than each other. If the candidate high is 107 and the next two highs are 105 and 106, both are still below 107. Selling at 107 based on those later observations would use information unavailable at the candidate candle.
How to Identify Swing Lows
The mirror rule requires a candidate low below the lows of the two preceding and two following bars. The later lows must be above the candidate, but do not need to rise in sequence. A trough may become a support reference after confirmation; it can still be broken later.
Decide how ties count. With strict greater-than and less-than comparisons, an equal high or low fails the test. Some indicators handle plateaus differently. Candle-body or close-based rules also produce different points from wick-based high/low rules. The Swing High/low concept guide explains the general framework.
Examples of Swing Highs and Lows
| Bar | High in peak example | Low in trough example | What is known |
|---|---|---|---|
| 1 | 100 | 97 | Left-side context |
| 2 | 103 | 95 | Left-side context |
| 3 | 107 | 90 | Candidate peak or trough only |
| 4 | 105 | 94 | First right-side bar has closed |
| 5 | 106 | 92 | Two-bar right-side requirement is satisfied |
These are two separate hypothetical sequences. In the high sequence, bar 3 exceeds the other four highs. In the low sequence, bar 3 is below the other four lows. Both pivots become confirmed only at the close of bar 5 under this rule. An executable trade then depends on a separately defined order and fill assumption.
A different structure-based approach may designate a pullback low only after price breaks a prior high. That is not identical to the local five-bar test. Use one definition consistently rather than switching between methods when the historical result looks better.
Common Mistakes to Avoid
- Using a label’s plotted position as its signal time. Record the confirmation bar separately.
- Treating two later bars as a universal rule rather than one chosen setting.
- Comparing every minor fluctuation with a major swing from a different scale.
- Assuming a new local high or low guarantees a reversal.
- Changing tie handling, price source, or swing size after seeing the outcome.
Using Swing Highs and Lows in Trading
Using Swing Points to Analyze Trends
Compare each confirmed high with the previous comparable high, and each low with the previous comparable low. A sequence of higher highs and higher lows describes upward structure; lower highs and lower lows describe downward structure. Mixed sequences often require more context than a simple bullish or bearish label.
For example, confirmed lows at 50 and 53, with highs at 55 and 58, describe rising structure when they occur in the appropriate alternating order. The move from 50 to 55 alone is not enough to establish that sequence. A break below 53 challenges the latest higher low, but does not guarantee a sustained downtrend.
Define whether a wick through a level or a completed close beyond it counts as a break. A failed break can reverse back through the reference; see the bull and bear trap guide for that distinction. Structure describes observed behavior and supplies a testable hypothesis about what may follow.
Planning Trade Entries and Exits
| Trade decision | Possible use of swings | What still needs a rule |
|---|---|---|
| Entry | A confirmed pullback low or a break above an earlier high | Timing, order type, and actual fill price |
| Stop | Beyond a relevant low for a long or high for a short | Buffer, volatility, gaps, and maximum acceptable loss |
| Target | A prior opposing swing or another stated objective | Whether enough reward remains from the actual entry |
| Position size | Use the entry-to-stop distance | Costs, contract value, minimum size, and correlated exposure |
Suppose a hypothetical long entry after confirmation is 54, a protective stop is 52.50, and a previous high provides a target at 58. Price risk is 1.50 per share, while the potential reward is 4. With a total planned loss budget of 100 and estimated round-trip costs of 10, the example size is (100 − 10) ÷ 1.50 = 60 shares. At the assumed stop fill the loss is 90 + 10 = 100; at the target the net gain is 240 − 10 = 230, giving net reward-to-risk of 2.3:1.
Those results depend on execution. A stop executed at 52 after a price gap would instead lose 120 + 10 = 130. A stop trigger does not guarantee a fill at that price, and a stop-limit order can remain unfilled. Check order types and the instrument’s contract size before applying a share-based example to another market.
Placing a stop beyond a swing is one approach to test, not protection against every loss. A wider volatility buffer generally needs a smaller position for the same loss budget. Do not increase size merely because several chart signals appear to agree.
Combining Swings with Indicators
Use an indicator to answer a specific question. A moving average can describe smoothed trend context; RSI can describe recent momentum; Stochastic locates the close within a recent high-low range. None confirms that a pivot must hold or that the next move will reverse.
An RSI reading above 70 or below 30 is not an automatic entry or exit. A Stochastic crossover near a swing can generate repeated signals while price continues trending. Write the exact period, threshold, and timing, then compare the pattern-only baseline with the additional condition. The trading indicators FAQ explains their different roles.
Volume can add context, but high activity is not required for every meaningful swing and does not guarantee a turning point. Compare completed bars with an appropriate baseline and account for the venue and feed. Additional filters can reduce both losing trades and useful opportunities.
Advanced Tools and Techniques for Swing Analysis
Analyzing Swings Across Time Frames
A daily swing and a five-minute swing describe different scales; one is not automatically a more reliable entry signal. Choose time frames based on the question and intended holding period. More views can add context, but also create conflicting information and more opportunities to select evidence after the fact.
| View | Example question | Timing constraint |
|---|---|---|
| Daily or weekly | What is the broader sequence of highs and lows? | A higher-time-frame pivot may require several later days or weeks |
| Hourly or four-hour | Where is the current pullback relative to that structure? | Use only completed bars required by the selected rule |
| Five- or fifteen-minute | Does the chosen execution trigger occur? | Costs and intrabar movement can materially affect the result |
If a daily pivot requires two later daily bars, an intraday strategy cannot know that confirmed pivot earlier on the second day. Use the information available at the decision time, including session boundaries. Test the extra time-frame condition rather than assuming alignment improves results.
Using Native LuxAlgo Features for Swing Analysis
Open a supported symbol in LuxAlgo charts and use drawing tools to mark candidate and confirmed points. Keep the same comparison rule while moving through historical bars. A multi-chart workspace can show broader context alongside the time frame used for decisions.
The Library’s Swing Highs/Lows & Candle Patterns indicator labels confirmed swings as HH, HL, LH, or LL and identifies supported candle patterns at those points. Its Length setting controls sensitivity. The documentation explicitly notes that components are placed retrospectively on the relevant candles: historical labels are not evidence that the signal was available there in real time.
Use the Library’s native chart option to inspect the implementation, or locate relevant tools through the indicator browser. Review settings and signal timing before using a marked pattern as a strategy condition. Recognizing a hammer or engulfing candle at a pivot does not establish a profitable entry by itself.
Previous-session highs and lows are different from local pivots: the former summarize a chosen period, while the latter compare neighboring bars.
Testing and Refining Strategies
Quant, our coding agent, can help translate a swing-based idea into a native strategy script. Specify the left/right comparison widths, price source, tie handling, any minimum-move filter, signal timing, order execution, exits, sizing, and costs. Inspect the generated code and run it manually on the intended chart.
A useful first test asks whether every entry occurs after its required pivot becomes known. Check individual examples in the strategy viewer and Trades Log. A script may plot a marker on an earlier candle for readability while correctly waiting to trade; the plotted offset and the executable signal time must be assessed separately.
Use standard candle prices and realistic commission and slippage. Keep the rules unchanged while evaluating a later period that was not used to choose them. Compare nearby settings, record the number of trades and drawdown, and inspect losing examples. Repeatedly adjusting Length until one historical chart looks ideal can fit noise instead of a repeatable behavior.
Steps to Get Started
- Choose one market, time frame, and written pivot rule.
- Mark the candidate candle and the later confirmation candle separately.
- Label confirmed highs against previous highs and lows against previous lows.
- Define one entry and exit method, then calculate position size and costs.
- Review the historical results and practice the same rules in a suitable simulation before considering live exposure.
Swing analysis turns price movement into a consistent set of references. Its value comes from clear definitions and honest timing, not from knowing the exact top or bottom in advance. Keep the distinction between a confirmed point, a trade trigger, and an achievable fill throughout the process.
FAQs
What is an example of a swing high and low?
With a two-bars-left and two-bars-right rule, highs of 100, 103, 107, 105, and 106 identify the third bar as a swing high after the fifth bar closes. A separate low sequence of 97, 95, 90, 94, and 92 identifies the third bar as a swing low at the same confirmation stage.
Are two candles always needed to confirm a swing?
No. Two bars on each side is one possible definition. Different comparison widths, tie rules, and move filters produce different pivots and delays. State the method before evaluating a signal.
How do swings help identify trends?
Compare confirmed highs with earlier highs and confirmed lows with earlier lows at the same scale. Higher highs and higher lows describe upward structure; lower highs and lower lows describe downward structure. A break challenges the prior structure but does not guarantee a lasting reversal.
What tools can help analyze swing points?
Native LuxAlgo drawings and Library indicators can help map points and labels. Quant can help code explicit rules for inspection and manual testing. Retrospective labels must not be treated as signals available on their plotted candle.
What is a common swing-trading backtest mistake?
Entering at the pivot candle using later bars that were needed to confirm it introduces future information. Check the signal’s actual availability and the order-fill assumption, and evaluate costs and a separate test period.
How can I practice identifying swings?
Choose one rule and move through historical bars without looking ahead. Record when each candidate becomes confirmed, compare it with prior swings, and review both successful and failed trade ideas under unchanged rules.
Read next