Ultimate Guide to Risk Management in Trend Reversals

A possible trend reversal is a trading hypothesis, not a confirmed opportunity. Price can recover briefly and resume its prior trend. Risk management starts by defining what would justify an entry, what would invalidate it, and how much money the position would put at risk.
LuxAlgo’s native charts and Quant support that process: describe a reversal rule, review the generated code, and test its historical trades. Use the results to evaluate the rule’s assumptions rather than treating an indicator or AI output as proof that a turning point will hold.
What You Need to Know About Trend Reversals
Defining Trend Reversals
A reversal is a change in the prevailing trend on a specified timeframe. A short-term rally can coexist with a longer-term downtrend, so define the horizon before classifying a move. A pullback temporarily moves against a trend; distinguishing it from a developing reversal is uncertain in real time.
One rule might require a completed close beyond a prior swing and a subsequent retest. Another might use a moving-average crossover. Those are different definitions with different timing. If a swing requires later bars to confirm it, a backtest must not act as if that confirmation was available earlier.
Causes and Context
Economic announcements, changing expectations, and shifts in supply and demand can accompany a reversal. An overbought RSI or a moving-average crossover describes price behavior; it does not itself cause the market to reverse. An apparent three-stage sequence of warning, confirmation, and establishment is a useful organizing idea, not a required market pattern.
Challenges in Spotting Reversals
Common problems include confusing a bounce with a trend change, relying on hindsight-defined pivots, and entering before the chosen signal is complete. Waiting for confirmation can reduce some early entries but may worsen the entry-to-stop distance. Evaluate that tradeoff with the complete strategy.
Tools and Indicators for Spotting Trend Reversals
| Tool | What it describes | Limit to consider |
|---|---|---|
| Moving averages | Smoothed price and changes in relative average levels | Crossovers respond to past prices and may occur after a substantial move |
| RSI | Momentum on a bounded 0–100 scale | Readings beyond conventional 70/30 levels do not guarantee a reversal |
| MACD | Relationships between moving averages and a signal line | Crossovers or divergence can occur without a sustained trend change |
| Price structure | Observed swings, breaks, and retests | Specify confirmation timing and avoid hindsight labels |
A 50-day/200-day crossover is one long-horizon reference, not a universal early reversal detector. The timeframe and moving-average type are part of the rule. RSI can remain elevated or depressed during a strong trend; divergence is a condition to investigate rather than a promise of an imminent turn.
Combining Indicators
RSI and MACD both transform price information. Agreement between them is not necessarily independent evidence. Give each filter a defined purpose and compare the strategy with and without it. Additional filters can reduce trade count and increase the chance of selecting a combination that only fits the historical sample.
Multiple timeframes can provide context, but higher-timeframe values must be handled according to when they become known. A completed daily signal cannot be used to justify an earlier intraday fill.
LuxAlgo’s Native Chart Workflow
Use LuxAlgo’s native charts to inspect the intended market, draw reference levels, and compare relevant intervals. Library indicators can help express a concept; they do not remove the need to define and validate an entry rule.
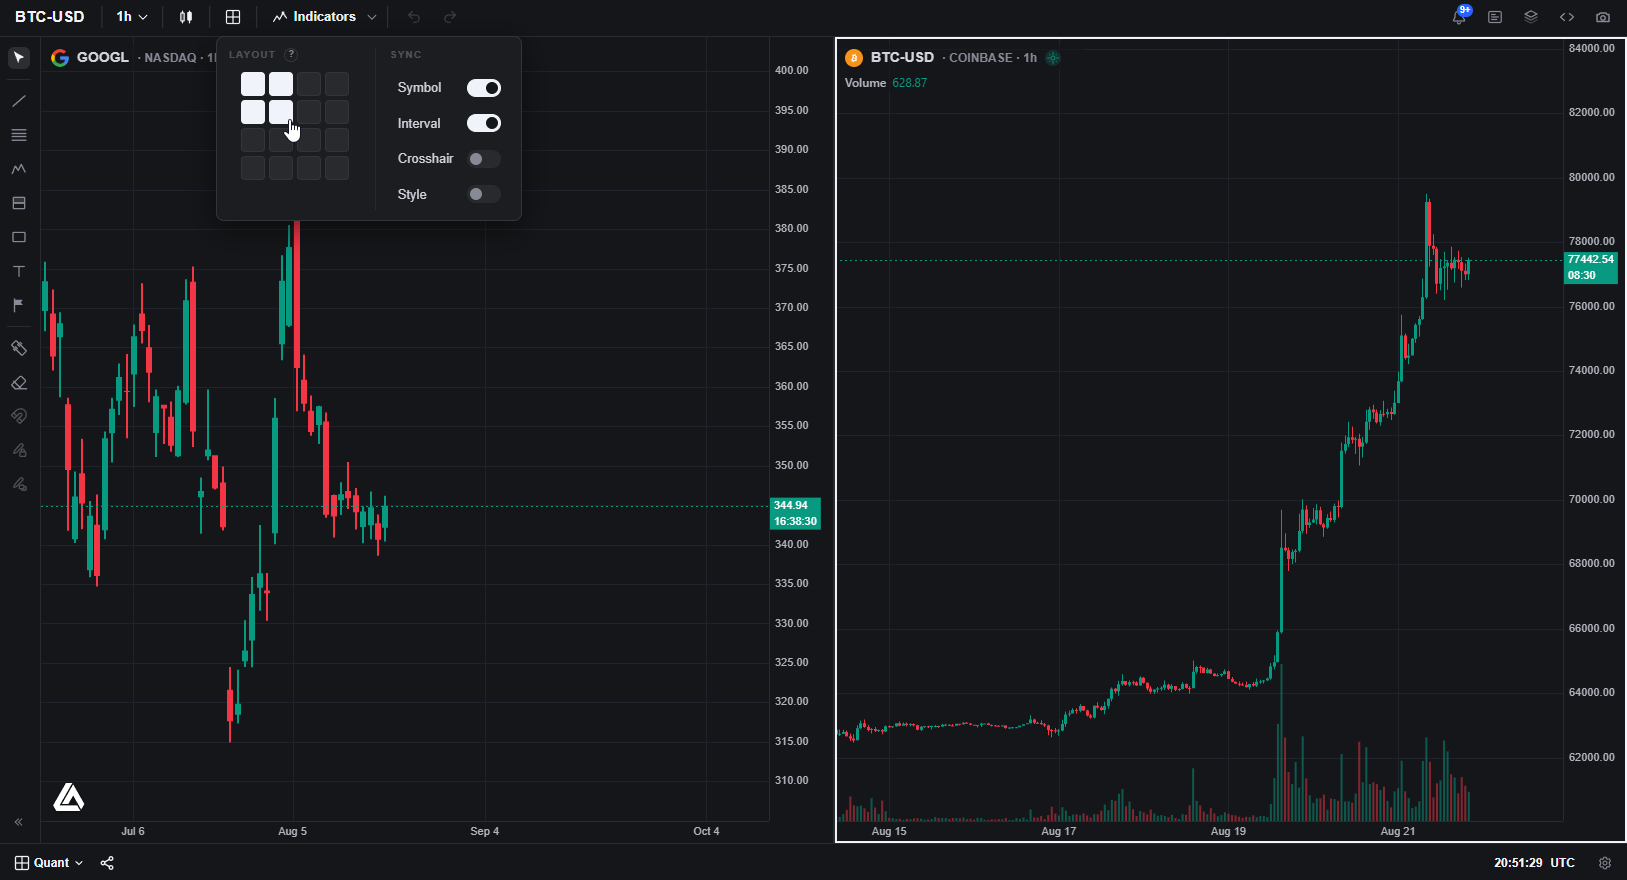
Orderflow tools can add participation context on supported data. Delta and volume profiles are measurements, not proof that a reversal is confirmed. Data availability and the instrument’s feed matter when comparing signals.
RSI Video
This TradingView tutorial explains RSI and its settings. Use it for indicator education; the trading rule still needs its own risk controls and testing.
Strategies for Managing Risk in Trend Reversal Trading
Using Stop-Loss Orders Effectively
Choose a level that expresses invalidation of the trade idea. A stop just beyond support or resistance is one possibility, but a fixed 1–2% buffer is not suitable for every instrument or timeframe. Account for the expected noise and size the position to the resulting distance.
An eight-period EMA can be part of an exit rule, such as closing after a completed close below it. That differs from a broker stop triggered intrabar. The average itself can move both ways, so it is not automatically a trail that only tightens.
A stop price is not a guaranteed fill price. A stop-limit order adds a price restriction but can remain unfilled. Review the distinction between indicators and stop orders before translating a chart rule into execution.
Calculating Position Size and Risk-Reward Ratios
Position quantity = planned monetary risk ÷ monetary stop distance per unit. Account-risk percentage is different from the percentage of capital committed to the position. Check costs, permitted quantity increments, capital or margin requirements, and overlapping positions.
For example, a hypothetical $10,000 account with a $100 risk allowance, $50 entry, and $48 stop supports 50 shares before costs. The position value is $2,500, while the planned price risk is $100. If the entry changes to $51 with the same stop, the $3 distance supports only 33 whole shares before costs.
With a $56 target, the original $50 entry offers 1:3 planned risk-to-reward. The later $51 entry offers 1:1.67, approximately. Neither ratio ensures profitability: the realized win rate, average wins and losses, and costs determine sample expectancy. See risk-reward versus win rate.
There is no universal portfolio risk limit or fixed 25–50% quantity reduction that fits every volatility change. Recalculate the money at risk and assess whether several positions could lose together.
Avoiding Emotional Trading
Write the entry, invalidation, and adjustment rules before trading. Record deviations separately. An alert can remind you that a condition occurred, but it does not prevent impulsive decisions or guarantee execution. Review both profitable and losing trades for adherence to the same rules.
Testing and Reviewing with LuxAlgo
Using Quant
Describe the complete reversal strategy to Quant, including entry timing, stop logic, sizing, and other exits. Review Code and then Run it. Inspect the Trades Log to check that the simulation implements the intended sequence.
Use Inputs and Properties to adjust exposed parameters and simulation assumptions, including commission and slippage. Review trade count, net profit, and drawdown together. Use standard price charts for fill analysis and reserve unseen data for validation. A backtest measures simulated historical behavior, not live performance.
Using LuxAlgo with TradingView
LuxAlgo also publishes toolkits for TradingView. Keep that workflow distinct from native charting and Quant. When moving a script between environments, validate the supported features, data, and resulting trades; do not assume every script behaves identically. An indicator alert and a broker order remain separate actions.
Automation and AI in Trading
AI can help express and revise a rule, while automation can apply explicitly configured conditions. Neither establishes an edge, guarantees early detection, or removes operational failure. Review the code and execution process, including what happens when data, connectivity, or orders fail.
Examples: Applying Risk Management in Trend Reversals
The following are hypothetical examples, not documented case studies.
- A planned loss: A long entry at $50 with 50 shares and a $48 stop has $100 of planned price risk. A fill at $47.80 produces a $110 loss before costs. The rule can be followed and still lose more than the stop-distance estimate.
- A target exit: The same position sold at $56 produces $300 before costs. This single modeled outcome does not validate the reversal signal.
- A sizing error: Doubling quantity to 100 shares doubles monetary exposure at the same stop. It does not move the price level that triggers that stop, though leverage can create separate margin constraints.
Use these distinctions when reviewing failed reversals: signal quality, sizing, and execution are related but different questions. A profitable trade can still involve poor risk control, while a controlled loss does not by itself invalidate a strategy.
Reviewing Your Trades
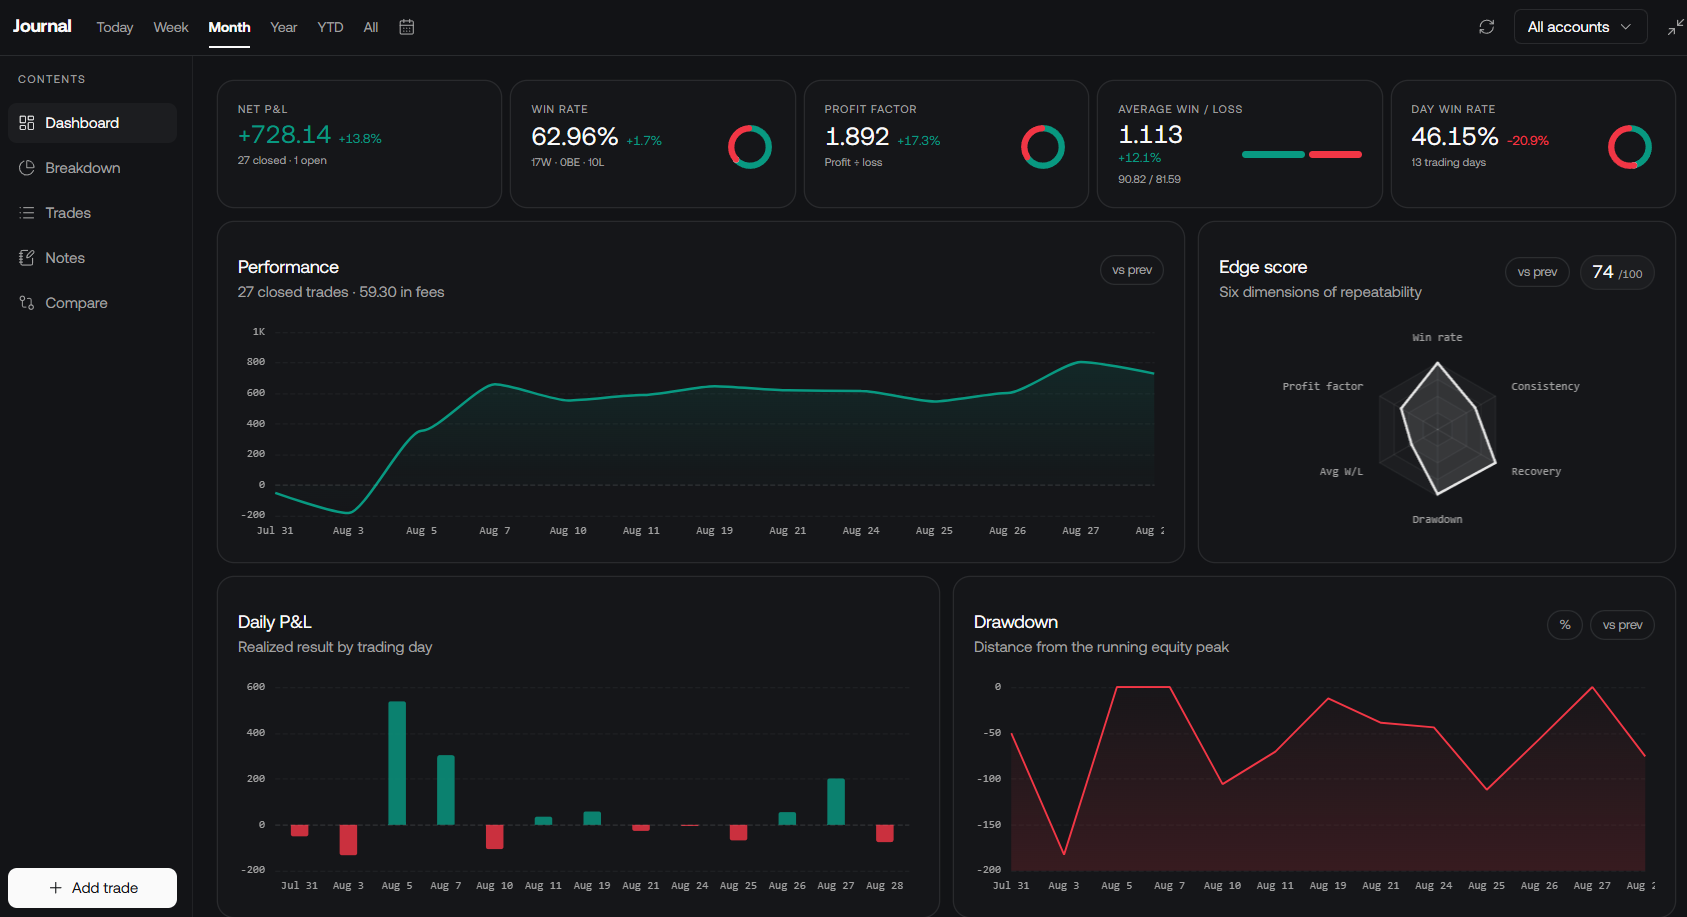
Use LuxAlgo Journal to review trading records and notes. Record initial monetary risk, actual fills, costs, the signal used, and any discretionary changes. Look for repeatable patterns across a meaningful sample rather than relying on a memorable win or loss.
A Repeatable Reversal Risk Process
Define the timeframe and signal, identify invalidation, calculate quantity, and evaluate the complete rule. Check execution assumptions and combined exposure, then review results against the plan. Native charts, Quant, and Journal support different parts of that process; none replaces the need to assess uncertainty.
FAQs
What is the 1% rule in trading?
The 1% rule is a guideline for limiting planned risk on one trade to 1% of account equity. It refers to risk, not position value, and is not a guaranteed maximum loss or a suitable allowance for everyone.
| Account equity | Hypothetical 1% allowance | Stop distance per share | Quantity before costs |
|---|---|---|---|
| $10,000 | $100 | $0.50 | 200 shares |
| $50,000 | $500 | $0.50 | 1,000 shares |
| $100,000 | $1,000 | $0.50 | 2,000 shares |
Costs and execution uncertainty can require smaller quantities. Also check whether the position’s purchase price or margin requirement fits available capital, and whether other positions create overlapping risk.
Read next