Volume Analysis for Breakout Trading: Basics
Volume analysis helps you judge the activity accompanying a breakout, but it cannot certify that the move will succeed. Start with the data source, compare equivalent periods, and define the price level before the signal. Then test whether the volume condition improves your entry and exit rules.
LuxAlgo’s native charts let you examine market structure across timeframes, while Quant helps turn a specific breakout idea into a strategy for review and testing. Indicators remain useful supporting tools; neither an indicator nor an AI-generated strategy eliminates false breakouts.
Volume Analysis Basics
Know What Your Volume Data Measures
Volume usually measures traded quantity during a bar. Some feeds instead provide tick activity. A green volume bar commonly uses a price-direction rule for its color; it does not mean all those trades were purchases by aggressive buyers. Check the platform’s definition before interpreting colors as buying and selling pressure.
| Market | Common measurement | Check before comparing |
|---|---|---|
| Stocks | Shares traded | Venue-only versus consolidated coverage, regular versus extended sessions, and corporate-action adjustments |
| Futures | Contracts traded | Contract month, exchange session, and rollover effects |
| Spot forex | Often tick volume from the provider | It is not a consolidated total of global currency trading |
| Crypto | Base-asset quantity, quote turnover, or contract volume | Venue, units, and spot versus derivatives instrument |
Do not rank data quality from the asset label alone. A well-defined exchange series can still cover only part of a market. Missing volume should not be treated as proof of weak participation. LuxAlgo’s market-data documentation explains how available chart and footprint data differ.
Compare Relative Activity, Not Just Raw Numbers
Relative volume divides the current quantity by an explicitly defined comparison average. For daily analysis, one candidate is the preceding 30 completed daily bars, excluding the signal day. A 90-day baseline will respond differently to recent changes; neither lookback is universally best.
Intraday, compare similar points in prior sessions rather than an opening bar with quiet midday activity. Keep regular bar volume separate from cumulative session volume. An unfinished candle has not accumulated its final volume, so a close-based signal must wait for the information it requires. See TradingView’s time-matched volume calculation for an example.
Where the Approach Comes From
Volume has a long role in technical analysis. Dow Theory uses it to support trend analysis, while Wyckoff analysis relates price movement and activity to supply-and-demand interpretations. These frameworks provide context, not a universal numerical success rate for modern breakout trades.
Read Volume Through the Breakout Sequence
Mark the consolidation high and low before price leaves the range. Rising activity while price moves sideways can reflect competing participation; by itself, it does not prove accumulation before an upside move or distribution before a decline.
| Stage | What to observe | What not to assume |
|---|---|---|
| Consolidation | Range boundaries, volatility, and activity relative to the chosen baseline | Increasing volume always means accumulation |
| Initial breakout | Whether price trades or closes beyond the specified level and what volume was then available | A spike guarantees continuation |
| Retest or follow-through | Whether the level holds under your rule and whether activity changes | Later evidence was knowable at the initial entry |
| Failure | A return inside the range or another predefined invalidation condition | Only low-volume breakouts can fail |
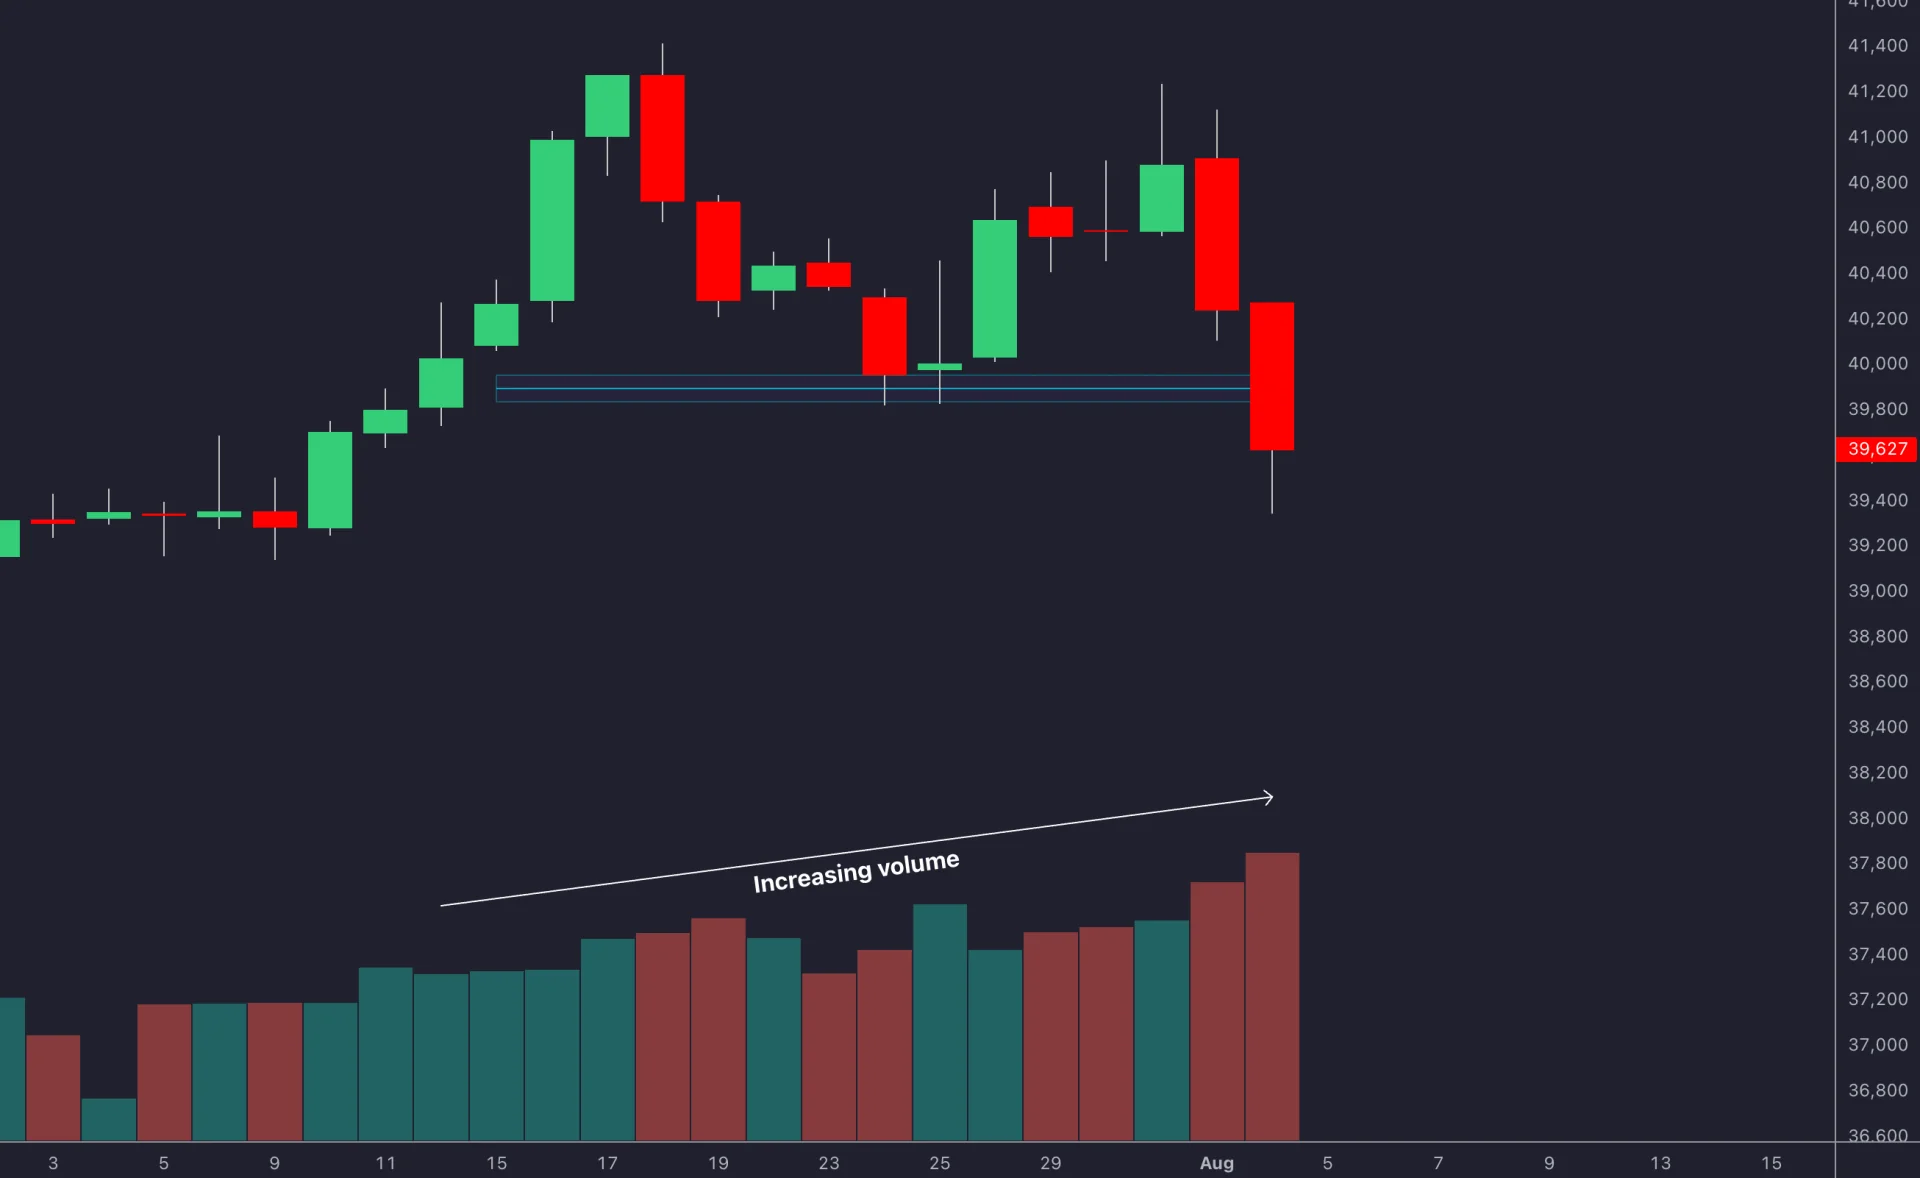
A Transparent Example
Suppose a hypothetical stock has resistance at $250 and average daily volume of 1 million shares over the prior 30 sessions. A completed day closes at $252 with 1.5 million shares traded. That is 1.5 times average, or a 50% increase. A 150% increase would instead require 2.5 million shares.
The volume condition qualifies only if it matches a rule chosen beforehand. It does not predict a 30% rally. If entry is on the next bar, model that fill and any gap rather than assuming the $252 close was available after the final daily volume became known.
For an illustrative $252 entry and $247 planned stop, the price risk is $5 per share. A $500 risk budget with $0.25 per share allowed for estimated costs and adverse execution permits floor($500 ÷ $5.25) = 95 shares, or $498.75 planned risk. Actual loss can be larger if execution is worse than assumed. A $262 target represents 2:1 reward to price risk before costs, not a guarantee of positive expectancy.
Use Multiple Timeframes Without Counting the Same Evidence Twice
A daily chart can define the broader range, an hourly chart can specify a setup, and a 15-minute chart can refine execution. These are examples of distinct jobs, not a requirement to use exactly three timeframes.
Lower-timeframe volume is part of the higher-timeframe total, so agreement is not independent confirmation. An hourly breakout early in the day cannot use the final daily volume as a live entry filter. Likewise, “daily trend” rules should state whether they use the last completed daily bar or a changing current value.
Use LuxAlgo’s native chart workspace to compare the views, then ask Quant to implement those timing choices explicitly. More timeframes can add complexity without improving results; compare the combined rule with a simpler baseline instead of assuming a fixed accuracy improvement.
Choose the Right Volume Tool
VWAP and On-Balance Volume
Native VWAP weights a selected candle price source by volume over a Day, Week, or Month window that resets in UTC. It is a contextual reference, not intrinsic value. Check the anchor rather than assuming it matches a local exchange session.
OBV adds a bar’s volume when the close rises from the previous close, subtracts it when the close falls, and is unchanged on an equal close. It describes cumulative signed activity under that rule, not actual institutional transactions. Divergence can prompt closer review but does not time a reversal.
Video: Volume Analysis in Practice
This existing Humbled Trader tutorial provides additional volume-analysis examples. Treat the demonstrations as educational material, not evidence of a guaranteed outcome or a description of LuxAlgo’s native platform.
Common Volume Analysis Errors
- Comparing unlike series. A million shares of one stock is not equivalent to a million shares of another. Start with each instrument’s own history, then use carefully defined cross-market comparisons if needed.
- Labelling activity as conviction. High turnover can accompany disagreement, forced liquidation, or reversal. It does not reveal participant identity.
- Ignoring events. Earnings, economic releases, Federal Reserve announcements, options expiration, and index rebalancing can change volume patterns. Tag these cases and test an explicit event policy.
- Choosing thresholds after seeing winners. Include failed signals and reserve a separate period for validation.
- Treating stops as guaranteed fills. A stop can execute beyond its trigger; a stop-limit can remain unfilled. Account for these mechanics before sizing a trade.
For event-driven moves, comparing similar historical events may provide context, but a small sample is not proof of an edge. Read the SEC’s stop-order guidance and the high-volatility volume guide for practical risk considerations.
Turn the Analysis into a Testable Strategy
Give Quant a specification that defines the range using prior bars, the completed-bar or intrabar trigger, the volume baseline, any higher-timeframe filter, and the exit and sizing rules. Review the generated logic, then use native strategy properties and results to inspect fills, commission, slippage, drawdown, and net performance.
Compare the price-only breakout with the same strategy plus volume. Then check later data and nearby parameter choices. A completed backtest does not validate every breakout or guarantee broker execution.
What Is the Indicator for a Fake Breakout?
There is no single indicator that reliably identifies every false breakout in advance. A return inside the original range, failure to meet the chosen close or retest rule, and changing relative volume can all be relevant. Define failure and the exit before entry, then test whether the volume filter adds value. Low activity alone does not prove failure, and high activity does not prevent it.
References and Further Reading
Read next