All indicators

Supertrend Parameter Sensitivity 3D

By LuxAlgoJun 8, 2026

Static chart image
SignalsTrailing-Stop

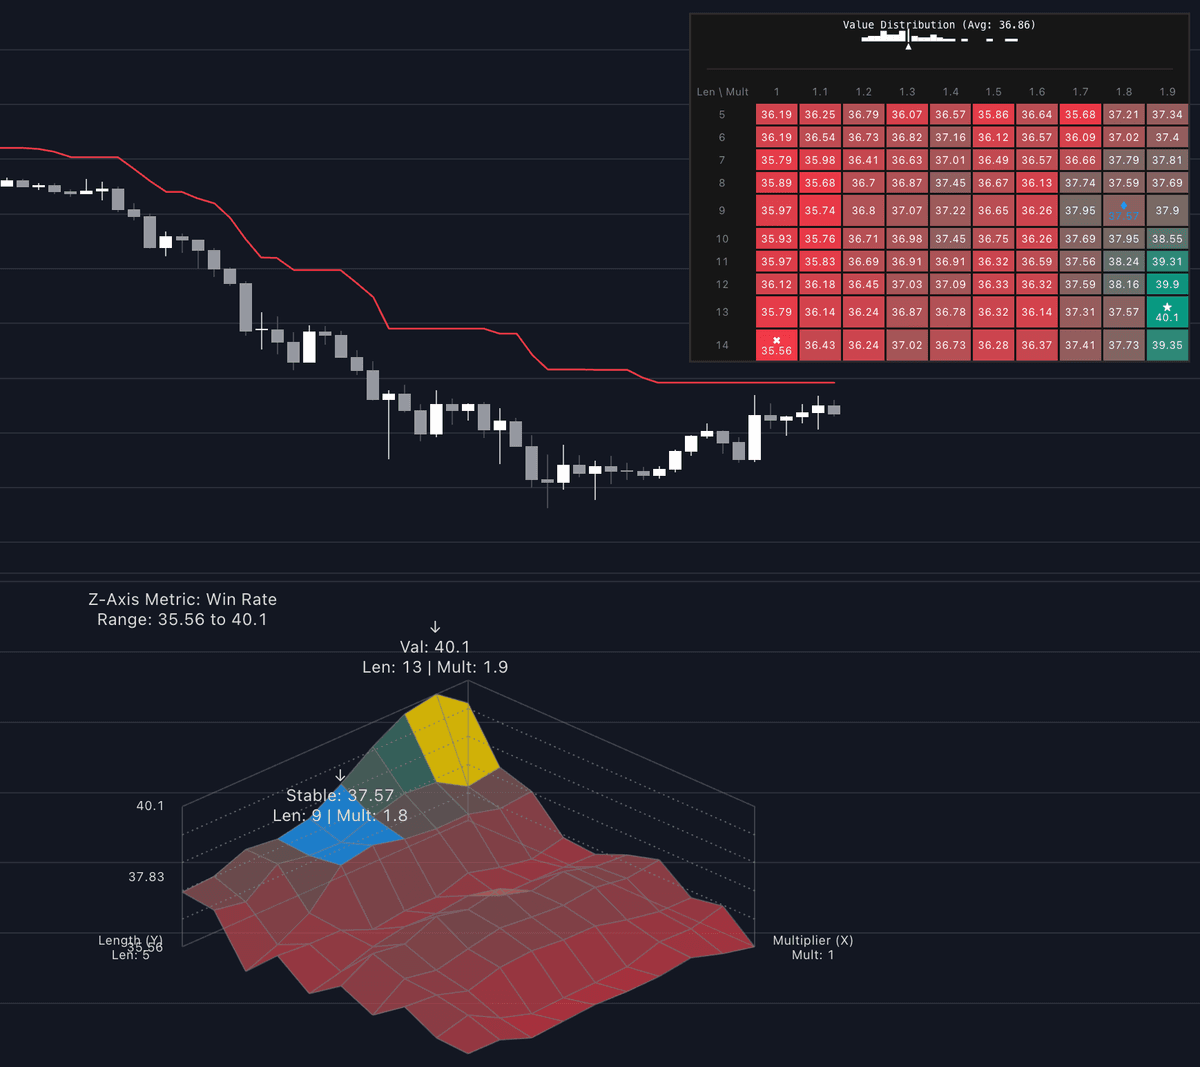
The Supertrend Parameter Sensitivity 3D indicator provides a comprehensive visual analysis of Supertrend performance across a wide range of ATR length and multiplier settings to help traders identify the most robust parameter combinations for their trading strategy.

Usage

The Supertrend Parameter Sensitivity 3D tool is designed to move beyond single-setting testing by visualizing 100 simultaneous parameter combinations. By defining a range of ATR lengths and multipliers, traders can observe how different settings impact their chosen performance metric on a 3D surface map.

3D Surface Analysis

The primary visualization renders a 3D grid where the X and Y axes represent your selected parameter ranges, and the Z axis represents the chosen performance metric. High points on the map indicate superior performance, while low points highlight suboptimal settings. Users can toggle the Auto Apply Stable Parameters setting to allow the indicator to dynamically update the Supertrend lines on their chart to the most stable and reliable settings found within the current matrix.

Dashboard Interpretation

The integrated dashboard provides a granular breakdown of your parameter matrix. It includes a distribution chart and a heatmap table that displays the calculated performance metric for every coordinate. The table identifies the best, worst, and most stable performing areas with specific markers, allowing for quick identification of "parameter islands" where a strategy remains consistent even if inputs are slightly adjusted.

Details

This script operates by precomputing 100 variations of the Supertrend logic bar by bar. Instead of relying on a single static input, the indicator evaluates the historical performance of each variation using metrics such as Win Rate, Net Profit, Profit Factor, and Reward to Risk Ratio.

The "Stability" feature is particularly powerful, as it calculates a 3x3 window average across the matrix to find areas where the strategy maintains consistent results. By penalizing high variance in this window, the indicator highlights regions that are not just profitable, but also resilient to minor parameter shifts. This helps prevent curve fitting and encourages the selection of settings that are mathematically more likely to perform in live market conditions.

Settings

Main Indicator

  • Auto Apply Stable Parameters: When enabled, the indicator automatically calculates and applies the most stable parameter set across the matrix to the chart.
  • ATR Length: Sets the baseline lookback period for the primary Supertrend calculation.
  • Multiplier: Defines the sensitivity of the primary Supertrend line.

Sensitivity Ranges

  • Length Start: The starting value for the ATR length optimization matrix.
  • Length Step: The increment value for the ATR length across the matrix.
  • Multiplier Start: The initial multiplier value for the matrix.
  • Multiplier Step: The increment value for the multiplier across the matrix.

Optimization

  • Metric: Select the performance criteria used to generate the 3D surface, including options like Win Rate, Net Profit, Profit Factor, and Reward per Risk Ratio.

3D Surface Style

  • High Value Color: Defines the color for the peak values of the 3D surface.
  • Low Value Color: Defines the color for the lowest performing areas of the 3D surface.
  • Wireframe Color: The color of the grid structure.
  • Stable Area Color: The specific color used to highlight the most stable regions on the map.
  • X Spacing, Y Spacing, and Z Height: Adjusts the visual scale and orientation of the 3D surface for better visibility on your chart.

Dashboard

  • Enable Dashboard: Toggles the display of the data table and distribution statistics.
  • Position and Size: Allows you to customize the placement and text scale of the dashboard overlay.

FAQ

How do I access the Supertrend Parameter Sensitivity 3D indicator?

You can get access on the LuxAlgo Library for charting platforms like TradingView, MetaTrader (MT4/MT5), and NinjaTrader for free.

Does this script backtest accurately?

The script performs a bar by bar calculation across all 100 combinations to ensure that every metric is derived directly from the underlying price action, providing a robust, data driven overview of parameter performance.

Can I use the Auto Apply feature for live trading?

Yes, the Auto Apply feature constantly evaluates the most stable parameter set, allowing the Supertrend to adapt to current market conditions based on the criteria you have defined in the settings.

Free indicator

Get free access to this indicator on the platforms below.

TradingView
NinjaTrader
MetaTrader 4/5

Unlock the entire LuxAlgo Library

Every indicator, every strategy, full charts, and complete access to Quant — our AI agent.