5 Common Errors in Cup and Handle Analysis
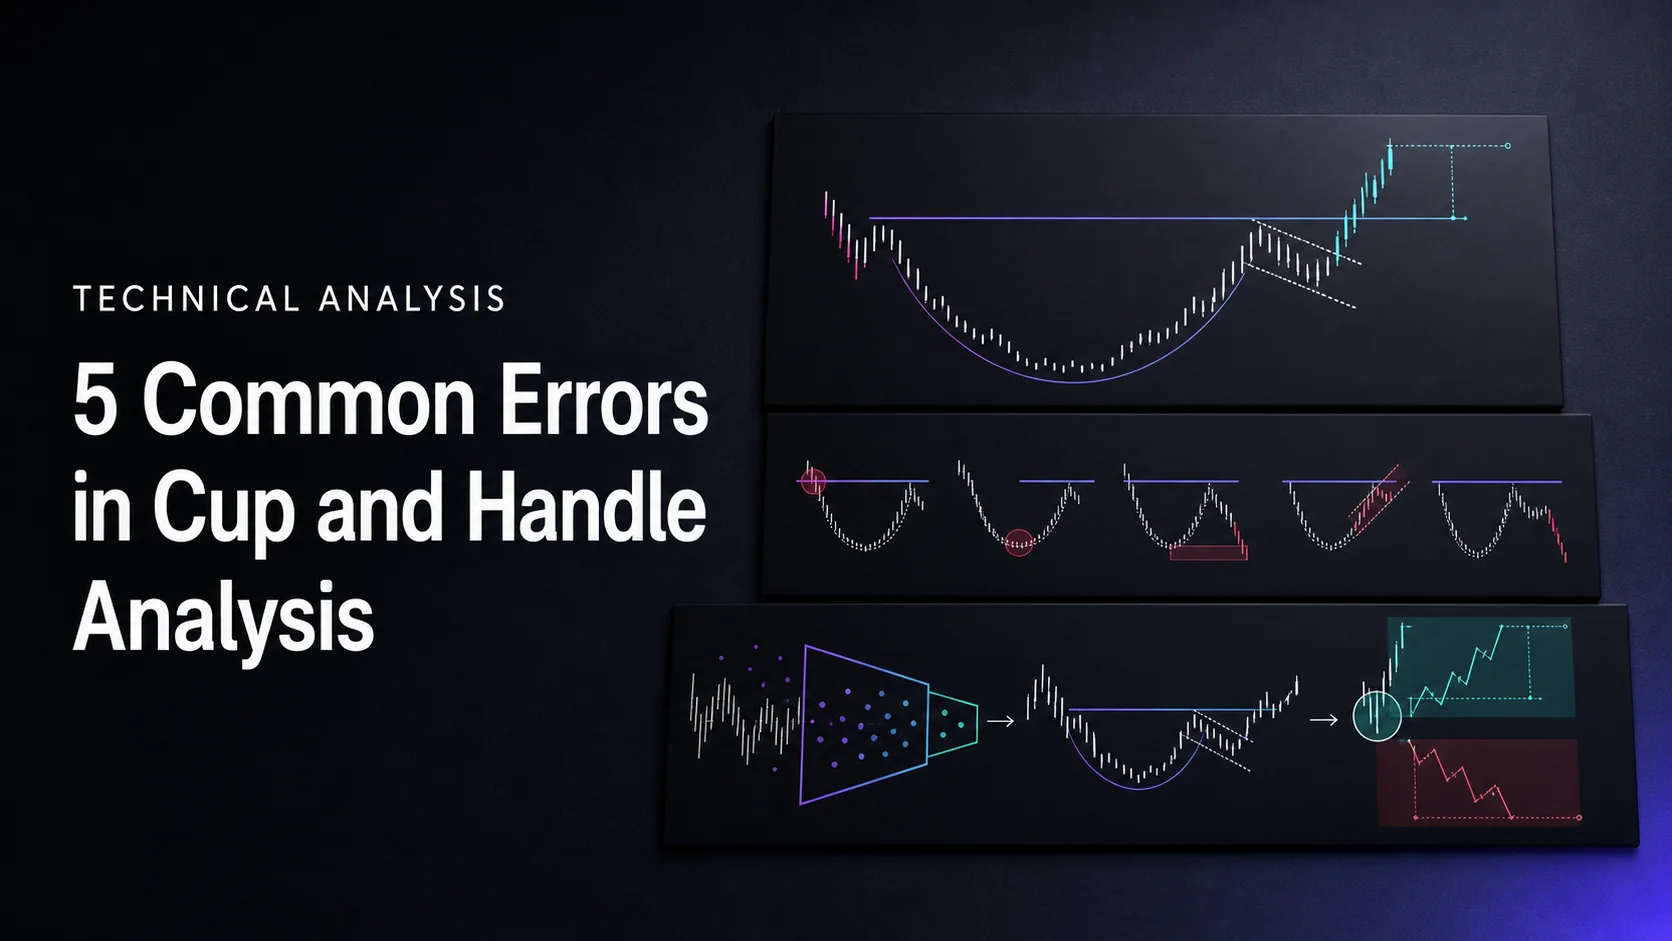
The cup and handle is a bullish continuation pattern: a rounded consolidation after an advance, followed by a smaller pullback and a breakout. The main analytical errors are misreading its shape, treating volume as proof, entering before the chosen trigger, setting risk inconsistently and ignoring market context.
LuxAlgo’s charting and AI platform helps you examine these decisions on Quant Charts and make the rules explicit with Quant, our coding agent. Start by separating a developing shape from a completed setup. Neither an attractive chart nor an indicator label establishes a winning trade.
Quick Comparison
| Error | What goes wrong | Practical correction |
|---|---|---|
| Wrong pattern recognition | A V-shaped rebound or an unfinished rounded base is labeled a completed cup and handle. | Check the prior advance, cup, handle and trigger separately. |
| Missing volume signals | A single spike or a different feed is treated as confirmation. | Define the comparison period, session and volume source. |
| Early trade entry | An anticipatory entry is evaluated as if the later breakout were already known. | Choose a close, stop-order or retest rule before the trade. |
| Poor stop-loss setting | Stop distance changes without recalculating position size. | State invalidation, any buffer and maximum planned exposure. |
| Market trend neglect | A bullish-looking base overrides broader weakness or event risk. | Test a predefined context filter and review correlated exposure. |
1. Wrong Pattern Recognition
A classic cup is rounded rather than a sharp V. Its right side recovers toward the earlier high, then a shallower handle forms near the upper portion. A downward drift, small flag or short sideways consolidation can serve as the handle under different definitions; a steeply rising or deep handle does not fit the usual template.
Without that final pullback, the formation is still a rounded base. Two distinct lows separated by a rebound are more consistent with a double bottom. Identify what price has actually done instead of selecting the most appealing label.
| Pattern | Structure to inspect | Typical interpretation |
|---|---|---|
| Cup and handle | Rounded cup followed by a smaller handle and a defined resistance break. | Bullish continuation when preceded by an advance. |
| Rounding bottom | Gradual basin without the separate handle requirement. | Potential bullish reversal after a decline. |
| Double bottom | Two low tests separated by a rebound. | Potential bullish reversal after its intervening resistance breaks. |
Validate Proportions and Timeframe
The LuxAlgo Cup & Handle guide describes the classic stock-base framework: a prior advance, a rounded cup, and a handle in its upper half. A base lasting at least seven weeks and a correction around 12%–33% from the high belong to a particular stock-analysis framework. They are not universal thresholds for every intraday or cryptocurrency chart.
Do not mix percentage denominators. A decline from a $100 rim to an $80 bottom is a 20% price correction: ($100 − $80) ÷ $100. If the preceding advance was from $60 to $100, that same $20 decline retraces 50% of the $40 advance. “Percent of the prior advance” and “percent below the high” describe different measurements.
StockCharts’ cup-with-handle discussion uses a broader descriptive approach, with cups often spanning one to six months and handles commonly one to four weeks, while acknowledging exceptions. State the framework and timeframe you use. A seven-week minimum does not translate to seven bars on every chart.
For a cup extending from $100 to $80, its midpoint is $90. A handle low at $95 remains in the upper half and retraces 25% of the recovery from $80 to $100. A low at $89 falls below the midpoint. This gives a measurable way to discuss handle depth without claiming that any one threshold guarantees success.
Developing Patterns Are Different from Completed Setups
LuxAlgo Half Cup studies partially formed rounded shapes. Its curved channels and green or red breakout dots can help examine developing price action, but a Half Cup dot is not proof that a full cup and handle has completed.
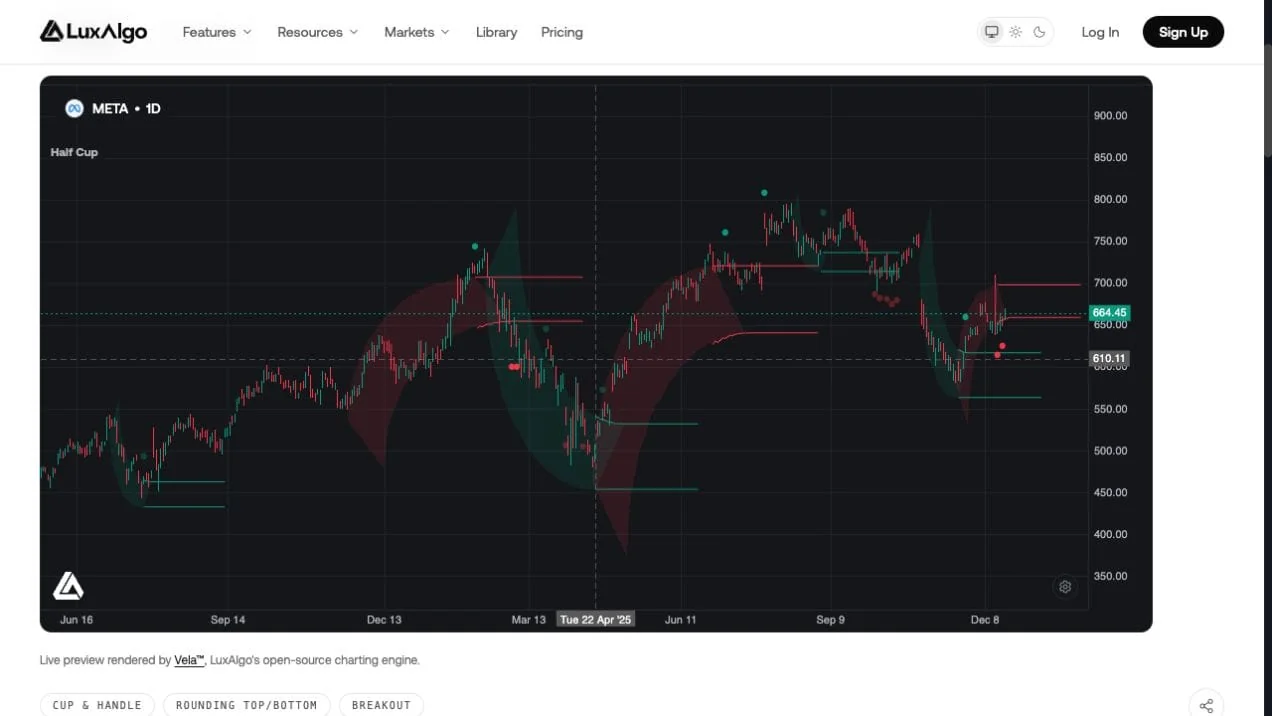
The tool’s documentation explicitly separates backpainted channels from breakout dots that remain where they printed. A channel drawn over earlier candles was not necessarily available on those candles. Record the detection time when evaluating a strategy; do not enter retrospectively at the beginning of the displayed arc.
Swing Length, channel length, broadness, vertical shift and validation thresholds affect the displayed patterns. Keep those inputs with the chart record. The Library offers a native preview and an Open on Quant Charts action; the TradingView edition is a separate platform implementation whose settings and behavior should also be checked.
2. Missing Volume Signals
Volume is useful context, but it measures activity rather than certifying a pattern. The traditional interpretation looks for quieter trading during consolidation and greater participation when resistance breaks. Individual bars can depart from that template without settling the outcome.
| Stage | Common observation | What to check |
|---|---|---|
| Cup decline and bottom | Activity may contract as the base develops. | Distinguish a sustained change from isolated news-driven spikes. |
| Right side of the cup | Participation may increase during recovery. | Compare equivalent sessions and the same data feed. |
| Handle | A quieter pullback can fit the consolidation hypothesis. | Specify whether volume is compared with the right side or a rolling average. |
| Breakout | Above-baseline activity can support the participation argument. | A spike can also accompany exhaustion or a failed break. |
Define “Above Average”
Instead of requiring a vague surge, one research rule might require completed daily volume above 1.5 times the mean of the previous 20 completed sessions. With a baseline of one million shares, 1.5 million is 50% above that baseline. This is an illustrative test threshold, not a universal confirmation level or an established optimal setting.
Exclude the breakout bar from its own baseline if that is what the rule specifies. An unfinished daily bar should not be compared with full-day history as though the session had ended. For intraday studies, a time-of-day comparison can address the usual difference between opening, midday and closing activity.
Volume Profile distributes activity across price levels. It is different from the per-bar volume comparison used above. Neither a profile peak nor an indicator’s green signal automatically establishes breakout participation.
Check Quant Charts data coverage before comparing markets. For example, exchange-specific U.S. equity volume is not consolidated market volume, and a cryptocurrency exchange does not represent every venue. Missing or incompatible volume should be handled explicitly rather than silently treated as zero or as a failed signal.
3. Early Trade Entry
Buying while the handle is still forming is an anticipatory strategy. It may offer a different entry price, but it also takes the risk that the expected breakout never arrives. Evaluate it separately from a strategy that waits for completed-bar confirmation.
Choose One Entry Rule
- Completed close: require a close above the previously defined handle resistance, then model entry at the next available price. You cannot know the final close earlier in the bar.
- Buy-stop trigger: place a planned trigger above resistance. A gap can fill beyond the trigger; it is not the same execution model as waiting for the close.
- Retest: wait for a specified return and recovery after the break. Define how long the setup remains active and accept that a retest may never occur.
Some traders require the cup rim to break as well as the handle boundary. Write down which level controls the decision. Redrawing that level after a losing trade creates an inconsistent sample.
A bullish candle, a volume filter and a moving-average condition may help define a setup, but adding them does not justify a 95% success-rate claim. Any rate needs a named sample, period, entry and exit rules, costs and a definition of success. Pattern completion, reaching a measured target and making a net profit are different outcomes.
Test the Entry with Quant
For a small, manually reviewed set of candidates, provide the handle levels and the dates on which they became known to Quant, our coding agent. An example request is:
For each marked candidate, activate its resistance and handle low only after the recorded recognition date. Require a completed daily close above resistance and volume above 1.5 times the prior 20 sessions’ average. Enter at the next open, allow one position at a time, and expire an untriggered candidate after ten bars. Use the recorded handle low minus a configurable ATR buffer as initial invalidation. Reject entries whose gap or stop distance exceeds my stated limits.
This tests the supplied candidates; it does not prove that an automatic cup detector exists or that the candidate selection is unbiased. For an automated study, define the geometry, pivot confirmation delays and handle criteria separately. Include failed candidates and use only information available at the decision time.
Follow Making Strategies with Quant: inspect the generated code and run it manually. Check a few entries and expirations against the chart, then set costs and sizing in the native strategy backtest. Save the run, inspect the trade log and evaluate a period that was not used to tune the rules.
4. Poor Stop-Loss Setting
A stop should correspond to the chosen invalidation rule and risk budget. A level below the handle low is one structural choice; a volatility buffer can make that rule more explicit. Neither a tight stop nor a wide stop is inherently superior.
For a hypothetical $100 entry, a $96 handle low and a $1 buffer, the initial stop is $95. Planned price risk is $5 per share. A $200 risk budget permits 40 shares before commissions, slippage and other constraints. If a $110 target is used, the $10 potential gain is 2R, not a guaranteed 2.5:1 return.
If the entry gaps to $103 while the stop stays at $95, risk rises to $8 per share. The same $200 budget permits only 25 shares before costs. A later gap through the stop to a $93 fill would lose $400 on those 40 shares entered at $103; this illustrates why retaining the old size after a worse entry can exceed the planned loss.
Use a Predeclared Management Rule
- Initial invalidation: identify the structural level and any volatility buffer before entry.
- Trailing rule: state when it starts, how it updates and whether it can move only toward price.
- Time exit: define how many bars without the expected progress ends the trade.
- Exposure limit: include other positions, correlated holdings, buying power and event risk.
A fixed initial stop is not automatically a mistake. It can be part of a tested system. Repeatedly widening a stop after entry increases potential loss, while moving it to breakeven too quickly can change the strategy’s trade distribution. Compare management rules without assuming that more adjustment means better protection.
Average True Range measures movement magnitude, not direction. Its length, smoothing and price-unit convention matter. A trailing stop also cannot guarantee the preservation of open profit when the market gaps or liquidity is insufficient.
5. Market Trend Neglect
The classical bullish continuation interpretation presumes an earlier advance. Broader market weakness, sector declines, earnings or a correction can still overwhelm a visually convincing base. A strong market does not by itself justify a larger position.
For example, a research filter might require the stock and a chosen benchmark to close above their 200-day moving averages. A 50-day average could serve a separate intermediate-trend role. Compare results with and without each filter rather than assuming several correlated measures provide independent confirmation.
In a sideways market, define what counts as a meaningful break. During a decline or correction, a predeclared rule may pause new long setups or reduce exposure. Use information known then; do not label every losing sample as a market condition that would have been avoided.
When using daily and weekly charts together, remember that the current weekly bar is unfinished until the week closes. Test whether the rule uses that developing value or only the last completed week. A higher timeframe supplies context, not automatic accuracy.
10 Common Mistakes of Trading Cup and Handle Pattern
Review Before Trading
Record the cup, handle, resistance, recognition time, volume source, entry model and risk limit. Save examples that fail as well as those that succeed. Use Quant Charts to inspect the evidence and Quant to turn specific decisions into repeatable rules.
A measured cup-depth objective is a projection, not a promised exit. Judge the process by reproducible decisions and full results after costs, rather than a pattern’s reputation or a claimed universal win rate.
Frequently Asked Questions
How can you spot a real cup and handle pattern?
Look for a prior advance, a rounded cup, a shallower handle near the upper portion and a defined resistance break. State the timeframe and criteria; the shape alone does not guarantee a profitable trade.
Is a Half Cup dot a completed cup-and-handle signal?
No. LuxAlgo Half Cup studies developing rounded shapes. Its channels are backpainted from detection, while breakout dots remain where they printed. Treat a dot as a candidate under explicit trading rules.
How deep should the cup be?
Depth depends on the framework. Distinguish the percentage decline from the rim from the percentage retracement of the previous advance; they use different denominators.
Must breakout volume be 50% above average?
No universal threshold applies. Define the baseline, session and feed, then test any chosen multiplier. Higher volume does not guarantee a sustained breakout.
Should I always trail the stop?
No. Fixed and trailing exits are different rules. Evaluate them with realistic fills and costs, and do not widen the stop casually after entry.
Does the pattern have a 95% success rate?
There is no universal rate established here. A credible estimate requires a defined sample, entry and exit rules, costs and a clear definition of success.
References
LuxAlgo Resources
- LuxAlgo Cup & Handle Guide
- Half Cup Indicator and Backpainting Notes
- LuxAlgo Quant
- Making Strategies with Quant
- Native Strategy Backtests
- Quant Charts Data
External Resources
Read next