Concept
Rounding Top/bottom
Rounding Top/bottom, also known as saucer, is a Chart & Candlestick Patterns concept. The Library holds 1 implementation, a working definition you can pull into Quant.
Top Rounding Top/bottom indicator
The top custom implementation, built on the original standard Rounding Top/bottom formula.
1 total
The Rounding Top/bottom implementation below can become a backtested trading strategy — describe your rules and Quant writes the code.
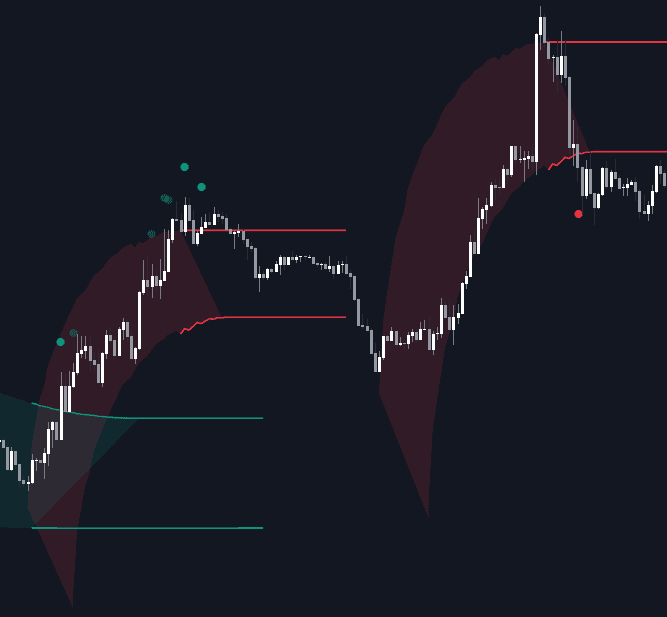
What is a Rounding Top or Bottom?
A rounding bottom, or saucer, is a gradual bowl-shaped reversal: a downtrend loses slope, the lows flatten, and higher lows build until price exits the basin on the upside. A rounding top is the dome-shaped mirror at highs. There is no single dramatic pivot; the pattern is defined by a slow rotation of control from one side to the other, which is why it typically takes far longer to form than event-driven reversals. In the classic description of bottoms, volume traces a matching bowl: heavy into the decline, quiet through the middle, expanding on the right side.
The pattern sits in the oldest layer of Western charting: Edwards and Magee's Technical Analysis of Stock Trends (first published 1948) described rounding turns and their bowl-shaped volume as characteristic of quieter issues turning over long stretches. Unlike reversals announced by a compact candle formation, a hammer or a morning star, the saucer has no decisive pivot; control changes hands by attrition, so individual candlestick patterns inside the base carry little weight.
Completion is usually read as the breakout above the rim of the bowl, or below it for a top. Add a shallow pullback after the recovery and the same base becomes a cup and handle; without the handle, the saucer stands on its own.
As an auction story, the bowl is exhaustion in slow motion: sellers who drove the left side run out of inventory, the middle drifts on small ranges and thin trade, and the right side shows buyers willing to pay up. The volume signature therefore matters as much as the price arc, and the slowness is a feature: a base built over months is tested repeatedly before an entry is ever triggered.
How to identify a rounding bottom on a chart
The geometry is easiest to grade on daily and weekly charts, where curvature has room to show.
- 1Start from an established downtrend that visibly decelerates: each new low undercuts the prior one by less, with no single capitulation bar required.
- 2Look for a listless middle: contracting ranges, overlapping candles, frequent doji and runs of inside bars, the lightest volume in the structure.
- 3Confirm the right side curves up in rough mirror of the left, higher lows building gradually; a vertical snapback is a V-reversal, not a saucer.
- 4Check the volume signature: heaviest into the left-side decline, quietest through the middle, expanding as the right side advances.
- 5Mark the rim, the horizontal where the decline began; the pattern completes only on acceptance above it, ideally via a wide-range bar or an upside gap.
- 6For a rounding top, invert everything: flattening highs, a quiet dome, then a breakdown through the rim.
How traders use it
- As a position-trade reversal entry: buy the rim breakout of a mature saucer, with a measured objective taken from the bowl's depth and the stop under the right side of the base.
- As an anticipatory accumulation approach: entries along the right side as higher lows form, accepting an earlier price against the risk that the basin is still incomplete.
- As a volume check: volume drying up through the middle of the base and expanding on the right side supports the turn, while heavy selling reappearing inside the bowl warns that the base is failing.
- As a frame for lower-timeframe triggers: right-side entries are often timed with an engulfing bar or pin bar at a higher low, a defined risk point inside the larger arc.
- For failure management: a rim breakout that drops straight back into the bowl is a recognized trap, so many traders wait for a retest to hold, or watch how any gap fill behaves at the rim, before adding size.
Rounding Top/Bottom vs related reversal patterns
Double Top/bottom: Both reverse trends at extremes, but the W or M shape turns on discrete retests with a defined neckline, while the saucer rotates gradually with no distinct touches. Saucers take longer and give less precise triggers.
Ascending/descending/symmetrical Triangle: Triangles compress price between converging straight boundaries and lean toward continuation; the saucer is curved and reversal-oriented. Both resolve on a boundary break, but triangle lines are drawn from swing points; the saucer's rim is inherited from where the decline began.
Two-bar Reversal: Opposite ends of the speed spectrum: a two-bar reversal marks the change of control in one violent rejection; the saucer stretches the same handover across weeks or months. Slow supplies more evidence; fast, a better price.
Concept family
Chart & Candlestick Patterns
84 concepts mapped · 84 in the Library
Rounding Top/bottom FAQ
Turn Rounding Top/bottom into a trading strategy.
Take the implementation from this page into Quant, then build on it, backtest it on real data, and keep refining it in conversation.