
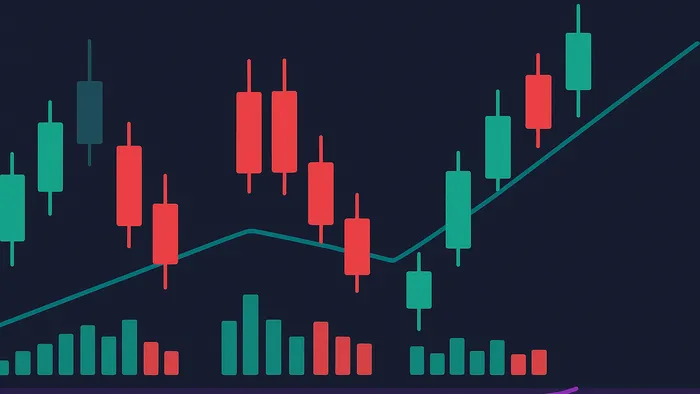

Learn how to enhance trading decisions through candlestick confirmation techniques, volume analysis, and pattern recognition for better market predictions.
Candlestick confirmation is a method that helps traders validate market trends using price action, volume, and technical indicators. It improves decision-making by reducing false signals and identifying reliable patterns. Here's a quick overview:
-
Key Benefits:
- Fewer false signals by requiring multi-day confirmation.
- Better timing for entry and exit points.
- Defined risk levels with stop-loss placement.
-
Main Patterns:
- Bullish: Morning Star, Inverted Hammer, Bullish Harami.
- Bearish: Three Black Crows, Evening Star, Dark Cloud Cover.
- Indecision: Doji patterns like Gravestone and Dragonfly.
-
Confirmation Tools:
- Volume analysis (e.g., spikes confirm trend strength).
- Indicators like RSI and MACD to validate patterns.
- Higher timeframes for broader context.
How to Use Volume and Candlestick to Predict Trades
Main Confirmation Patterns
Candlestick patterns are a reliable way to identify trading opportunities, though their success rates can vary.
Uptrend Confirmation Patterns
Bullish candlestick patterns can help confirm uptrends, with success rates that differ depending on the pattern:
| Pattern | Success Rate | Description |
|---|---|---|
| Three Outside Up | 70% | Indicates a strong reversal after a downtrend. |
| Morning Star | 65% | Signals reversals at key support levels. |
| Inverted Hammer | 65% | Confirms a bottom reversal. |
| Bullish Harami | 54% | Suggests trend continuation. |
"The turning point came when I realized that a signal on its own is not enough. I needed to consider the context in which the signal was appearing." – Andrew Rul Trading
Bearish patterns also play a crucial role in identifying market reversals.
Downtrend Confirmation Patterns
Bearish candlestick patterns are used to confirm downtrends and signal reversals:
| Pattern | Success Rate | Description |
|---|---|---|
| Three Black Crows | 78% | Strongly confirms a downtrend. |
| Bearish Abandoned Baby | 78% | Clearly signals a reversal. |
| Evening Star | 68% | Indicates a top reversal. |
| Dark Cloud Cover | 65% | Confirms resistance levels. |
Consolidation Patterns
Consolidation patterns often indicate indecision in the market, which can precede significant breakouts. For example, the Marubozu pattern has a 69% success rate in predicting future market direction.
| Doji Type | Success Rate | Market Condition |
|---|---|---|
| Gravestone Doji | 61% | Suggests a bearish reversal. |
| Dragonfly Doji | 60% | Points to a bullish reversal. |
| Long-Legged Doji | 57% | Reflects market indecision. |
| Regular Doji | 55% | Indicates trend exhaustion. |
For better results, combine these candlestick patterns with volume analysis and other technical indicators.
Volume Analysis for Confirmation
Analyzing volume helps validate candlestick patterns and boosts the accuracy of trading decisions. This section expands on candlestick techniques by showing how volume can provide additional confirmation.
How Volume Confirms Patterns
Volume measures the strength behind price movements, reflecting market participation and confidence. When price changes occur with high volume, they often indicate more reliable trends.
| Pattern Type | Volume Characteristics | Confirmation Strength |
|---|---|---|
| Engulfing Candles | Volume 2-3x above average | Very High |
| Hammer/Shooting Star | Spike on reversal candle | High |
| Doji | Gradual volume build-up | Moderate |
Combining Volume with Candlestick Patterns
Using volume alongside candlestick analysis creates a solid foundation for evaluating trades. It emphasizes key alignments between patterns and market activity:
| Indicator | Volume Confirmation | Signal Strength |
|---|---|---|
| RSI Divergence | 2x Volume Spike | Very Strong |
| MACD Crossover | Sustained Volume | Strong |
| Moving Averages | Rising Volume | Moderate |
| Support/Resistance | Volume Breakout | High |
Real-World Volume Confirmation Examples
Practical examples show how volume confirmation works. In July 2024, Tesla (TSLA) surged past the $750 level with volume three times the average. After this breakout, a brief pullback with decreasing volume indicated supply exhaustion. By July 27th, both price and volume resumed their upward trend, offering a profitable entry opportunity.
Another case occurred in March 2024 with the SPY ETF. From March 7–10, SPY experienced a sharp downtrend, marked by large red volume bars as it approached the 380 level. An inverted hammer candle formed on March 13th with significant volume, signaling a successful reversal.
| Trade Component | Action Guidelines |
|---|---|
| Entry Signal | Look for 2-3x average volume; enter above the high of the reversal candle. |
| Stop Loss | Confirm the volume spike; set your stop below the recent swing low. |
| Take Profit | Target areas near previous resistance using volume resistance. |
| Exit Signal | Exit below the moving average when volume declines. |
Pairing volume analysis with other indicators can further improve results. For instance, when the Average Directional Index (ADX) exceeds 30 alongside strong volume signals, trading reliability increases significantly.
This combined approach to volume and candlestick analysis lays the groundwork for refining trade entries and improving decision-making.
Advanced Confirmation Methods
Refining confirmation goes beyond just volume. It involves combining multiple analytical layers like timeframes, technical indicators, and price levels to validate candlestick patterns more effectively.
Timeframe Analysis
Your trading style determines the timeframes you should focus on:
| Trading Style | Primary Timeframe | Confirmation Timeframe | Context Timeframe |
|---|---|---|---|
| Scalping | 5-15 minutes | 1-hour | 4-hour |
| Day Trading | 1-hour | 4-hour | Daily |
| Swing Trading | 4-hour | Daily | Weekly |
| Position Trading | Daily | Weekly | Monthly |
This top-down approach starts with higher timeframes to identify broader trends, then narrows down to lower timeframes to pinpoint entry points. Pair this process with technical indicators to improve signal accuracy.
Technical Indicator Confirmation
Here are two reliable methods for confirming candlestick patterns with indicators:
- MACD: A bullish crossover occurring alongside a bullish candlestick strengthens the case for upward movement.
- RSI: Divergence between price and RSI can signal potential reversals, especially when aligned with candlestick patterns.
Price Level Analysis
Candlestick patterns near key price levels often carry added weight. For instance, Broadcom (BRCM) formed a bullish engulfing pattern around the $210 support level, which was later confirmed by a strong white candlestick near $208.
To ensure dependable confirmation, consider cross-checking signals using multiple technical indicators and paying close attention to support and resistance levels.
- Start with higher timeframes to identify trends.
- Cross-check signals using multiple indicators.
- Pay attention to support and resistance levels.
"The hard work in trading comes in the preparation. The actual process of trading, however, should be effortless".
Trading Implementation
Use candlestick confirmation effectively by combining pattern recognition with solid risk management strategies.
Pattern Confirmation Steps
Following a clear process for confirming patterns can help reduce false signals and improve trading results:
| Step | Action | Confirmation Criteria |
|---|---|---|
| Pattern Recognition | Identify key formations | Check volume, candle size, and prior price action |
| Technical Validation | Use indicators | Look for MACD crossovers or RSI readings |
| Risk Assessment | Evaluate risk-reward | Determine position size and set stop-loss levels |
"A revolutionary concept developed by Greg Morris in 1991, called candle pattern filtering, provides a simple method to improve the overall reliability of candle patterns. While the short‐term trend of the market must be identified before a candle pattern can exist, the determination of overbought and oversold markets using traditional technical analysis will enhance a candle pattern's predictive ability. Concurrently, this technique helps eliminate bad or premature candle patterns."
Common Pattern Analysis Mistakes
Misreading candlestick patterns can lead to losses. For example, a trader once entered a long position based on a hammer pattern on Bitcoin's 1-hour chart, ignoring the ongoing downtrend.
Here’s how to avoid common missteps:
- Ignoring Context: Always evaluate patterns in the broader market context.
- Timeframe Issues: Start with higher timeframes for more reliable signals.
- Confirmation Bias: Actively search for evidence that contradicts your assumptions.
- Neglecting Risk Management: Always set stop-loss orders to limit potential losses.
These mistakes highlight the importance of maintaining discipline and following a structured trading plan.
Trading Plan Integration
To avoid errors in analysis, integrate candlestick confirmation into your trading plan with these steps:
-
Pattern Identification
Define clear rules for spotting candlestick patterns and combine them with other technical tools. -
Risk Management
Establish firm guidelines for position sizing and stop-loss placement based on the pattern's characteristics. -
Trade Execution
Create a systematic process for entering and exiting trades to maintain consistency.
"Each candlestick is a simple, yet powerful tool to understand what's happening in the market."
Summary
Candlestick confirmation works best when guided by clear principles and consistent application. Research from Taiwan's Stock Exchange and Japan's Nikkei 225 highlights improved prediction accuracy when combining candlestick patterns with advanced analytical models.
Success in pattern trading rests on three key elements:
| Component | Key Consideration | Implementation |
|---|---|---|
| Pattern Recognition | Multiple timeframe analysis | Focus on higher timeframes for reliable signals |
| Volume Confirmation | Price-volume relationship | Look for volume spikes supporting pattern formation |
| Technical Integration | Indicator combination | Use tools like moving averages and RSI for validation |
These elements form the backbone of trading strategies used by experienced traders throughout history.
"Each candlestick is a simple, yet powerful tool to understand what's happening in the market"
This quote underscores the importance of viewing patterns within the larger market context rather than treating them as standalone indicators.
"The game of speculation is the most uniformly fascinating game in the world. But it is not a game for the stupid, the mentally lazy, the person of inferior emotional balance, or the get-rich-quick adventurer."
Achieving success requires disciplined practice, effective risk management, and a commitment to continuous learning—no single indicator or analysis method alone will guarantee results. Blending modern techniques with traditional candlestick patterns has proven effective in today’s trading landscape.