Concept
Morning Star
Morning Star, also known as morning doji star, is a Chart & Candlestick Patterns concept. The Library holds 1 implementation, a working definition you can pull into Quant.
Top Morning Star indicator
The top custom implementation, built on the original standard Morning Star formula.
1 total
From studying Morning Star to trading it: take the implementation below into Quant and backtest it instantly.
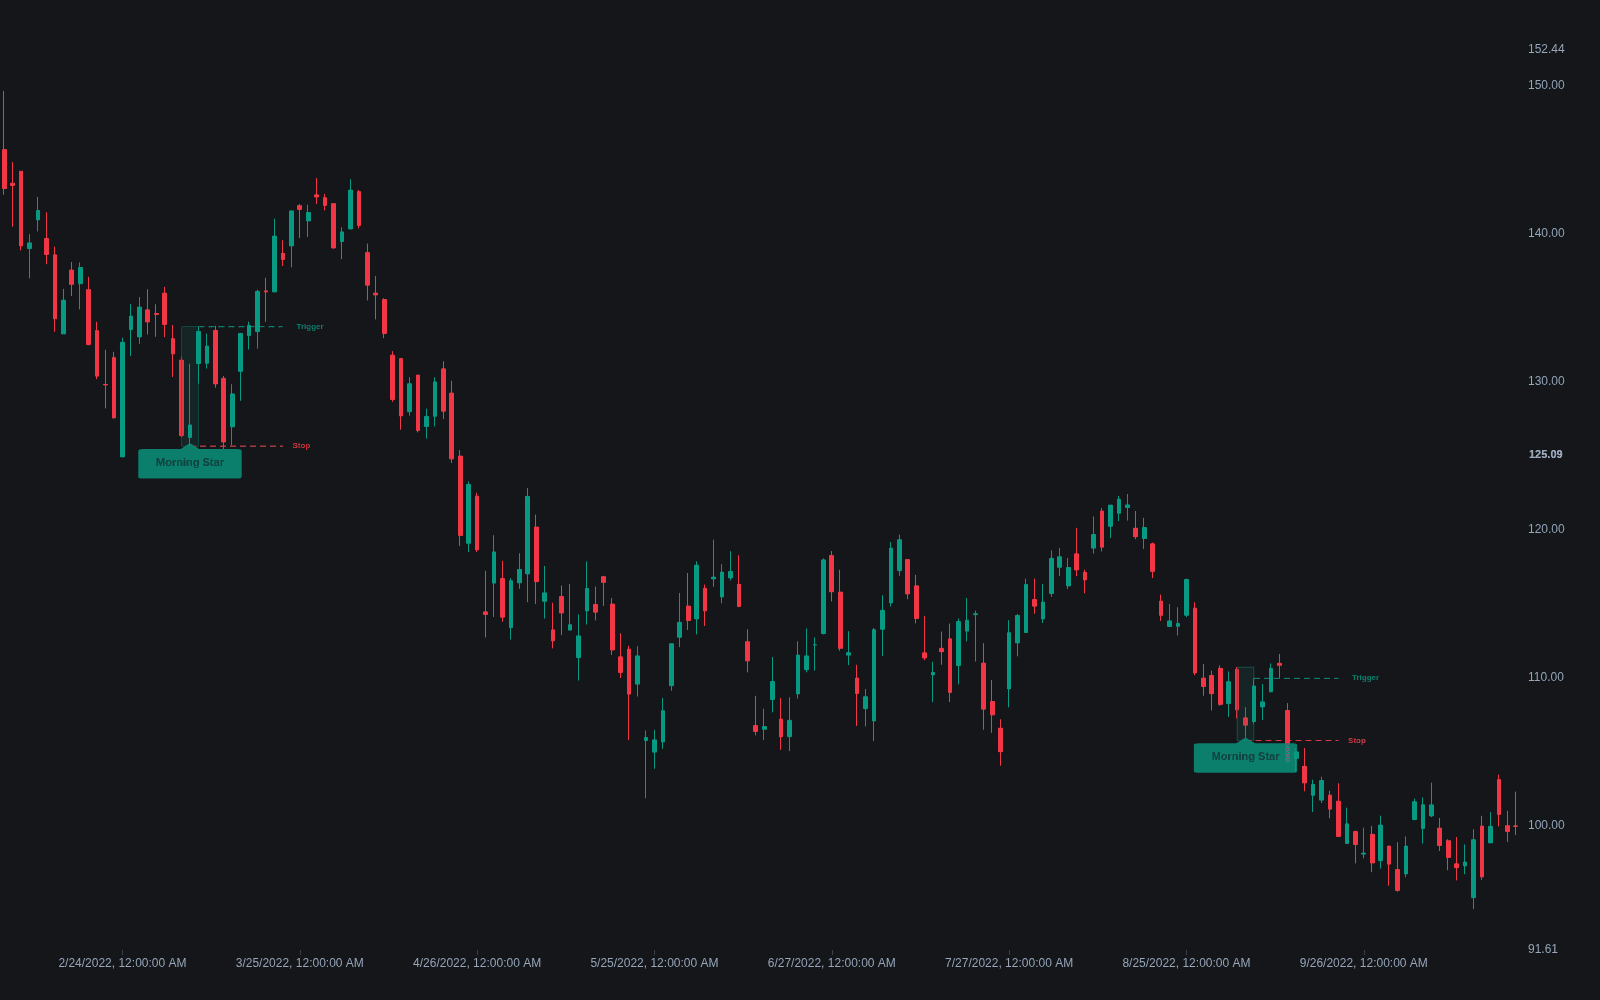
What is a Morning Star?
A morning star is a three-candle bullish reversal pattern from Japanese candlestick tradition, printed at the bottom of a decline: a long bearish candle, then a small-bodied star that ideally gaps below it (a doji there makes it a morning doji star), then a long bullish candle closing well into the first candle's body, commonly above its midpoint. The sequence reads as momentum, indecision, reversal: sellers in control, then a stall, then buyers taking the session back.
The pattern belongs to the candlestick canon that Japanese technicians developed over centuries of rice and equity trading and that Steve Nison's early-1990s books carried into Western practice, where the morning star has ranked among the most cited bottom patterns since. The name is the tradition's own: the star that precedes sunrise, indecision before the turn.
The star is the hinge. Its small body records the moment the decline stopped making progress, and the third candle's depth into the first body is the common gauge of how decisively control changed. In 24-hour markets true gaps are rare, so most modern definitions relax the gap requirement and accept a small body near the first candle's close. Its bearish mirror at tops is the evening star.
Candlestick arithmetic explains why the pattern reads as it does: merge the three candles into one and a proper morning star collapses into a hammer-like bar, long lower rejection and a close near the top. That crosswalk is a practical quality check, and it also locates the morning star inside the wider family of candlestick patterns: it is the three-act staging of the same failed-decline event that the hammer compresses into one act and the two-bar reversal plays in two.
How to identify a morning star on a chart
All three acts must be present; two long candles around an ordinary pullback bar do not qualify.
- 1Require a decline into the pattern: the first candle should extend an established down leg with a long bearish body.
- 2Find the star: a small real body (either color) positioned at or below the first candle's close, ideally gapped in markets that still gap; a doji upgrades the read.
- 3Demand the third act: a long bullish candle closing well into the first candle's body, with the midpoint as the common minimum standard.
- 4Prefer supporting context: a tested support level, oversold conditions, or expanding volume on the third candle all raise the pattern's grade.
- 5Set the reference points: the star's low is the pattern's invalidation, and the third candle's close or high is the conventional trigger.
- 6Cross-check by merging: the three candles combined should resemble a hammer; if the merged bar shows no lower rejection, the pattern is weaker than it looks.
How traders use it
- As a bottom-reversal trigger with location: the pattern carries more weight after an extended decline into a tested support level or demand zone than in the middle of a range, where the same three candles are usually noise.
- With entry and stop conventions: common triggers are the third candle's close or a break above its high, with the stop below the star's low, the natural invalidation point since that is where the market rejected lower prices.
- With confirmation stacked on: expanding volume on the third candle, oversold oscillator readings, or bullish divergence are typical filters; the pattern nominates a reversal candidate, it is not a standalone system.
- In multi-timeframe form: a daily morning star often prints as a single hammer on a higher timeframe and as a full sweep-and-reclaim sequence on a lower one, so traders check that the readings agree before weighting the pattern.
- In scanners: the three-candle geometry codes cleanly (body sizes, star position, third-candle penetration), with location and trend filters doing the real work of separating tradable prints from the many mid-range false positives.
Morning Star vs related reversal patterns
Two-bar Reversal: The two-bar reversal is the abrupt version: full bearish commitment answered immediately by full bullish commitment. The morning star inserts the indecision candle between them, a gentler three-step turn that many read as the more mature bottoming sequence.
Hammer: The hammer compresses the same event into one candle: probe lower, rejection, close near the top. A morning star merged across its three candles typically produces a hammer shape, which is why the two patterns often mark the same low on different timeframes.
Engulfing Bar: The bullish engulfing skips the pause: the second candle swallows the first outright. It is the two-candle aggression play, while the morning star documents hesitation first, so the engulfing tends to fire earlier and the star to filter harder.
Concept family
Chart & Candlestick Patterns
84 concepts mapped · 84 in the Library
Morning Star FAQ
Turn Morning Star into a trading strategy.
Take the implementation from this page into Quant, then build on it, backtest it on real data, and keep refining it in conversation.