Concept
Harami
Harami, also known as harami cross, is a Chart & Candlestick Patterns concept. The Library holds 1 implementation, a working definition you can pull into Quant.
Top Harami indicator
The top custom implementation, built on the original standard Harami formula.
1 total
The Harami implementation below can become a backtested trading strategy — describe your rules and Quant writes the code.
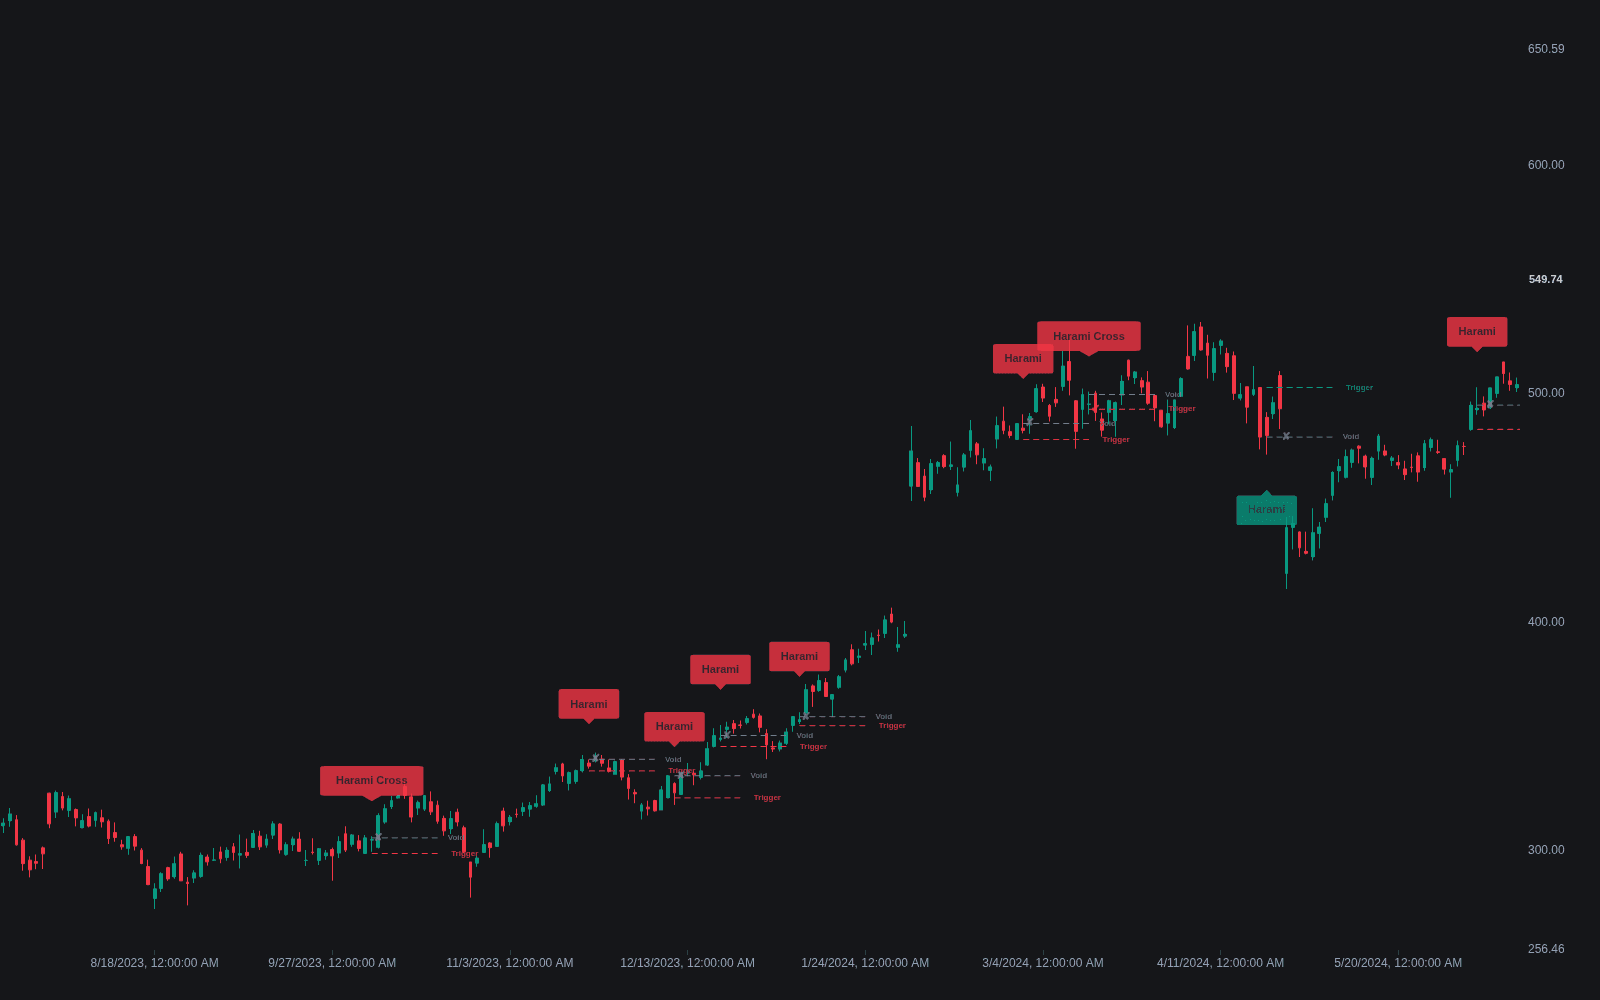
What is a Harami?
A harami is a two-candle candlestick pattern in which the second candle's real body sits entirely inside the first candle's real body: a wide-range candle followed by a small one that fails to extend the move. The name is Japanese for pregnant, after the shape of a large body carrying a smaller one. After a decline, a large bearish body holding a small inside body is a bullish harami; after an advance, the mirror is a bearish harami. When the second candle is a doji, the pattern is a harami cross, conventionally the stronger hesitation signal.
The pattern arrived with the rest of the Japanese candlestick canon, which Steve Nison's work introduced to Western readers in the early 1990s. In that tradition the harami is filed among the hesitation signals rather than the strong reversals: the market that just committed to a wide-range move suddenly produces a candle whose entire body fits inside the previous one, participation shrinking exactly where follow-through was expected.
The harami is defined on real bodies, which distinguishes it from the inside bar, defined on the full high-to-low range. It is also the mirror image of the engulfing pattern: engulfing is expansion against the prior candle, harami is contraction after it. A harami marks a loss of momentum, not a completed reversal, so most treatments wait for a later candle to break the small body's range before acting.
Grading the pattern is mostly grading the second candle. The smaller its body and the deeper it sits inside the first candle's body, the cleaner the contraction reads, with the harami cross as the limit case; a second candle closing near the first one's extreme instead is barely a pause. Location does the rest of the work: a harami at a tested level after an extended leg is a candidate turn, while the same shape mid-range is routine noise that scanners flag by the dozen.
How to identify a harami on a chart
The bullish case after a decline is described; invert for the bearish case after an advance.
- 1Require a directional leg into the pattern: without a preceding move, containment has nothing to reverse.
- 2Find a wide-bodied candle in the leg's direction, ideally wider than recent bars, as the first candle.
- 3Check containment on bodies: the second candle's open-to-close body must sit entirely within the first candle's body; wicks may protrude.
- 4Grade the contraction: the smaller the second body and the nearer the pattern sits to a meaningful level, the stronger the hesitation read; a doji second candle upgrades it to a harami cross.
- 5Wait for resolution: a following candle closing beyond the pattern's range in the reversal direction is the conventional trigger, and a close beyond the opposite side voids the read.
- 6Manage expectations by context: haramis inside established ranges or against strong momentum resolve as continuation often enough that most traders demand the confirmation step.
How traders use it
- As an early reversal warning after an extended move, acted on only when a following candle closes beyond the harami's range in the reversal direction.
- As a de-risking cue for existing positions: a harami or harami cross after a long run is a common prompt to tighten stops or take partial profits rather than to reverse outright.
- As part of pattern-scanning logic, where the body-inside-body definition is easy to compute and is then filtered by trend context and location before being treated as a signal.
- As a compression flag: a harami whose second candle is also a full inside bar marks two definitions of contraction agreeing, and the subsequent break of that bar's range is traded with inside-bar mechanics.
- As the opening act of larger turns: a bullish harami whose next candle closes strongly higher completes a three-candle sequence closely related to the morning star, which is why the two patterns often mark the same lows.
Harami vs neighboring candle patterns
Engulfing Bar: The engulfing pattern is the harami reversed in roles: the second candle swallows the first instead of hiding inside it. Engulfing shows aggression against the prior move; harami shows the prior move's own aggression failing to continue.
Inside Bar: The inside bar demands full range containment, wicks included; the harami only contains bodies. Every body-contained inside bar is a harami, but many haramis poke wicks outside and would fail the inside-bar test.
Doji: A doji is one candle's statement that open and close finished nearly equal. The harami needs the two-candle context, a wide body first, and when its second candle is a doji the two vocabularies meet in the harami cross.
Concept family
Chart & Candlestick Patterns
84 concepts mapped · 84 in the Library
Harami FAQ
Turn Harami into a trading strategy.
Take the implementation from this page into Quant, then build on it, backtest it on real data, and keep refining it in conversation.