Concept
Inverted Hammer
Inverted Hammer is a Chart & Candlestick Patterns concept. The Library holds 1 implementation, a working definition you can pull into Quant.
Top Inverted Hammer indicator
The top custom implementation, built on the original standard Inverted Hammer formula.
1 total
Want to trade Inverted Hammer? The implementation below is one prompt away from a backtested strategy in Quant.
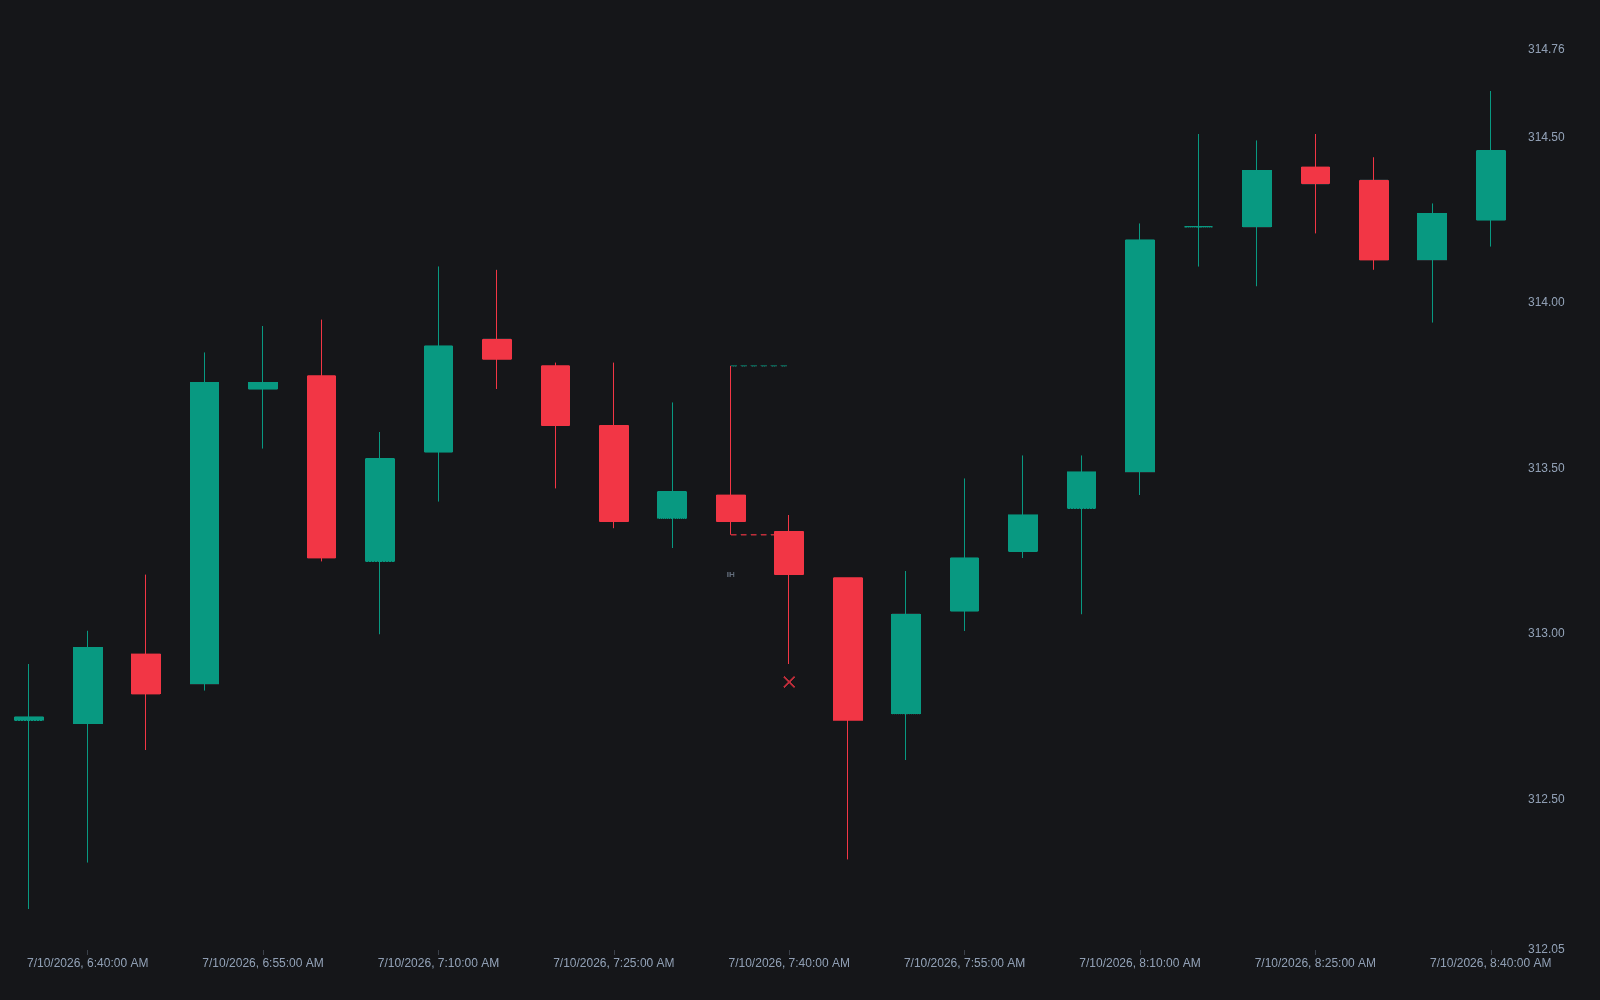
What is an Inverted Hammer?
An inverted hammer is a single-candle bottom-reversal candidate: after a decline, a bar with a small real body at the lower end of its range, an upper shadow commonly at least twice the body's height, and little or no lower shadow. The shape records a bar in which buyers drove price sharply higher and could not hold the gains into the close. Body color is secondary, with a bullish close marginally preferred.
Like the rest of the candlestick patterns canon, the inverted hammer descends from Japanese rice-market charting and reached Western traders largely through Steve Nison, whose 1991 book Japanese Candlestick Charting Techniques catalogued the classic formations. Nison's treatment already carried the two rules that still govern the pattern: it exists only after a decline and asks the next session for confirmation.
The reading is counterintuitive: despite the failed intraday rally, the candle is treated as tentatively bullish because the attempt appears after sustained selling, a hint that demand has started to probe. Location is everything. The identical shape after an advance is a shooting star, a bearish candidate, and the hammer is its lower-shadow counterpart at bottoms. Because the bar itself closes weak, standard practice waits for confirmation, such as a bullish close or a gap higher on the next candle, before acting.
Mechanically, the long upper shadow records an intrabar rally that met supply; the information is that buyers could mount the attempt after persistent selling. One common gloss adds that the probe forces recent shorts to confront their risk, seeding the covering that confirmation then reveals. Because the close gives back the rally, references rank it among the weaker single-bar signals when unconfirmed, and its confirmed form often overlaps stronger structures: with a gap down before it and a strong close after, the three bars approximate a morning star.
How to identify an Inverted Hammer
Shape alone is not enough; the candle only qualifies in the right location. Check in order.
- 1Confirm the context: a downtrend or clear multi-bar decline into the candle. Without prior selling there is nothing to reverse.
- 2Check proportions: a small real body near the low of the bar, an upper shadow at least roughly twice the body, and a minimal lower shadow. Color is secondary.
- 3Distinguish the twin: the same shape appearing after an advance is a shooting star, not an inverted hammer.
- 4Require confirmation: a bullish close or gap up on the following candle; many traders act only once price trades above the inverted hammer's high.
- 5Weigh the surroundings: a print at prior demand, a double bottom retest, or on elevated volume outweighs the same candle mid-range.
How traders use it
- As a reversal trigger with confirmation: entries above the candle's high or on the next bullish close, stop below the pattern low, ideally where the candle prints into mapped support.
- As a context filter: instances after extended declines or into demand areas are taken seriously; the same candle mid-range is usually ignored as noise.
- Graded by volume: some practitioners weight inverted hammers printed on elevated volume more heavily, reading the failed rally as active two-way interest rather than drift.
- As the seed of two-bar logic: the confirming candle often turns the pair into a two-bar reversal or bullish engulfing pattern, and many traders treat that combined structure, not the lone wick, as the signal.
- As a warning for shorts: traders pressing a decline read an inverted hammer as early evidence the low is being probed, tightening stops or banking profit even without any intention of trading the reversal.
Inverted Hammer vs related candles
Hammer: Both are single-bar bottom candidates; the hammer's long shadow points down and it closes near its high, while the inverted hammer's shadow points up and it closes weak. The hammer is generally treated as the more direct signal; the inverted hammer leans harder on next-bar confirmation.
Pin Bar: The pin bar is the generalized rejection candle: a long tail that probes a level and snaps back. A bullish pin bar at a low rejects lower prices with a long lower tail; the inverted hammer's upper tail instead records a failed probe higher, which is why it leans on confirmation where a tail-into-support pin bar often stands alone.
Doji: A gravestone-style doji shares the long upper shadow but has essentially no body, and doji are read primarily as indecision. The inverted hammer keeps a small but real body and a directional story tied to the prior decline, so it makes a bolder claim, with the pattern low as defined invalidation.
Concept family
Chart & Candlestick Patterns
84 concepts mapped · 84 in the Library
Inverted Hammer FAQ
Turn Inverted Hammer into a trading strategy.
Take the implementation from this page into Quant, then build on it, backtest it on real data, and keep refining it in conversation.