Data Preprocessing for Algo Trading
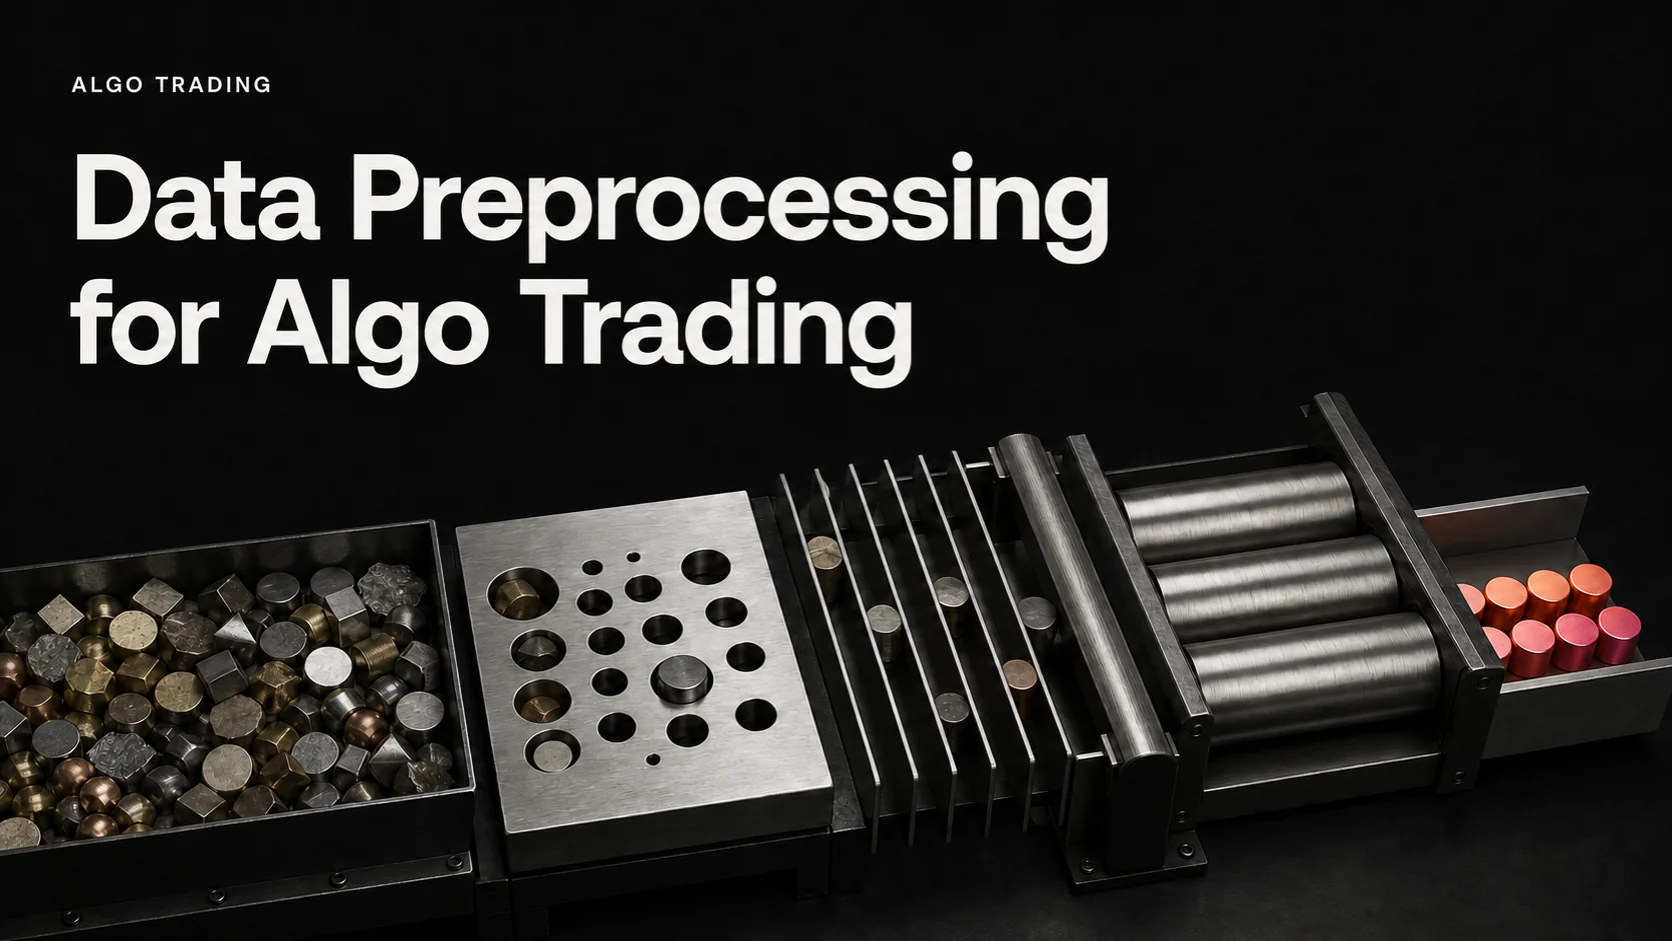
Data preprocessing for algo trading turns raw observations into consistent, time-aware inputs for strategy research. It includes checking data sources, resolving errors, handling missing observations, transforming variables and building features. The goal is a reproducible test using information that was available at each decision point; preprocessing cannot guarantee accurate forecasts or profitable trades.
A clean-looking dataset can still produce a misleading backtest. A revised economic figure joined to an earlier date, a scaler fitted on the entire history or a genuine market shock deleted as an “outlier” can all change the apparent result. Preserve the original data and document every transformation so the research can be checked.
- Collect: define the instrument, venue, timestamp, session, price basis and source rights.
- Validate: identify missing, duplicate, stale and inconsistent records before calculating signals.
- Transform: use a method appropriate to the model and fit learned settings on training data only.
- Build features: respect indicator warm-up and the time each input became available.
- Evaluate: keep chronological test periods separate, include trading costs and reproduce the same pipeline in subsequent use.
Start with a Data Specification
Choose data for the question being tested. A daily trend hypothesis may use completed OHLCV candles; a quote-sensitive execution model needs information about bids, asks and timing that daily candles cannot supply. News and fundamentals require publication or availability timestamps, not just the period they describe.
Potential sources include exchanges, brokers, market-data vendors and research databases. Bloomberg Terminal, LSEG Workspace, FactSet and CRSP through WRDS are examples to investigate alongside retail charting and broker feeds. Compare the exact dataset and entitlement rather than assuming a brand name means complete coverage or permission to redistribute it.
| Data field | What to establish | Why it matters |
|---|---|---|
| Instrument identity | Stable identifier, venue, currency and historical symbol changes | A ticker alone may join different instruments or miss delisted securities |
| Time | Event time, receipt or availability time, UTC offset and session calendar | Data must be usable at the simulated decision time |
| Prices and volume | Trade versus quote data, adjustment basis, units and precision | Mixing definitions changes returns, indicators and fill assumptions |
| History | Coverage dates, revisions, corporate actions and universe membership | A current constituent list or revised series can bias a historical test |
Store an immutable raw copy with retrieval date, source, schema and a version or checksum. Keep transformed outputs separate. For equity-universe research, establish whether delisted instruments and historical membership are included; selecting only today’s survivors can make the past look easier than it was.
Clean Errors Without Erasing Market Risk
Diagnose missing observations first
A missing candle may represent a market closure, a halt, an illiquid interval, an unavailable field or a collection failure. Those cases need different treatment. Compare the timestamps against the appropriate trading calendar and provider conventions before inventing a regular sequence of prices.
The pandas missing-data guide documents forward fill, backward fill and interpolation. These are computational options, not evidence that a replacement value was observable or tradable. A backward fill or interpolation using a later observation can introduce future information into an earlier trading decision.
Forward fill uses an earlier observation, but it can make stale data look fresh. Set a justified age limit, retain a missingness or staleness flag and distinguish a carried value used for a feature from an executable market price. Do not fill gaps across instruments, sessions or corporate-action boundaries without an explicit reason.
Multiple imputation can represent uncertainty under a specified missing-data model, but it is not a default repair for absent trades or quotes. Fit any learned imputation process within the training fold and assess its assumptions. For some records, excluding the affected decision or pausing the strategy is more defensible than manufacturing an input.
Investigate outliers and conflicting records
Check suspicious observations against source records and, where available, an independent feed. Duplicate instrument–timestamp keys, impossible OHLC relationships, inconsistent units and abrupt changes in adjustment basis deserve investigation. Resolve conflicting duplicates using a documented source policy, not whichever row happens to appear last.
A large return is not automatically a bad tick. Genuine crashes, gaps and liquidity shocks are part of the risk a strategy must face. Use statistical flags to select records for review; deleting every high Z-score can remove the very losses the test should measure. Preserve corrections and compare reasonable treatment choices without choosing solely for a better backtest.
Make checks instrument-aware. Negative prices are not universally impossible across all contracts and history, and volume units differ between markets. Record the applicable constraints in the data specification instead of applying stock-specific assumptions to every series.
Standardize Time, Units and Price Basis
Use timezone-aware timestamps, preserve the original timezone and normalize comparisons consistently, often in UTC. Keep the exchange session calendar separately: a UTC timestamp alone does not identify regular trading hours, daylight-saving transitions or an overnight futures session. Define whether a bar timestamp labels its start or its end.
Match prices and volume to the intended analysis. A stock split can create an apparent raw-price jump without the same economic loss to an existing holder. Dividend-adjusted or total-return series answer different questions from unadjusted execution prices. Keep the adjustment method explicit and use consistent data for indicators, returns and the order simulation.
Split example: a hypothetical 2-for-1 split changes a $100 share into two $50 shares. Treating the raw $100-to-$50 move as a 50% trading loss ignores the doubled share count. Conversely, an adjusted historical chart does not imply orders could have executed at its adjusted prices.
Store precision appropriate to tick size and the instrument rather than forcing every price to four decimal places. Do not assume every volume field is an integer share count; fractional quantities and contract-specific units may apply. Use stable column names, explicit types and a clear policy for missing versus zero values.
Join external information by availability
The pandas merge_asof documentation describes backward, forward and nearest matches on sorted keys. For historical decisions, a backward match can select a record whose availability time is no later than the decision. Group by the relevant instrument and set a tolerance to reject information that is too old.
A backward join only protects the timestamp you supplied. Joining a revised economic value using its original observation date still leaks information if that version was released later. Preserve release vintages and account for publication and processing delays. A nearest match can select a future record, so it is not automatically suitable for a causal trading feature.
Timing example: an announcement available at 10:05 cannot inform a 10:00 decision, even if it describes the previous month. A 10:10 decision may use it if the system had received and processed it by then. This timing check matters more than whether both rows share the same calendar date.
Choose Scaling for the Model
Scaling changes the numerical representation of a feature. It does not repair a bad source, establish stationarity or create predictive information. Some distance-based methods, regularized models and neural networks are sensitive to scale; many tree-based methods are less sensitive. Check the actual estimator rather than scaling every column by habit.
The scikit-learn preprocessing guide distinguishes mean-and-variance scaling, min-max scaling and robust approaches. Standardization centers and rescales values; it does not require the observations to be Gaussian or turn an arbitrary distribution into a Gaussian one.
| Method | Transformation | Important limit |
|---|---|---|
| Standardization | Subtract the training mean and divide by the training standard deviation | Sensitive to extreme values; constant features need defined handling |
| Min-max scaling | Use training minimum and maximum to map that sample into a chosen interval | Later observations can fall outside the training interval; known theoretical bounds are not required |
| Robust scaling | Use a training median and an interquartile-range scale | Reduces sensitivity of fitted scale to extremes; does not remove outliers or guarantee better results |
For a naturally bounded indicator such as RSI on a 0–100 scale, dividing by 100 is a fixed unit conversion. It differs from learning the minimum and maximum observed in a training sample. Confirm the indicator’s actual implementation and units before applying either transformation.
Min-max example: if training values span 10 to 30, a value of 20 maps to (20 − 10) ÷ (30 − 10) = 0.5. A later value of 40 maps to 1.5 using those same fitted limits. Expanding the limits after seeing the test value changes the transformation; clipping it to 1 discards the magnitude of the exceedance. Either adaptation needs a predefined, evaluated policy.
Keep fitting inside the training process
The scikit-learn leakage guidance recommends learning preprocessing from training data and applying the fitted transformation to later data. This applies to scaling, imputation, dimensionality reduction and feature selection. A pipeline can help keep those operations inside each cross-validation fit.
Choose chronological splits for the trading problem; a pipeline does not make random time-series splitting appropriate. Save the fitted transformation with the model so subsequent inputs receive the same treatment. If using rolling or expanding estimates, specify when they update and ensure each historical estimate uses only information available at that point.
Unit scaling and time-series modeling are separate decisions. Differencing or returns may help with some nonstationary series, while an augmented Dickey–Fuller test examines a unit-root hypothesis under its chosen settings. ACF and PACF plots can inform certain time-series models; neither they nor a stationarity test select a universally correct scaler or certify a tradable forecast.
Create Features with Explicit Timing
Features can describe trend, momentum, volatility, volume, calendar effects or economic conditions. Begin with a small set tied to a hypothesis. More indicators can increase redundancy and the number of opportunities to select an attractive historical accident.
Define indicators and warm-up
Specify the input series, period, initialization and missing-data behavior for each indicator. A 50-period SMA is an equal-weight average of its window; an EMA weights observations differently and depends on its initialization convention. A 50/200 crossover is a hypothesis to test, not a generally superior combination or proof that a particular moving average will act as support.
RSI above 70 and below 30 are conventional reference levels. They are not automatic reversal guarantees or universally suitable entry and exit rules. Test the role of the indicator in the complete strategy, including the market regime, order timing and costs. Adding volume confirmation creates another condition that also requires evaluation.
Allow sufficient history before evaluating a signal. A feature calculated from a completed daily close cannot generally justify a fill earlier in that day. Define the first permissible execution after the feature is available, including practical latency and the available order types.
Avoid hindsight in custom features
Session patterns, market structure and price-action conditions can be encoded as features, but the algorithm must respect when each condition becomes known. A pivot plotted on an earlier bar may require later bars for confirmation. Using the plotted location as its original availability time introduces hindsight.
For a forecast target spanning future bars, store the target’s end time separately from feature availability. Do not accidentally leave future returns, target labels or retrospectively revised classifications among the predictors. Lagging one column is not a blanket fix for all leakage sources.
Select and encode within validation
Inspect correlations and remove unnecessary duplication using training data. Fit category encoders and feature selection within the training fold, define how unseen categories are handled and keep the feature order stable. One-hot encoding is one option for nominal categories; it is not a mandatory representation for every trading signal.
Evaluate feature additions against the same baseline and chronological process. Track how many combinations were tried, use validation periods for selection and reserve a final evaluation period. A feature chosen after inspecting the final test is no longer independently tested by that period.
Prepare Chronological Model Tests
An expanding window grows the training history before each later evaluation. A sliding window retains a specified recent training span. Either can be useful, but the choice and retraining schedule should reflect the problem rather than whichever produces the highest retrospective score.
The TimeSeriesSplit documentation describes ordered splits, optional gaps and a maximum training size. Equally spaced samples support comparable time spans in its test folds; irregular trading records may need a calendar-aware custom splitter.
Size any separation between training and evaluation around target overlap, availability delays and the intended experiment. Remove training labels that extend into a reserved evaluation interval. Historical observations used to warm up a causal indicator are not automatically forbidden merely because they precede the test boundary; the important distinction is whether future information enters fitting or decisions.
Evaluate prediction quality separately from trading performance. Compare suitable baselines and account for fees, spread, slippage, turnover and position sizing when converting forecasts to a strategy. A low forecast error does not establish profitable execution, and errors measured on different targets or price scales are not directly comparable.
The Ljung–Box diagnostic tests residual autocorrelation at selected lags. Its interpretation depends on lag choice, sample size and fitted-model degrees of freedom. Failing to reject autocorrelation tests does not prove complete independence, clean preprocessing or future profitability; use the diagnostic alongside other checks.
Use LuxAlgo to Inspect the Trading Hypothesis
Begin with LuxAlgo’s native charts and documented data coverage to inspect the instrument, session and timeframe behind a hypothesis. Data coverage and aggregation matter: do not assume every displayed dataset represents a consolidated market feed or raw trade-by-trade history.
Ask Quant, our coding agent to implement a defined rule for the native chart environment. Inspect the generated code and run it yourself. Review indicator warm-up, completed-bar timing, missing-data behavior and plotted orders instead of treating generated code as validated logic.
Example prompt: “Implement this completed-bar crossover hypothesis for the selected chart. Explain the required history, when each feature is available and the earliest simulated order time. Identify unsupported data assumptions and missing inputs. Keep the code inspectable and do not invent backtest results.”
Use native strategy testing with standard candles, realistic cost assumptions and separate development and evaluation periods. Native chart research is one part of the workflow; an external Python dataset still needs its own preprocessing, source rights and reproducible validation.
Review compatible recorded trades in the native LuxAlgo journal alongside the data version and test notes. Reconcile execution records with the actual broker or venue rather than assuming a chart signal and an executed trade are identical.

Neither Quant nor a Library tool guarantees that an external dataset has been cleaned correctly. Check current plans for access and explore the Library for study ideas.
Build a Repeatable Processing Workflow
Pandas provides tabular operations for cleaning, grouping, joining and time-based processing; NumPy supports numerical array work. TA-Lib implements technical indicators and pattern recognition with a core library and language wrappers. Verify the particular function’s inputs, output alignment and warm-up behavior against the installed version.
Zipline-reloaded is an event-driven backtesting system. Its historical association with Quantopian’s live-trading engine should not be read as a promise that a current installation includes a ready broker connection. Validate data bundles, calendars, dependencies and execution assumptions for the intended setup.
- Ingest: preserve raw records, retrieval details and the expected schema.
- Validate: check coverage, identity, timestamps, duplicate keys and instrument-specific constraints.
- Transform: apply documented corrections and training-fitted preprocessing without overwriting the raw copy.
- Test: reproduce feature values at selected timestamps and compare results under realistic assumptions.
- Monitor: detect stale inputs, schema changes, feature drift and differences between historical and current processing.
Automate repeated checks and cache deterministic intermediate outputs using data and configuration versions. This can save processing time without skipping validation. Log rejected records and stop or isolate affected workflows when an essential input fails, rather than silently changing the data to keep a job running.
Useful checks include a known split event, a missing interval, a duplicate timestamp, an announcement released after a decision, an indicator warm-up boundary and a test value beyond a scaler’s training limits. Compare expected feature values and timestamps, not only whether the program completed without an error.
Monitor changes without repeatedly tuning on the final test. When a provider revises history or a preprocessing policy changes, version the update and rerun the relevant comparisons. Better documentation and fewer avoidable errors make results easier to assess; they do not guarantee an improved Sharpe ratio or a fixed increase in profitability.
Original Pandas Data-Cleaning Tutorial
This CodeTrading tutorial, published March 31, 2022, introduces loading and cleaning financial data with pandas. Treat it as a dated walkthrough: check current library behavior and apply the timing, missing-data and validation safeguards above to your own dataset. A cleaned tutorial file is not evidence of a profitable trading strategy.
Frequently Asked Questions
Does standardization require normally distributed trading data?
No. Standardization centers and rescales a feature using its fitted mean and standard deviation. It does not require a Gaussian input or make the output Gaussian. Its usefulness depends on the model and data.
Should missing market prices be forward-filled?
Not automatically. Determine why the observation is missing and whether a carried value is appropriate for that feature. Limit staleness, retain missingness information and do not treat an imputed value as an executable price.
Can I fit a scaler before splitting the dataset?
Learn scaler parameters from the training subset within each evaluation fold. Apply that fitted transformation to validation and test inputs. Fitting on the full history can leak information from the reserved periods.
Should large returns be removed as outliers?
Investigate them first. Correct verified data errors using a documented policy, but retain genuine market shocks in risk evaluation. Deleting extreme observations solely because they worsen results biases the test.
Does LuxAlgo replace an external data-preprocessing pipeline?
Quant Charts and Quant support chart research, code development and strategy testing. An external dataset still needs its own source, timing and transformation checks.
Read next