Donchian Channels: Breakout and Trend-Following Strategy
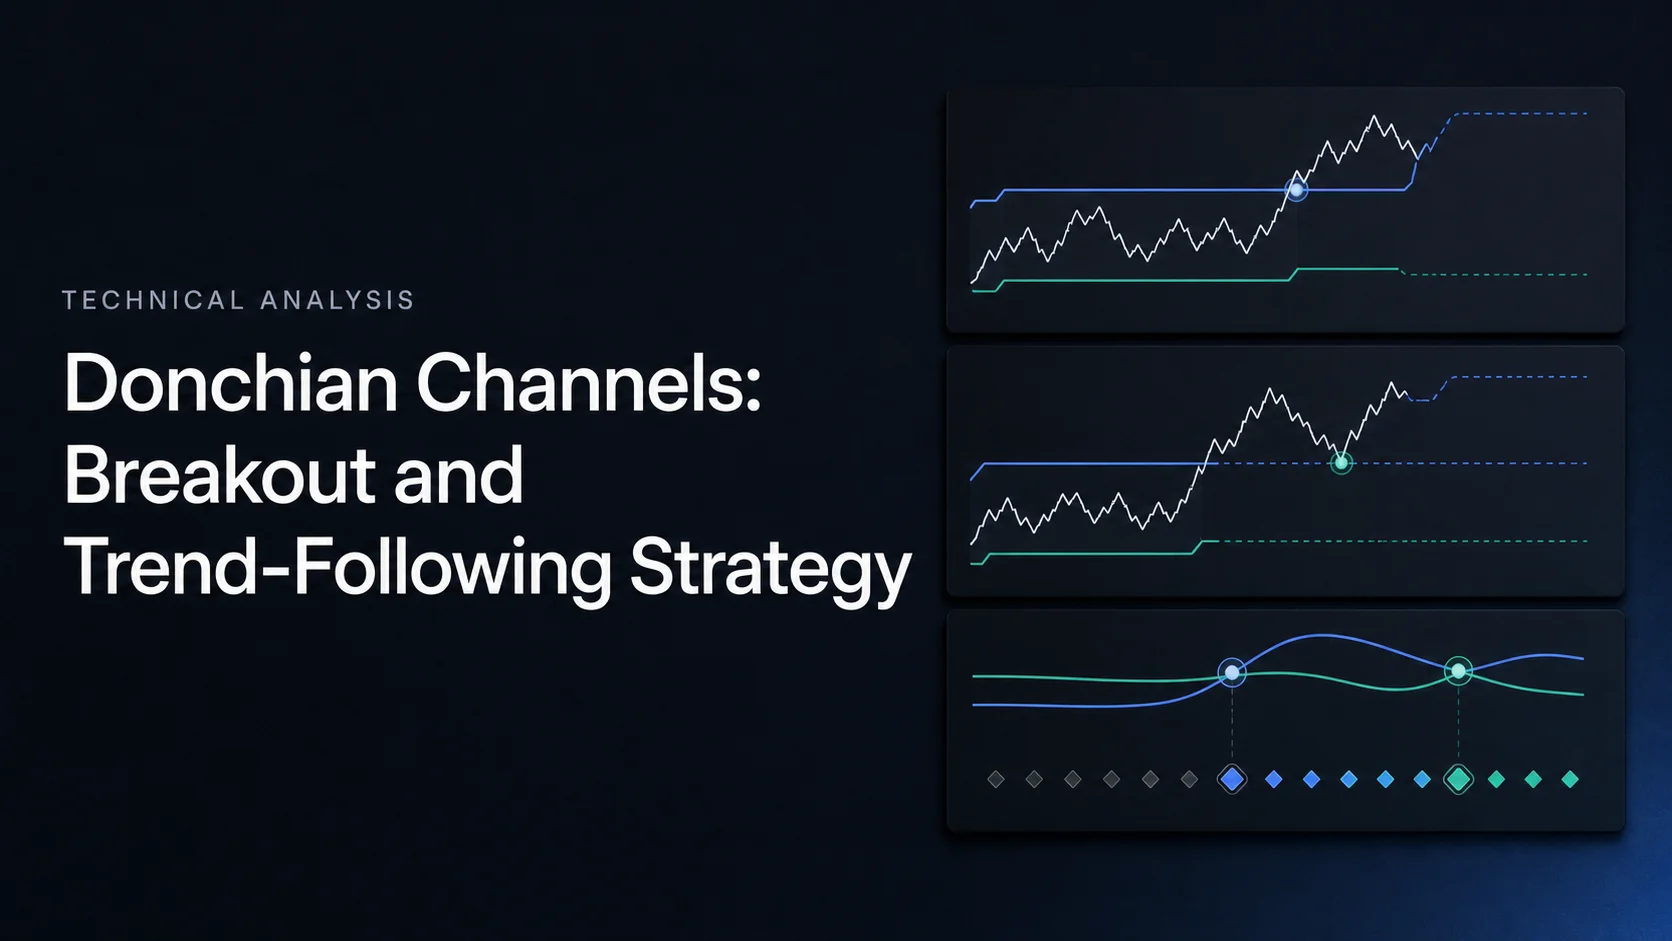
Donchian Channels plot the highest high and the lowest low of the last N bars, with a middle line halfway between them. There is no averaging and no volatility formula: the upper band is simply the level a bar must exceed to print a new N-bar high, which is why the channel is the natural chart object for breakout and trend-following rules. Richard Donchian’s four-week rule, which bought new four-week highs and sold new four-week lows, is the same idea with N set to 20 trading days.
- Upper band: highest high of the lookback window.
- Lower band: lowest low of the same window.
- Middle line: the average of the two bands.
Key takeaways:
- A close above the prior bar’s upper band is, by definition, a fresh N-bar high; a close below the prior lower band is a fresh N-bar low. Those events are the classic breakout triggers.
- The distance between the bands is the range price has traveled inside the window. A narrow channel means recent bars have stayed inside a tight span; a wide channel means at least one large move sits inside the window.
- The middle line is a reference level for pullbacks and a fade target inside flat channels. It is not a guaranteed support or resistance level.
How to use Donchian Channels:
- Breakout entries: go long on a break of the N-bar high and short on a break of the N-bar low, with a defined exit and a defined trigger (close or intrabar touch).
- Trend-following: hold while the bands step in the trend’s direction and trail the exit on the opposite band of a shorter window; the Turtle traders paired 20-bar entries with 10-bar exits.
- Volatility context: compare the channel’s width with its own history to tell compression from expansion before deciding how much a breakout should be trusted.
Twenty bars is the traditional default, 55 suits slower systems and 10 is common for exits. The right length depends on holding horizon and on how many false breaks you are prepared to absorb, and it should be tested rather than assumed.
Risk management: size each position from the distance between entry and the exit level, cap planned risk at a fixed fraction of capital, and expect a breakout system to lose more often than it wins. Its results come from a minority of large trends.
TradingView ships Donchian Channels as a built-in study. The LuxAlgo Library provides native Donchian Channels, Donchian Trend Rules, Donchian Width and Donchian MA Bands, each of which opens on Quant Charts in one click. To turn a rule into a backtest, ask Quant, our coding agent, to help implement it, inspect the Code and click Run.
How to Use Donchian Channels for Trading
Earn2Trade published this tutorial in April 2021. It covers the construction and the common breakout and pullback readings. Treat any example trades as illustrations of the rules rather than evidence about their results.
Setting Up and Reading Donchian Channels
Adding the indicator takes a minute on either platform. Reading it well requires knowing one detail of the construction: whether the current bar is part of the window.
How to Add Donchian Channels to Your Chart
On TradingView, open the chart, click Indicators and search for “Donchian”. The built-in Donchian Channels study has two inputs: Length, which defaults to 20, and Offset, which defaults to 0 and shifts the plotted channel forward or backward. Style options control the band colors, the middle line and an optional fill.
On Quant Charts, open the Donchian Channels page in the LuxAlgo Library and click Open on Quant Charts. This is the standard build with a single Length input, default 20. It plots the upper and lower bands with a light fill and the middle line as circles, and it includes Breakout Up and Breakout Down alert conditions.
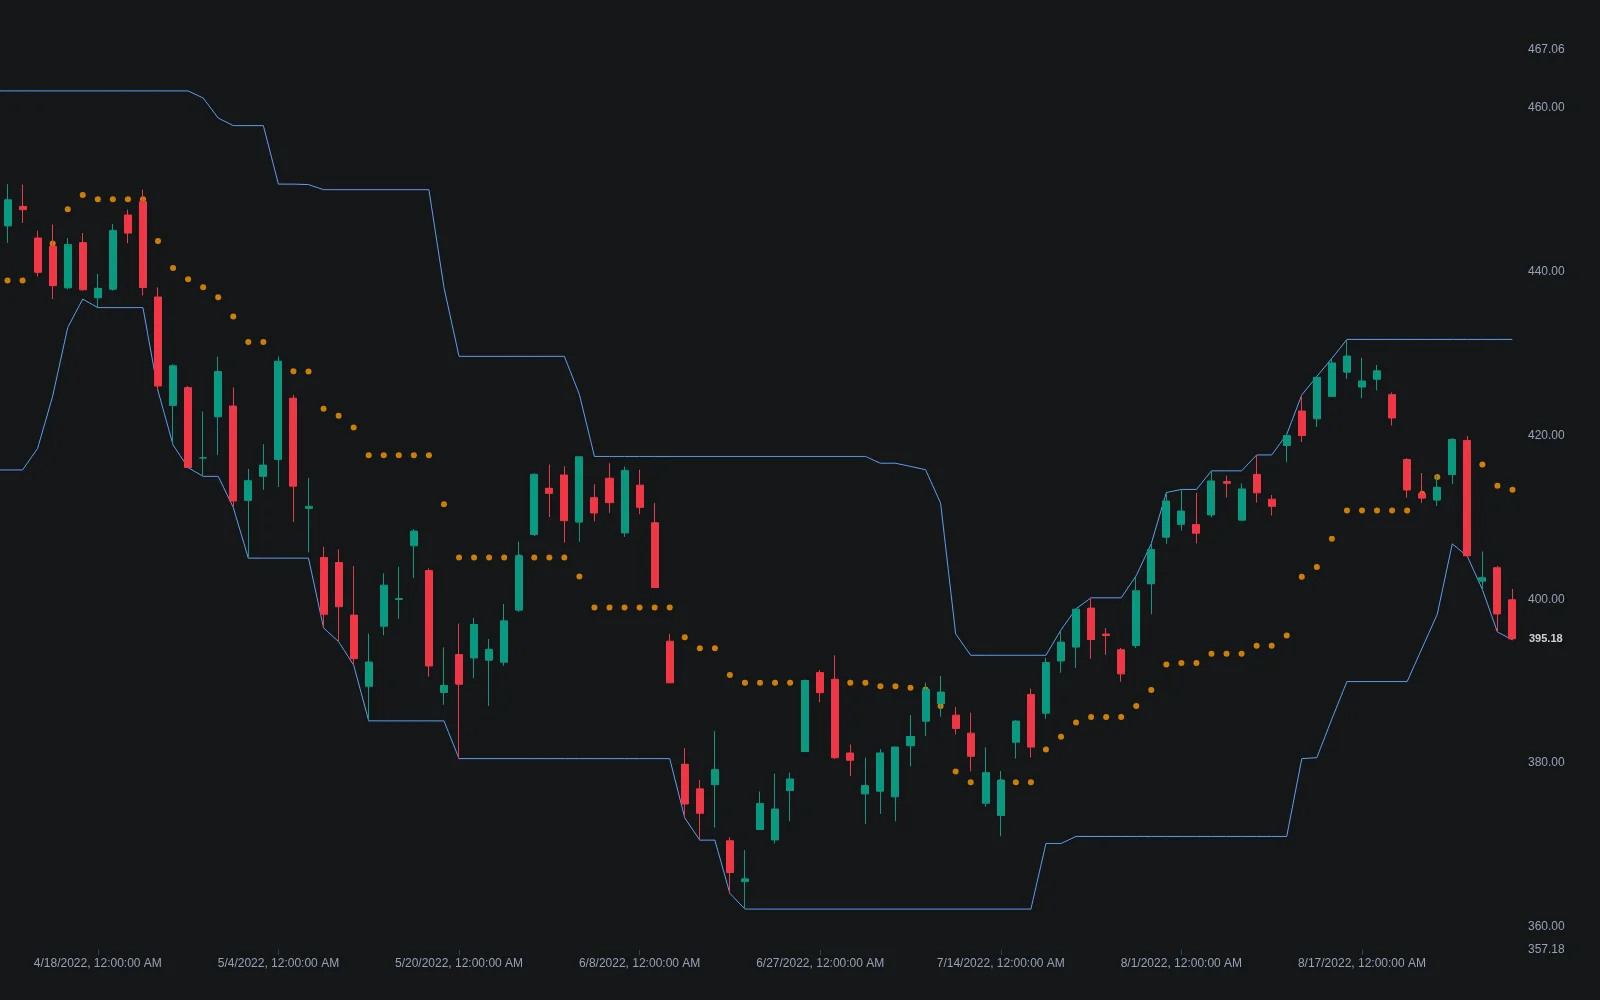
In this build the current bar is included in the window, so price can never poke outside its own channel while the bar is forming: the moment a new high prints, the upper band moves up with it. Breakouts are therefore judged against the previous bar’s bands, which is how the alerts are evaluated. Other implementations exclude the current bar so that a push through the band is exactly a new extreme. Both conventions are valid; know which one your chart uses before comparing signals.
Reading Donchian Channel Signals
- Breakouts: a close above the prior upper band is a new N-bar high and a close below the prior lower band is a new N-bar low. That is all a breakout means. Whether it continues is a separate question the indicator does not answer.
- Width: the span between the bands is the range price covered inside the window. It jumps when a large bar prints and decays only when that extreme ages out, so a wide reading can persist long after the move that created it.
- Staircase: bands stepping one way while price rides that band is the visual footprint of a persistent trend. Both bands flat means no new extremes on either side, a range with objectively marked boundaries.
- Middle line: in a trend, pullbacks often pause near it; inside a flat channel it is the midpoint of the range. Treat a touch as a place to look for a decision, not as a decision.
Traders often call a narrowing channel a squeeze. Compression means recent bars have stayed inside a small span; it does not say which way the next expansion will go, nor when. The range expansion and contraction concept explains why quiet stretches often precede wide bars, and why the first break out of a coil is frequently the false one.
Selecting the Right Period Length
The length sets how many bars the window covers. A shorter length produces closer bands, earlier signals and more whipsaws; a longer length demands rarer extremes and gives back more at exits. Systematic trend followers historically ran a longer channel for entries and a shorter one for exits.
| Length | Common role | Trade-off |
|---|---|---|
| 10 | Exit channel in 20/10 systems; fast intraday reference | Protects open profit but exits on ordinary pullbacks |
| 20 | Classic default; the four-week rule on daily bars | Balanced reference, still prone to false breaks in ranges |
| 55 | Entry channel in slower 55/20 systems | Fewer, later entries; larger initial risk per trade |
| 100 or more | Position-trading context on daily or weekly charts | Very few signals; long waits between them |
Length counts bars, not time. A 20-bar channel on a five-minute chart covers under two hours; on a weekly chart it covers about five months. Decide the horizon first, then choose the interval and the length together, and test the pair on the market you trade rather than importing a setting from another one.
Breakout Trading with Donchian Channels
A Donchian breakout system is a complete set of rules: an entry channel, an exit channel, a trigger definition, a direction mode and a sizing rule. Leaving any part vague makes the results impossible to reproduce.
How to Trade Breakouts with Donchian Channels
The base rule is to go long when price breaks above the entry channel’s upper band and short when it breaks below the lower band. Two details change the results materially. First, the trigger: a close beyond the band ignores wicks, while an intrabar touch fires as soon as the high or low penetrates it. Second, the reference: channels built from prior bars only mean a bar never breaks a level it is itself creating.
Some traders enter on the breakout bar and others wait for a pullback to the breakout level, which can improve the entry price at the cost of missing moves that never pull back. A weekly channel breakout aligned with a daily one is a common filter; so is requiring a momentum reading such as RSI to rise with the break. Each filter is a hypothesis: it reduces trades, and only a test shows whether the remaining trades are better.
Breakouts from compressed channels tend to attract attention because the initial risk, measured to the opposite band, is smaller. That is a statement about position size, not about the odds of follow-through. Low volume on the breakout bar is often cited as a warning sign; treat that as a filter to test on your market, not as a rule that holds everywhere.
Risk Management for Breakout Trades
The exit channel supplies the initial stop and the trailing exit in one object. For a long, the exit level is the lowest low of the exit window; it rises as the trend makes higher lows and never falls, so it locks in progress without a discretionary decision. Position size then follows from the distance between entry and that level.
Consider a hypothetical stock whose prior 20-day high is $84.00 and prior 10-day low is $79.20. It closes at $84.60, a close-trigger breakout. A $25,000 account with a 1% risk budget has $250 to risk. See Risking It Right for the budgeting logic.
| Scenario | Calculation | Outcome before costs |
|---|---|---|
| Initial position | $84.60 − $79.20 = $5.40 risk per share; $250 ÷ $5.40, rounded down | 46 shares; $248.40 planned risk; $3,891.60 notional |
| Trend develops, 10-day low rises to $90.10 | Exit level now above entry; 46 × ($90.10 − $84.60) | $253 locked in if the exit is hit, about 1.0R |
| Whipsaw: close at $78.90 the next week | 46 × ($84.60 − $78.90) | $262.20 loss, about 1.06R because the exit level is not a guaranteed fill |
| Gap through the exit, fill at $77.50 | 46 × ($84.60 − $77.50) | $326.60 loss, about 1.31R |
| Slower 55/20 system: entry $86.50, 20-day low $76.00 | $10.50 risk per share; $250 ÷ $10.50 | 23 shares for the same budget; fewer trades, wider stop |
Breakout systems typically win well under half the time. With a 40% win rate, an average winner of 2.2R and an average loser of 1R, expectancy is 0.4 × 2.2 − 0.6 × 1 = +0.28R per trade before costs. At a 35% win rate and a 1.5R average winner it is −0.125R. The average winner, not the hit rate, decides whether the system pays, and the exit rule is what determines the average winner.
Keep the same fixed fraction of capital at risk on every trade and rebuild the share count from the actual entry and exit levels each time. Partial exits at a fixed multiple reduce the size of the winners that the system depends on; if you use them, include them in the backtest rather than adding them by hand.
Breakout Strategy Pros and Cons
| Advantages | Disadvantages |
|---|---|
| Mechanical entries: a new N-bar extreme is unambiguous | False breakouts: many new extremes reverse inside the channel |
| Never misses a large trend: every major move begins with a new high or low | Whipsaws in ranges: flat channels produce repeated small losses |
| Built-in exit: the opposite band of a shorter window trails the position | Late entries and give-back: entry after the move has started and exit after it has turned |
| Works on any interval: the construction is the same on all bars | Low win rate: results depend on a few large winners, which is hard to sit through |
| Easy to test: every rule can be written down and run | Parameter sensitivity: results change with length, trigger and market |
The strategy earns its keep in extended trends and pays for that in ranges. Reducing size or standing aside when the channel has been flat for a long time is a common adjustment, and like every other adjustment it belongs in the test rather than in the moment.
Trend-Following with Donchian Channels
Trend-following with a Donchian channel means staying in a position while the bands keep stepping in your direction and leaving when the exit channel is broken. Patience is the whole method; the indicator just makes the exit objective.
Spotting Trends with Donchian Channels
In an uptrend the upper band ratchets higher as new highs print, the lower band follows once earlier lows leave the window, and price spends most of its time in the upper half of the channel. A downtrend is the mirror image. When both bands stop moving, no new extremes are being made and the market is ranging between marked boundaries.
The middle line is a convenient half-way marker for that reading: price mostly above it during an uptrend, mostly below during a downtrend, crossing it repeatedly in a range. These are descriptions of what has happened in the window, not forecasts, and a trend can end without any warning from the channel itself.
Entering Trades on Pullbacks
Breakout entries buy strength; pullback entries wait for a retreat toward the middle line or the breakout level and enter when price turns back in the trend’s direction. The stop can sit below the pullback low or at the exit channel, whichever the rule specifies. The trade-off is that strong trends may not pull back, so the method misses some of the best moves in exchange for better entry prices on the rest.
Define the confirmation in advance: a close back above the middle line, a bar that closes above the previous bar’s high, or a fixed number of bars of holding. Vague confirmation invites hindsight. A pullback that reaches the opposite band is no longer a pullback by the channel’s own definition; it is a new extreme in the other direction, and the trend-following rule says exit.
Using Volatility to Read Trend Conditions
Channel width is a volatility series with a memory equal to the window length. The Donchian Width indicator plots that span, normalized to the channel midline by default so readings compare across markets, and ranks it against its own last 100 bars. Readings at or below the 20th percentile are shaded as compression; readings at or above the 80th percentile mark stretched, late-trend conditions. A slow 55-bar width can be overlaid on the 20-bar reading.
The useful reading is contextual. A breakout from compression carries a smaller initial risk and often more follow-through if the market has genuinely been coiling, but the first break can still fail. A breakout when width is already extreme adds to a move that has already traveled far, with a wider stop and worse initial risk. Neither reading predicts a reversal date; claims that width divergences lead reversals by weeks or months are not something the indicator can establish.
Improving Donchian Channel Strategies with LuxAlgo Tools
The Library’s Donchian family separates the geometry from the system. The standard channel draws the levels, Donchian Trend Rules trades them, Donchian Width measures them and Donchian MA Bands applies the same logic to moving averages. All four are native Quant Charts tools with published source code.
Adding LuxAlgo Tools to Donchian Channel Strategies
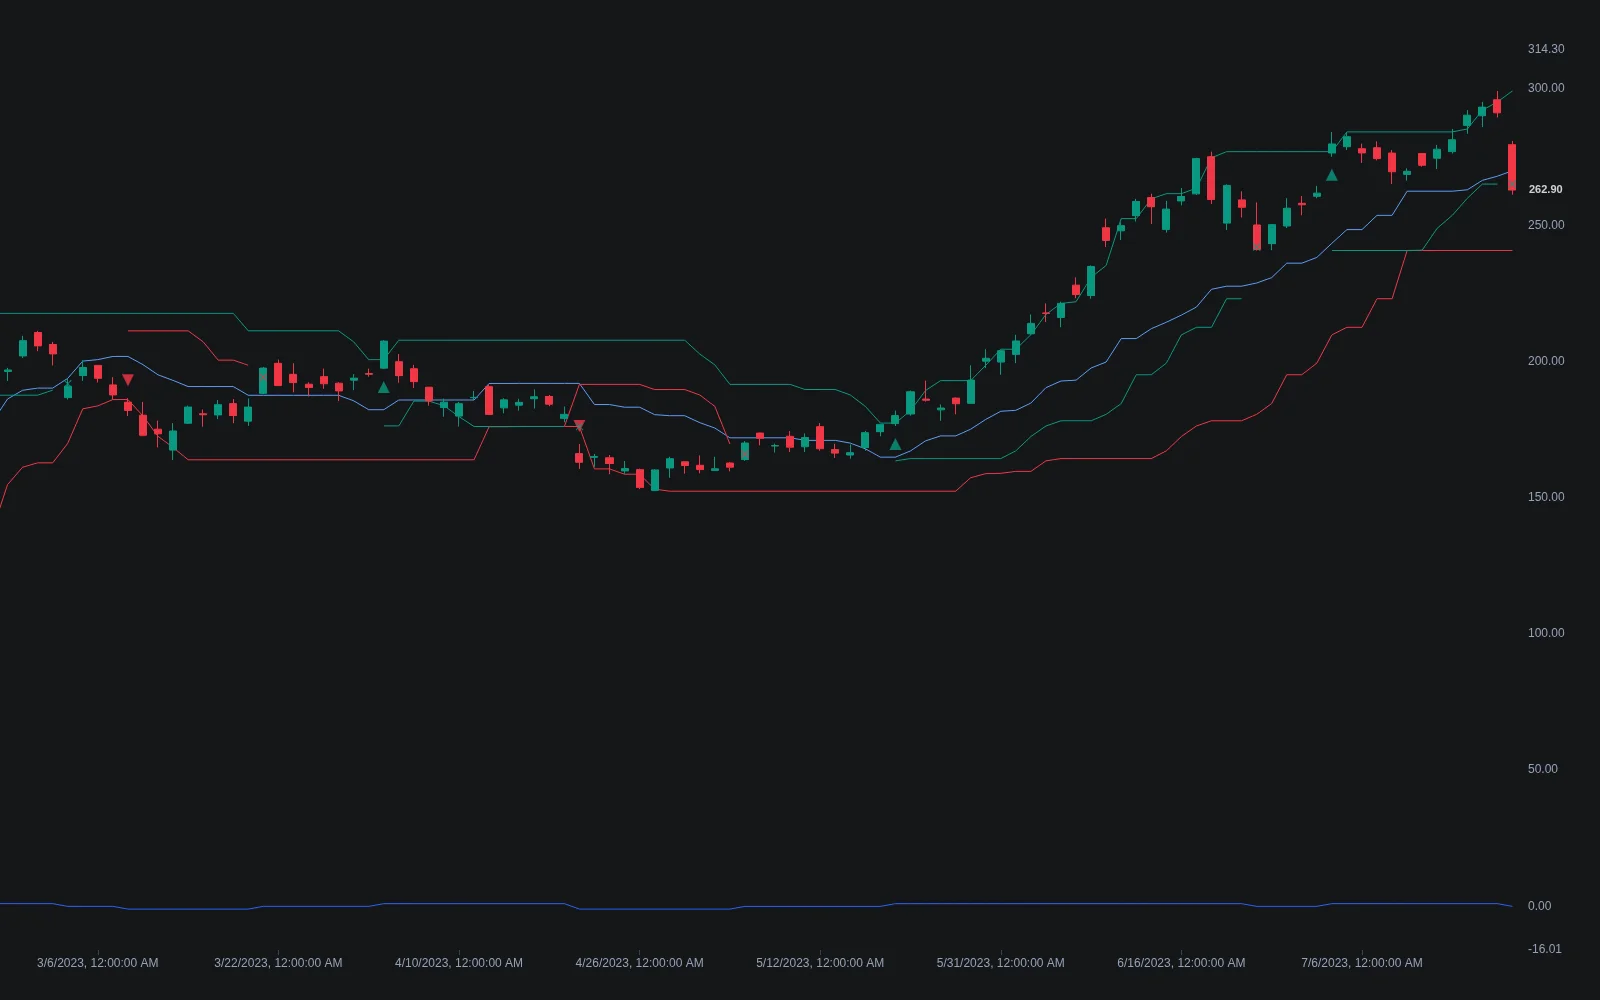
Donchian Trend Rules runs the mechanical system described above with an explicit position state, so one entry prints per trade and nothing repaints until its exit. Its channels are built from prior bars only, which makes each breakout well defined.
| Setting | Default | Effect |
|---|---|---|
| Entry Length | 20 | Lookback of the entry channel; a breakout beyond a band opens a position |
| Exit Length | 10 | Lookback of the exit channel; its opposite extreme is the trailing exit |
| Breakout Trigger | Close | Close beyond the band, or Intrabar Touch as soon as a wick penetrates it |
| Trade Direction | Long & Short | Direct reversals on an opposite entry, or one-sided modes that go flat on the exit rule |
| Show Entry Channel, Trailing Exit Level, Signal Markers | On | Display of the channel, the exit line and the entry and exit marks |
| Color Bars by Regime | Off | Tints candles by the +1, 0, −1 position state so the rules can filter other tools |
The documented length pairs are 20/10 and 55/20; setting the exit equal to the entry recreates Donchian’s always-in four-week rule. Alerts fire on Long Entry, Long Exit, Short Entry and Short Exit. The indicator draws and alerts; it does not place orders.
Donchian MA Bands takes the highest and lowest values of a moving average, a 20-length VWMA by default, and iterates the calculation to build layered zones. Single-bar spikes that would move a raw channel are filtered out. In its Bands style it prints dots when price closes beyond the outer extremes; the Library page is explicit that these are boundary notifications to combine with your own entry and exit logic, not buy or sell signals.
The Library’s market-structure tools can add context on the same Quant Chart. They run their own calculations, and a structure label near a channel break is a coincidence to test, not confirmation. There is no combined signal across tools unless you write and test one.
Testing Strategies with Quant
Open Donchian Trend Rules or the standard channel on Quant Charts, then describe the complete system to Quant: entry length, exit length, trigger, direction, and a sizing rule. Inspect the Code and click Run. The native backtest guide explains the Backtest Summary strip: net profit, trade count, win rate, maximum drawdown and profit factor, with inputs and properties such as commission and slippage adjustable without regenerating the code. The Making Strategies with Quant guide covers the workflow.
Read trade count first. A channel system on daily bars produces few trades per year per market, so a decade of history on several markets is a reasonable minimum. Compare 20/10 with 55/20 under identical costs, and compare both with buy-and-hold. Results depend on the symbol and interval tested, and avoid Heikin Ashi charts for backtests because their averaged prices cannot be traded.
Documentation and the Library
The Donchian Channels concept page and the Donchian trend rules page in the Library give the formulas, the history and the related concepts, and each indicator page publishes its source. When adapting a shared setting or a screenshot from elsewhere, record the length, trigger convention and interval that produced it; without those, a result cannot be reproduced.
Conclusion
Donchian Channels are the simplest objective statement of a breakout: a new N-bar high or low. That simplicity is their value. The bands need no smoothing, the exit rule comes from the same construction, and every part of a Donchian system can be written down and tested.
The results depend on regime. Extended trends pay for the many small losses that ranges impose, so the method demands a fixed risk fraction, an exit rule you will actually follow, and a test long enough to include both conditions. Quant Charts provides the channel, the trend rules and the width measure natively, and Quant can help turn a written rule into a backtest you can inspect and run.
FAQs
What is the best period length for Donchian Channels?
There is no single best. Twenty bars is the classic default, 55 suits slower trend systems and 10 is common for exits. Longer lookbacks trade less often and give back more at exits; shorter ones react faster but whipsaw more. Match the length to your holding horizon and test it.
How do I confirm a Donchian breakout signal?
Define the trigger first: a close beyond the prior bar’s band or an intrabar touch. Filters such as a higher-timeframe breakout, rising momentum or above-average volume reduce trades; whether they improve the remaining trades is something only a backtest on your market can show.
Are Donchian Channels the same as the Turtle system?
No. The Turtles used Donchian-style 20-day and 55-day entries with 10-day and 20-day exits, but their results also depended on volatility-based sizing, pyramiding and strict risk limits. The channel supplies the levels; it is not the whole method.
Why does price never break the channel on the current bar?
In builds that include the current bar, a new high moves the upper band with it, so price stays inside by construction. Breakouts are judged against the previous bar’s bands. Builds that use prior bars only, such as Donchian Trend Rules, make a breakout a fresh extreme directly.
How do Donchian Channels differ from Bollinger Bands?
Bollinger Bands wrap a standard-deviation envelope around a moving average and describe typical dispersion; price closes outside them routinely. Donchian bands are literal N-bar extremes with no averaging, so a touch of the band and a new extreme are the same event.
Can I backtest a Donchian strategy on Quant Charts?
Yes. Open Donchian Trend Rules or the standard channel from the Library, describe the entry length, exit length, trigger, direction and sizing to Quant, inspect the Code and click Run. Enter commission and slippage and read trade count before the return.
References
LuxAlgo Resources
- Quant Charts
- LuxAlgo Quant
- Donchian Channels Indicator
- Donchian Trend Rules
- Donchian Width
- Donchian MA Bands
- Donchian Channels Concept
- Donchian Trend Rules Concept
- Range Expansion and Contraction
- Native Backtest Guide
- Making Strategies with Quant
- Understanding RSI
- Risking It Right
External Resources
Read next