FINVIZ Screener Hacks To Save Hours Scanning
Sorting stocks can be overwhelming, but FINVIZ makes it faster and easier. Whether you're a beginner or an experienced trader, FINVIZ helps you analyze stocks using filters for fundamentals, technicals, and descriptive data. Here's what you need to know:
- Free vs. Elite: The free version has delayed quotes and basic tools. The Elite plan ($24.96/month billed annually) offers real-time data, Multi-Chart Widget (LuxAlgo Library), and alerts.
- Key Tools: Use filters like market cap, P/E ratio, and moving averages to find potential opportunities. Combine technical and fundamental data for better insights.
- Custom Alerts: Set price, volume, or technical-pattern alerts to save time.
- Market Trends: Visual tools like heatmaps help you quickly spot bullish or bearish conditions.
- Premium Features: Elite includes real-time updates, intraday charts, and data exports for deeper analysis.
Want to save time and make smarter trades? Start by creating custom screeners and using tailored filters to focus only on the stocks that meet your criteria. Whether you're looking for momentum plays or undervalued growth stocks, FINVIZ can help you act faster and with more precision.
Master FINVIZ Stock Screener in 10 Minutes: ULTIMATE Guide!
FINVIZ Basic Tools Overview
FINVIZ simplifies stock analysis by combining fundamental and technical data in an easy-to-use platform. It lets traders filter through thousands of stocks almost instantly, offering insights to support better decision-making.
Main Filter Types
FINVIZ organizes its Signals & Overlays Screener elements (LuxAlgo) into three main filter categories:
- Descriptive Filters: Focus on stock characteristics like market cap, sector, price, and trading volume.
- Fundamental Filters: Highlight financial metrics such as P/E ratio, earnings growth, and debt levels.
- Technical Filters: Include indicators like price trends, moving averages, and chart patterns.
For a more streamlined search, use the "All" view to apply filters from multiple categories at once. For example:
| Filter Type | Example Criteria | Purpose |
|---|---|---|
| Descriptive | Market Cap > $500M | Identify stocks with liquidity |
| Fundamental | P/E < 20 | Spot undervalued companies |
| Technical | Price above 200-day MA | Confirm upward price momentum |
After setting your filters, the market overview feature helps you interpret the results within the broader market context.
Market Overview Tools
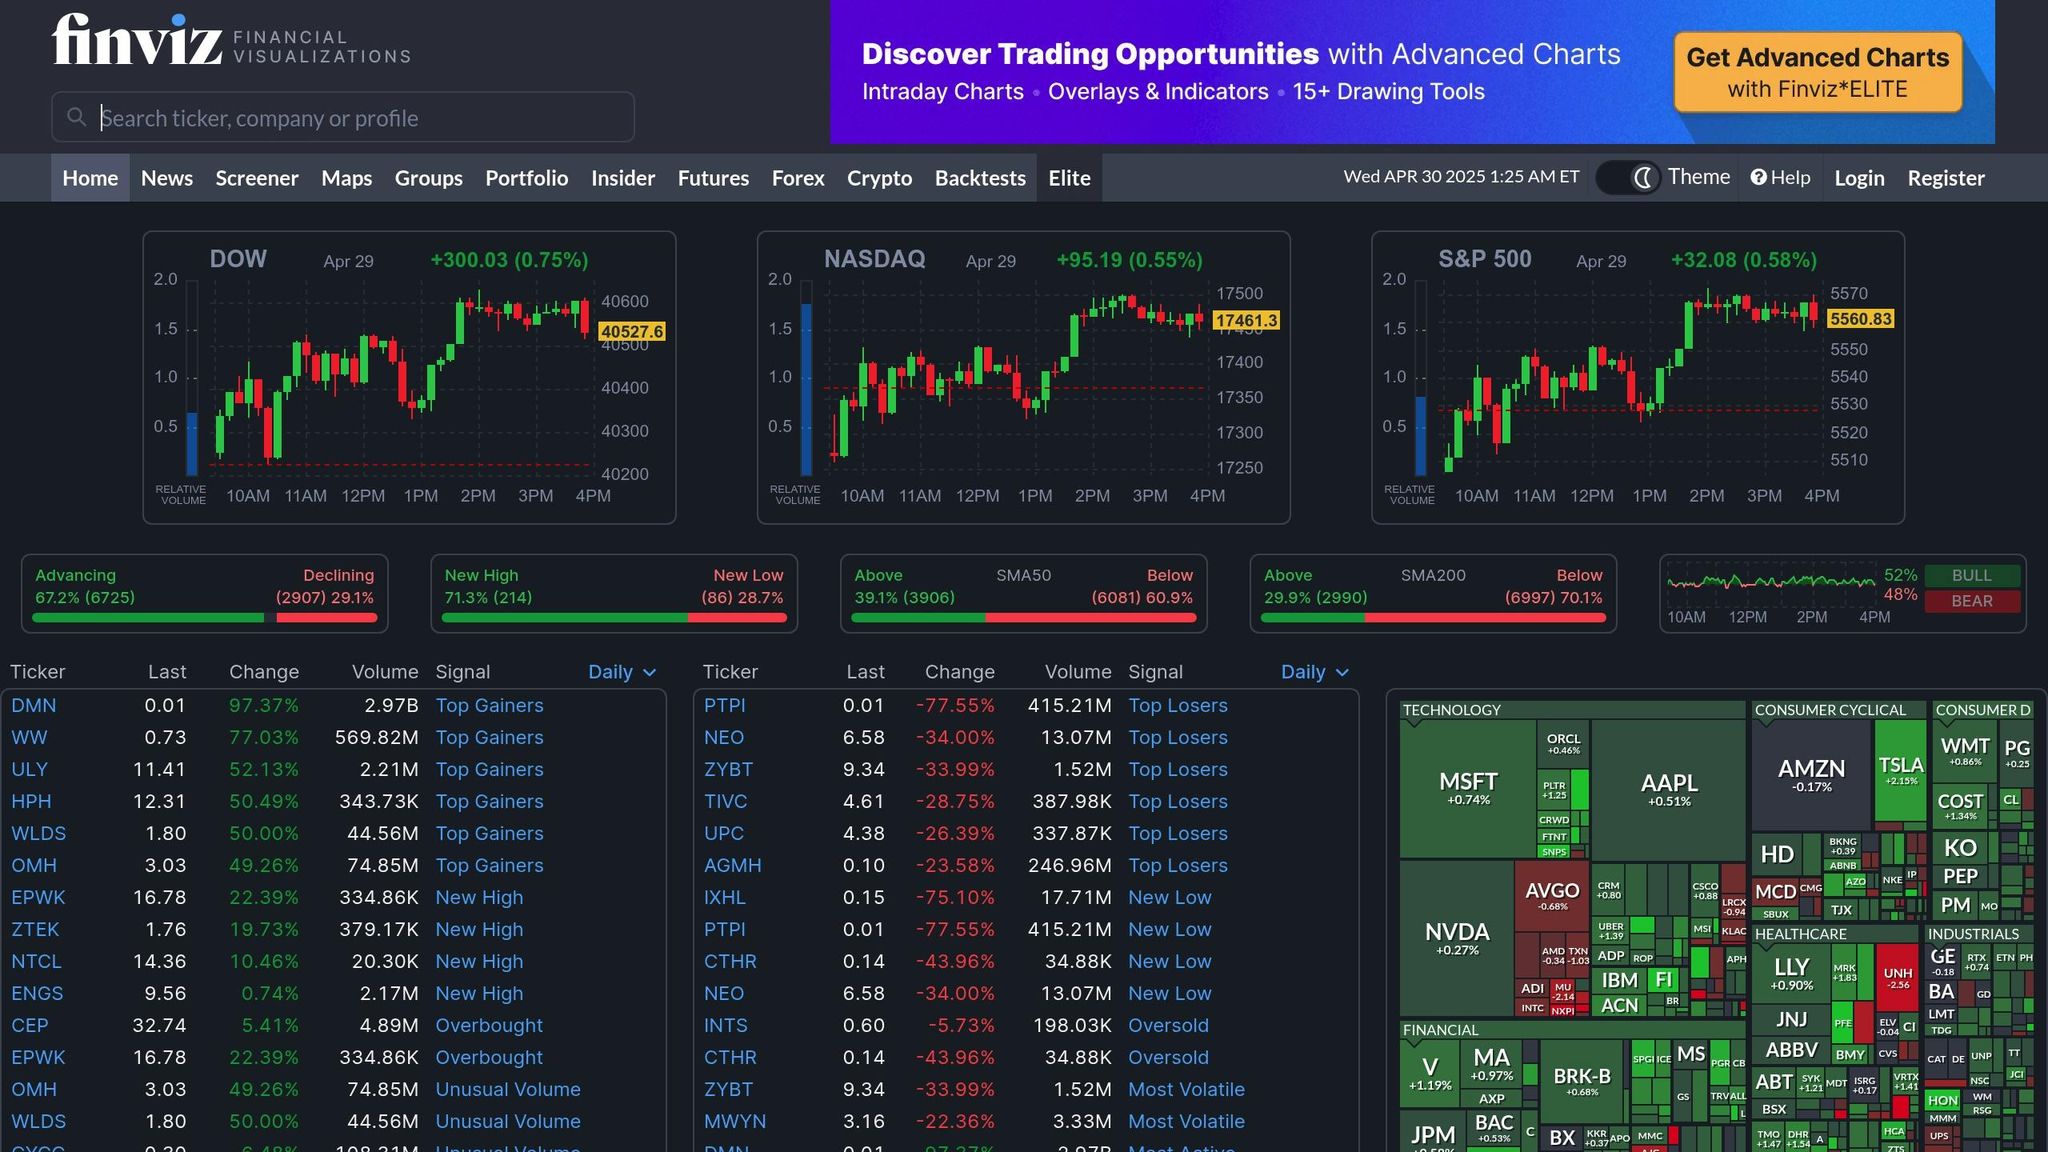
In addition to its filters, FINVIZ offers tools to quickly gauge market trends. The heatmap visualization is particularly useful, showing sector performance with color-coded highlights to pinpoint strengths and weaknesses.
For example, on April 30 2025, market data revealed that 67.2 % of stocks were advancing, 29.1 % were declining, 71.3 % hit new highs, and 28.7 % reached new lows. If the market is bullish, you might focus on momentum filters to find stocks breaking out. On the other hand, during a downturn, you could adjust filters to locate oversold stocks or safer investment options.
FINVIZ also tracks unusual trading volume, analyst ratings, and insider activity to give you an edge. These insights can help you spot opportunities early, saving time and sharpening your analysis.
Best Filter Combinations
Pairing the right filters can streamline your stock screening process, cutting down on time and helping you focus on the most promising opportunities. For example, combining short-interest data with price-movement filters can uncover potential plays with strong momentum.
Short Interest and Price Movement Filters
Using short interest alongside price-movement filters is a solid strategy for spotting potential squeezes and momentum-driven stocks.
| Filter Category | Parameter | Example Setting | Purpose |
|---|---|---|---|
| Descriptive | Market Cap | Over $500M | Ensures liquidity (see Basic Tools Overview) |
| Technical | RSI | Under 30 | Flags oversold conditions |
| Technical | 20-day MA | Price above MA | Indicates upward momentum |
| Fundamental | Short Float | Over 20 % | Highlights high short interest |
| Technical | Average Volume | Over 500K | Confirms sufficient trading activity |
Focusing on volume and clear price signals helps avoid false positives, ensuring you zero in on stocks ready for movement.
But momentum plays aren't the only game in town. Mixing technical and fundamental filters can also help you uncover undervalued growth stocks with strong potential.
Mixed Technical and Fundamental Filters
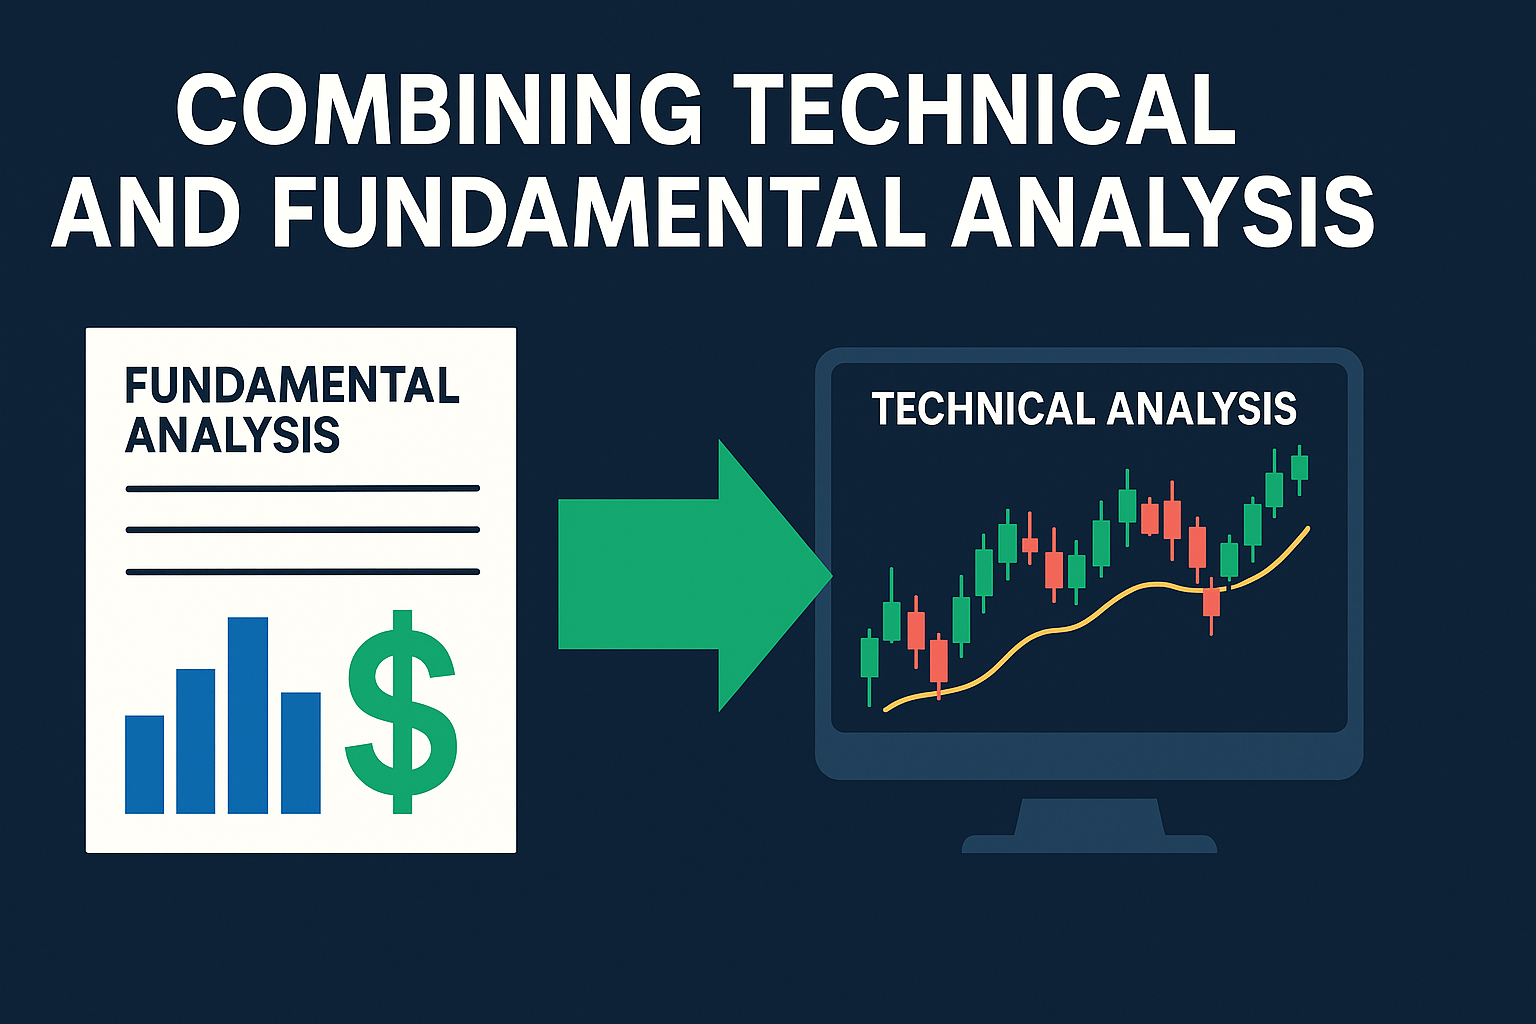
Combining solid fundamentals with technical indicators allows you to efficiently identify stocks with strong performance potential.
-
Growth Metrics Setup
- Earnings growth above 25 % quarterly
- Sales growth above 20 % quarterly
- Return on equity above 15 %
- Gross margin above 30 %
-
Technical Confirmation
- Price above the 50-day moving average
- RSI between 40-70
- Average volume above 100 000 shares
-
Final Refinement
- Share price between $10 and $100
- Market cap above $1 billion
- US-based securities only
This blend of filters helps pinpoint high-performing stocks while saving time, making it easier to find promising opportunities.
Custom Screener Setup Tips
Customizing FINVIZ screeners can help you save time and zero in on the best opportunities. By creating presets and setting up automated alerts, you can make your market analysis much more efficient. Here’s how to do it.
Saving Preset Screeners
Set up custom presets tailored to different trading styles:
- Active trading: Focus on liquidity and technical indicators.
- Balanced strategies: Combine technical and fundamental metrics.
- Long-term investments: Prioritize factors like market cap, P/E ratio, and PEG ratio.
To keep things organized, name your presets based on the strategy or market phase they’re designed for. This way, you can quickly find the right setup when you need it.
Setting Up Stock Alerts
Stock alerts can notify you when specific conditions are met, saving you from constant manual scanning. Consider setting alerts for:
- Price action: Big price swings or breaches of critical levels.
- Technical patterns: Events like moving-average crossovers or other indicator shifts.
- Fundamental updates: Changes such as earnings announcements or insider trading activity.
Premium Tools Guide
FINVIZ Elite is designed to save traders time by providing real-time data and advanced charting tools, making trading analysis faster and more efficient. These features build on FINVIZ's core offerings, helping users make quicker decisions.
Live Data Features
Real-time data eliminates the need for constant refreshing, ensuring you stay on top of market movements. With FINVIZ Elite, you get instant updates for:
- Stock quotes
- Pre-market and after-hours data
- Homepage market overview
- Interactive maps
- Signals & Overlays Screener results (LuxAlgo)
This is especially useful for day traders who need to act on rapid market changes.
| Feature | Free Version | Elite Version |
|---|---|---|
| Quote Updates | 15-min delay | Real-time |
| Market Data | Delayed | Live updates |
| Alert Notifications (LuxAlgo Backtesters) | Basic | Comprehensive |
| Data Export | No | Yes |
In addition to live updates, Elite offers advanced charting tools to provide a more detailed view of the market.
Advanced Chart Tools
Elite's charting features help traders refine their strategies with tools for intraday analysis and performance tracking.
Intraday Analysis Tools & Performance Tracking
- Multi-timeframe views with customizable overlays
- Drawing tools for identifying support and resistance levels
- Fullscreen chart layouts for better visualization
- Benchmark comparison options
- Historical backtesting to test strategies
These premium tools are available for $24.96 per month when billed annually ($299.50/year) or $39.50 for a monthly subscription.
To make the most of these features, consider:
- Combining custom indicators to match your trading strategy
- Setting automated alerts for key technical patterns
- Saving chart layouts for various market scenarios
The advanced screener's statistics view and data export options allow for deeper analysis without the hassle of manual data collection, making it easier to identify trading opportunities with precision.
Conclusion
Using FINVIZ screener techniques can transform stock scanning into a more focused, data-driven process. By applying tailored filters and combining fundamental and technical analysis, traders can quickly zero in on promising stocks.
Customizing screener layouts simplifies daily analysis. Merging fundamental and technical criteria allows you to spot trends early, giving you an edge in the market.
"By filtering a large list of stocks based on technical and fundamental criteria, the screener shows you potential investment opportunities within seconds." - Vincent Nguyen, TradeSearcher
Here are a few tips to refine your screening process:
- Build different screener layouts for varying market conditions
- Set price and volume alerts (LuxAlgo Toolkits) for stocks on your watchlist
- Regularly update and fine-tune your screening criteria
These techniques align perfectly with the advanced features discussed earlier.
Pairing real-time data from FINVIZ Elite with custom screeners allows for faster, more informed decisions. Whether you're a day trader looking for immediate insights or a long-term investor seeking strong opportunities, these strategies can help you streamline your analysis.
FAQs
What’s the difference between the free and Elite versions of FINVIZ, and how can it affect my trading strategy?
The free version of FINVIZ is great for beginners or casual traders, offering delayed data, basic charts, and limited screener functionality. While it provides enough tools for simple analysis, it lacks the advanced features needed for more active or data-driven strategies.
The Elite version, on the other hand, is designed for serious traders. It includes real-time data, advanced interactive charts, customizable alerts, backtesting capabilities, and the ability to export data. It also offers an ad-free experience, access to premarket data, and expanded screener presets. These features are essential for those who rely on precise, up-to-date information to make quick, informed decisions.
If your trading strategy depends on speed, customization, or deeper analysis, the Elite version can be a game-changer. However, if you’re just starting out or only need basic tools, the free version may be sufficient.
How can I use both technical and fundamental filters in FINVIZ to find promising stocks?
To find high-potential stocks using FINVIZ, you can combine technical and fundamental filters for a more targeted search. Start by navigating to the screener tool and selecting filters that align with your strategy.
For fundamental filters, focus on metrics like Price-to-Earnings (P/E) ratio, Return on Equity (ROE), or Dividend Yield to evaluate a stock's financial health. Then, add technical filters to identify trends or patterns, such as Relative Strength Index (RSI) or moving averages.
By combining these filters, you can pinpoint stocks that meet your criteria. For example, you might search for undervalued stocks with a P/E ratio below 20 and an RSI under 30, helping you uncover opportunities that fit both your technical and fundamental strategy.
What are the best ways to set up custom alerts and screeners in FINVIZ to save time and improve efficiency?
To save time and boost efficiency with FINVIZ, start by creating custom filters tailored to your trading goals. You can save these settings as presets, allowing quick access to your preferred criteria whenever needed. This helps streamline your stock screening process.
For real-time updates, set up alerts using FINVIZ Elite. These alerts notify you via email or push notifications when stocks meet your filter criteria or experience significant price movements, news updates, or insider activity. This ensures you never miss important opportunities.
Finally, refine your watchlists by focusing only on stocks that match your specific requirements. By narrowing down your options, you can make faster, data-driven decisions without wasting time on irrelevant results.
References
Read next