Heikin-Ashi Charts: Clear Strategies for Traders
Heikin-Ashi charts smooth price action to make trends easier to follow. Their candles use calculated open, high, low and close values, so a long run of one color can highlight direction while smaller bodies and two-sided wicks can draw attention to a pause. The tradeoff is delayed information and prices that may differ from the market.
Use Heikin-Ashi to organize a trading hypothesis, then check ordinary candles for entries, stops and fills. There is no universal success rate that makes this chart type superior to standard candlesticks. Results depend on the complete strategy, market, timeframe, costs and execution assumptions.
- Read direction: compare candle color, body size and wicks after the bar closes.
- Keep actual prices visible: synthetic candle levels are not guaranteed tradable prices.
- Write a complete rule: define the setup, entry timing, stop, exit and position size before testing.
- Start in LuxAlgo: compare Heikin Ashi with ordinary candles in native charts, then use Quant to develop explicit research rules.
How Heikin-Ashi Candles Are Calculated
For each time interval, let O, H, L and C be the actual market open, high, low and close. HA denotes the calculated Heikin-Ashi value. The recursive open uses the previous Heikin-Ashi candle; it is not simply the current market open. The StockCharts calculation guide sets out these formulas.
| Value | Calculation | What it means |
|---|---|---|
| HA close | (O + H + L + C) ÷ 4 | An average of the current bar’s four prices, not its last traded price. |
| HA open | (Previous HA open + previous HA close) ÷ 2 | The midpoint of the previous synthetic body. |
| HA high | Maximum of H, HA open and HA close | Can include a synthetic open above the actual high. |
| HA low | Minimum of L, HA open and HA close | Can include a synthetic open below the actual low. |
The first candle needs a starting convention. One common seed uses (O + C) ÷ 2 for HA open, (O + H + L + C) ÷ 4 for HA close, and the actual high and low. Allow sufficient preceding data so the seed does not dominate your test. Match the symbol, session, timezone and timeframe when comparing implementations.
Worked Example: A Synthetic Low Is Not a Fill
Suppose the previous HA open is 100 and HA close is 104. The next actual bar opens at 110, reaches 114, falls to 109 and closes at 113. Its HA open is 102; HA close is (110 + 114 + 109 + 113) ÷ 4 = 111.5. HA high is 114 and HA low is 102.
That produces a rising synthetic candle with no lower wick even though the actual bar traded only between 109 and 114. A simulated purchase at its HA open of 102 would use a price outside that bar’s market range. Smoothing can also obscure gaps; inspect the ordinary candles before interpreting a level or an order.
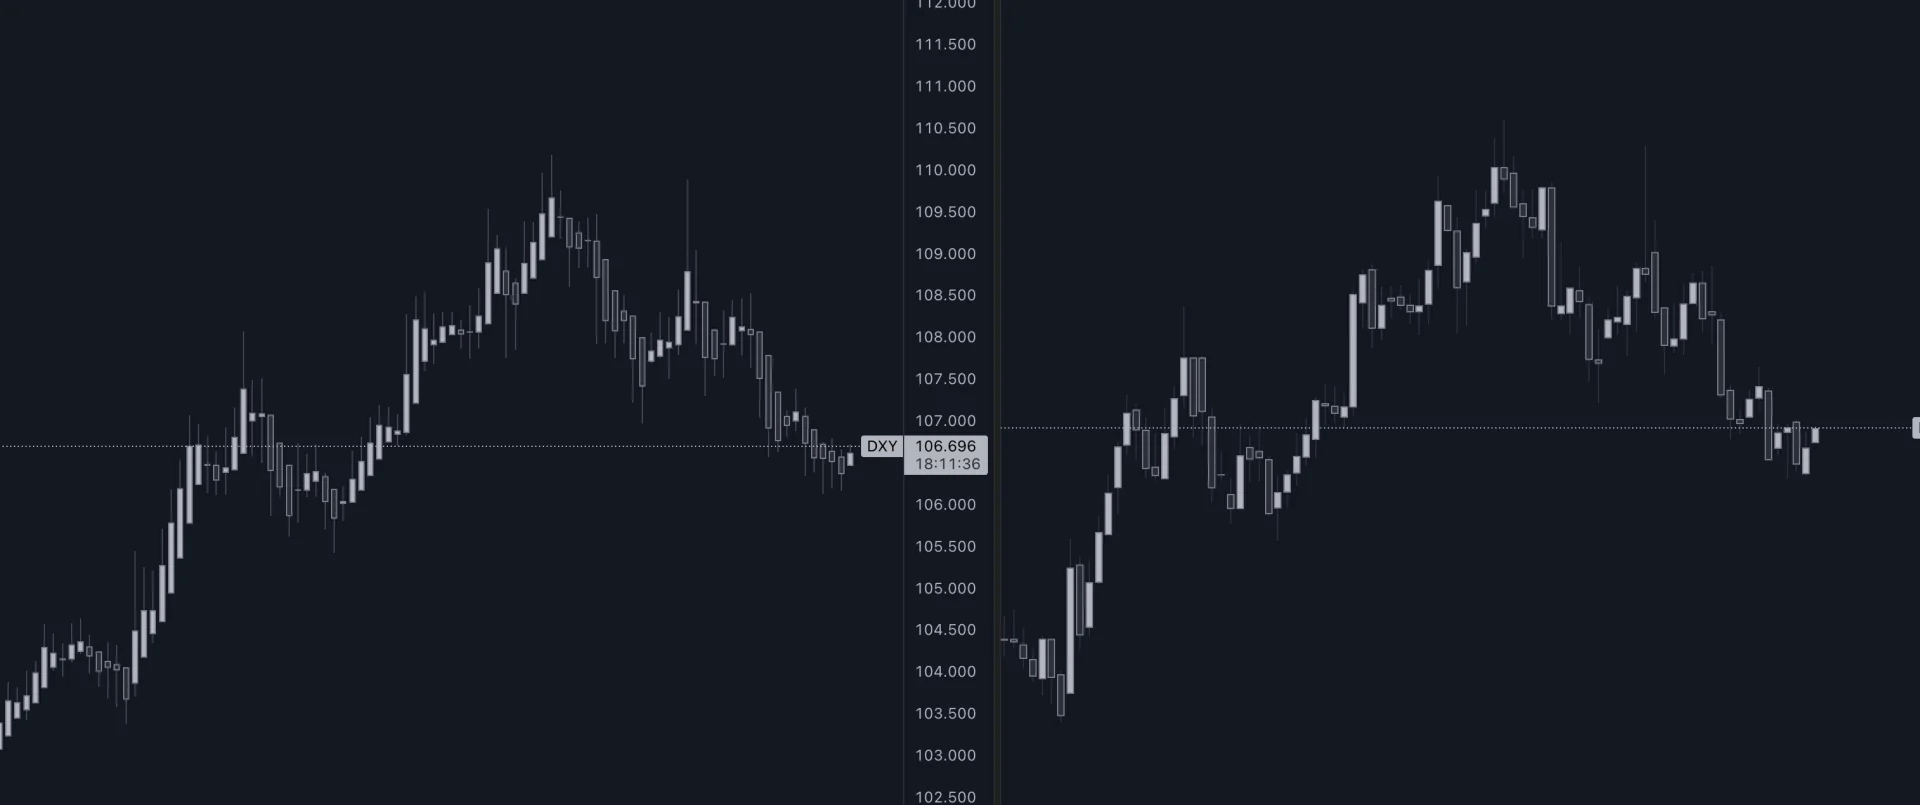
How to Read Trends, Wicks and Color Changes
| Observation on completed HA bars | Useful interpretation | Limit |
|---|---|---|
| Rising bodies, often without lower wicks | Sustained upward direction in the smoothed series | Price can still pull back sharply; the current market price may differ from HA close. |
| Falling bodies, often without upper wicks | Sustained downward direction in the smoothed series | Does not show who is selling or guarantee continuation. |
| Small bodies with upper and lower wicks | A pause or reduced directional clarity | Can precede continuation as well as reversal. |
| Color changes repeatedly | The series may be choppy at this timeframe | A longer timeframe changes the question; it does not remove risk. |
| First opposite-color candle | A possible change in the smoothed sequence | No fixed number of candles confirms every reversal. |
Use “rising” and “falling” relative to HA close versus HA open; chart colors are configurable. The forming candle can change color and shape before it closes. Waiting for the close gives a defined decision time, though the later entry may be less favorable.
Heikin-Ashi is recursive, so its delay is not a universal one- or two-bar constant. Strong smoothing can help a trader remain with a trend, but it can also respond late to a turn. Do not transfer every conventional candlestick pattern directly to synthetic candles: body containment and gaps no longer describe exactly the same market prices.
Video: Reading Heikin-Ashi Price Action
This educational tutorial from The Secret Mindset demonstrates how Heikin-Ashi candles present trends and pauses. Treat its chart examples as illustrations. Any entry or exit idea still needs actual-price execution assumptions and its own test; a visual demonstration is not evidence of profitability.
Three Practical Heikin-Ashi Strategy Ideas
1. Trend Following with a Defined Exit
A basic research rule might require two consecutive completed rising HA candles while the actual close is above a rising 50-period moving average. Enter no earlier than the next available market price after the condition is known. Define “rising average” explicitly, such as its current value exceeding the previous completed value.
An opposite-color HA candle can be one candidate exit rule, but it should not postpone a protective stop. Compare that exit with a price-based trailing stop or a predetermined holding period. Count every qualifying trade, including repeated entries in a range; a chart showing one uninterrupted trend hides those costs.
2. Pullbacks within a Broader Trend
For a long-side hypothesis, first define an upward trend using ordinary prices. Then require a pullback toward a previously identified support area or moving average, followed by a completed rising HA candle. Specify whether the order is placed at the next bar, above an actual price high, or through another executable condition. These alternatives are different strategies.
A small HA body or a candle with an opposing wick can identify a pause to investigate, but it does not by itself define a reliable “zone.” Mark the area using actual prices known at that time. If a pivot requires later bars to become identifiable, the test must wait for those bars before using it. Reverse the logic deliberately for a short-side study rather than assuming identical behavior.
3. Reversal Candidates at Actual Price Levels
A small-bodied HA candle followed by an opposite-color candle can prompt a closer look near a previously established level. For example, test whether an actual close below a specified support level, after a rising HA sequence, provides a useful bearish setup. State how the level was chosen and when it became available.
Reversal trading runs against the preceding move and can generate repeated false starts. A third candle is not universal proof of a reversal. Compare results with and without the HA condition to learn whether smoothing adds information beyond the actual-price rule.
Combining Heikin-Ashi with Other Indicators
Moving Averages
The 9- and 21-period EMAs are examples of faster trend measures; 50-, 100- and 200-period averages provide longer windows on the same timeframe. A 200-period average on a five-minute chart is not the same horizon as a 200-day average. Choose periods around the question being tested rather than treating any pair as universally optimal.
Declare the input series. An EMA of actual closes and an EMA of HA closes are different calculations. Applying an average to already smoothed HA values adds another layer of smoothing and may increase delay. A 100-period actual-price average can serve as a simple directional filter, but HA and moving averages both derive from price, so agreement is not independent confirmation.
Volume and Support or Resistance
Compare activity with a defined baseline, such as the previous 20 completed bars, while accounting for the session and data feed. A green HA candle does not mean all that bar’s volume was buying, and volume does not become synthetic just because the price display changes. Greater activity can accompany either continuation or reversal.
Use ordinary candles to mark actual support and resistance and to assess gaps. Check whether the feed reports traded volume or tick activity. This matters when comparing stocks, futures, crypto and forex: different volume coverage can change a filter’s interpretation.
RSI and HARSI
RSI can add a specified momentum condition, but strong trends can remain at elevated or depressed readings. It also derives from price, so combining it with HA is not automatically a second independent source of evidence.
HARSI is a separate oscillator concept that applies a Heikin-Ashi-style presentation to RSI values. The Superalgos implementation guide describes a zero-centered RSI and zones at −20 and +20, with an example that crosses back above −20. Those are implementation-specific settings, not automatic buy and sell instructions. Check the exact script, smoothing and crossing rule before comparing results.
Use Heikin-Ashi in Native LuxAlgo Charts
Open LuxAlgo charts and choose Heikin Ashi from the chart-style menu. The native chart documentation lists it alongside Candles, Bars, Line, Area and Baseline. Keep an ordinary Candles view available for the same symbol, interval and session so you can compare synthetic signals with actual OHLC data.
Use Quant, our coding agent to turn a written rule into a study or strategy. Specify actual OHLC inputs, the HA formulas and seed, completed-bar decisions, entry timing, fees, slippage and the stop and exit rules. Inspect the generated code and run the strategy manually, following the Quant strategy workflow. Check individual trades against ordinary candles before trusting aggregate statistics.
For example: “Calculate Heikin-Ashi values from ordinary OHLC data. After two completed rising HA candles and an actual close above a rising 50-period SMA, allow a long entry at the next executable price. Use an actual-price protective stop and exit after a completed falling HA candle. Expose the periods and risk inputs, avoid future data, and include costs.” Review how every part was implemented rather than assuming the prompt guarantees it.
Where the Multi-Chart Widget Fits
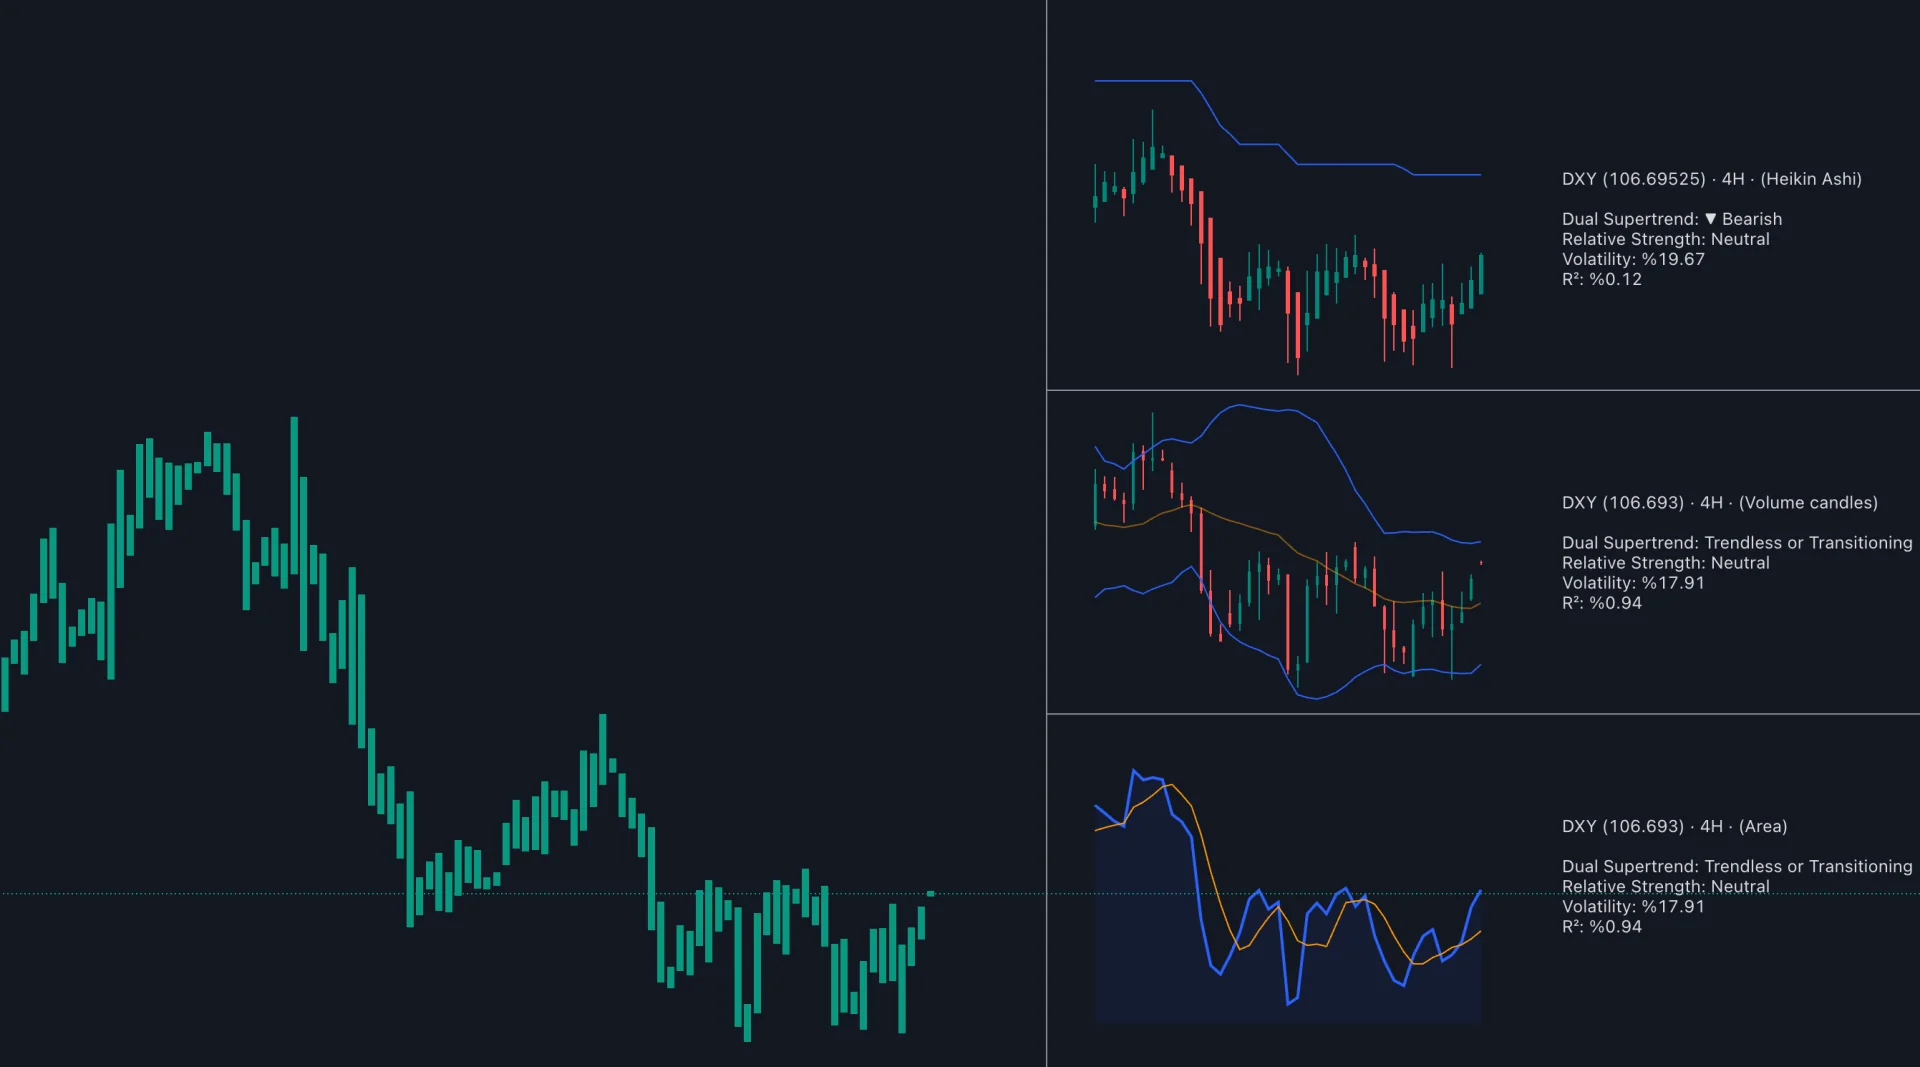
The Multi-Chart Widget is a separate indicator that displays up to three miniature charts with individual symbols, intervals, styles and overlays. Its documented styles include Heikin Ashi, volume candles and area. The historical example below illustrates that widget layout; the native workspace above is a separate way to organize chart views.
Backtest Signals without Inventing Tradable Prices
The TradingView documentation on non-standard data explicitly distinguishes synthetic Heikin-Ashi values from market prices and demonstrates requesting HA values while displaying ordinary candles. That is a useful separation: derive a signal from the synthetic series, but evaluate order execution using the actual-price series and the engine’s documented fill model.
Do not assume changing chart style automatically makes a simulation valid on every platform. Verify which series controls orders, whether decisions occur at bar close, when an order can first fill, and how gaps and intrabar stop/target conflicts are handled. A favorable fill at a synthetic open or low can turn an unprofitable idea into an attractive but unusable backtest.
| Decision | Define before testing | Check afterward |
|---|---|---|
| Data | Symbol, feed, timeframe, session and HA initialization | Same underlying actual prices across the compared runs. |
| Signal | Exact completed-bar color, wick and optional filter conditions | No use of later bars or unfinished higher-timeframe values. |
| Orders | Next available entry, actual-price stop, exit and sizing | Individual fills fall within a defensible market execution model. |
| Costs | Commission, spread, slippage and relevant financing | Results remain understandable under less favorable costs. |
| Evaluation | Development period, later untouched period and baseline | Trade count, average win/loss, drawdown and net result; not win rate alone. |
Position Size from the Actual Entry and Stop
Suppose an actual long entry is 113 and the planned actual-price stop is 109. With a $100 risk budget and $12 reserved for estimated costs, an illustrative size is (100 − 12) ÷ (113 − 109) = 22 shares. A fill at 109 would lose $88 before those costs. If a gap produces an exit at 107, the price loss becomes $132 before costs, exceeding the intended budget.
Use the instrument’s contract value, lot size and leverage requirements where applicable; the share example does not transfer unchanged to futures or forex. A stop is a risk-management instruction, not a guaranteed exit price. Choose the stop from actual price structure or another explicit rule, not a synthetic wick that may never have traded.
Review results across trending and ranging periods, then test a later untouched sample without repeatedly retuning it. Compare the same strategy on actual-price conditions alone. Keep a record of settings, rejected ideas and observed fills so a cleaner-looking chart is not mistaken for a demonstrated edge.
Frequently Asked Questions
Are Heikin-Ashi candles more accurate than normal candles?
They present a smoothed view of price, not a universally more accurate forecast. Ordinary candles show actual OHLC values, while Heikin-Ashi candles use calculated values. Compare complete strategies with realistic costs and execution assumptions rather than relying on a claimed universal win rate.
Can I place an order at the Heikin-Ashi open or close?
You can choose an order price, but a calculated HA value may not be available in the market. Base expected fills and risk calculations on actual prices and the execution model. A synthetic low can lie below the entire actual bar’s range.
Does a color change confirm a reversal?
No. A completed opposite-color candle marks a change in the smoothed series. It may be a pause or a false start. Define any additional actual-price condition and test it without assuming a fixed number of candles proves a reversal.
Which moving average works best with Heikin-Ashi?
There is no universal best period. Specify the timeframe and whether the average uses actual closes or HA closes, then compare a small set of justified alternatives. Averaging HA values adds smoothing and can increase delay.
Can I use Heikin-Ashi in LuxAlgo charts?
Yes. The native chart-style menu includes Heikin Ashi. Keep an ordinary Candles view available for actual-price checks. Quant, our coding agent, can help express research rules; inspect generated code and run the strategy manually.
How should I backtest a Heikin-Ashi strategy?
Separate the HA signal calculations from actual-price order execution. Define initialization, sessions, completed-bar timing, stops, exits, sizing and costs. Inspect individual trades, compare a baseline without the HA filter, and evaluate a later untouched period.
Read next