Hollow Candles: Simple Guide for Trading Insights
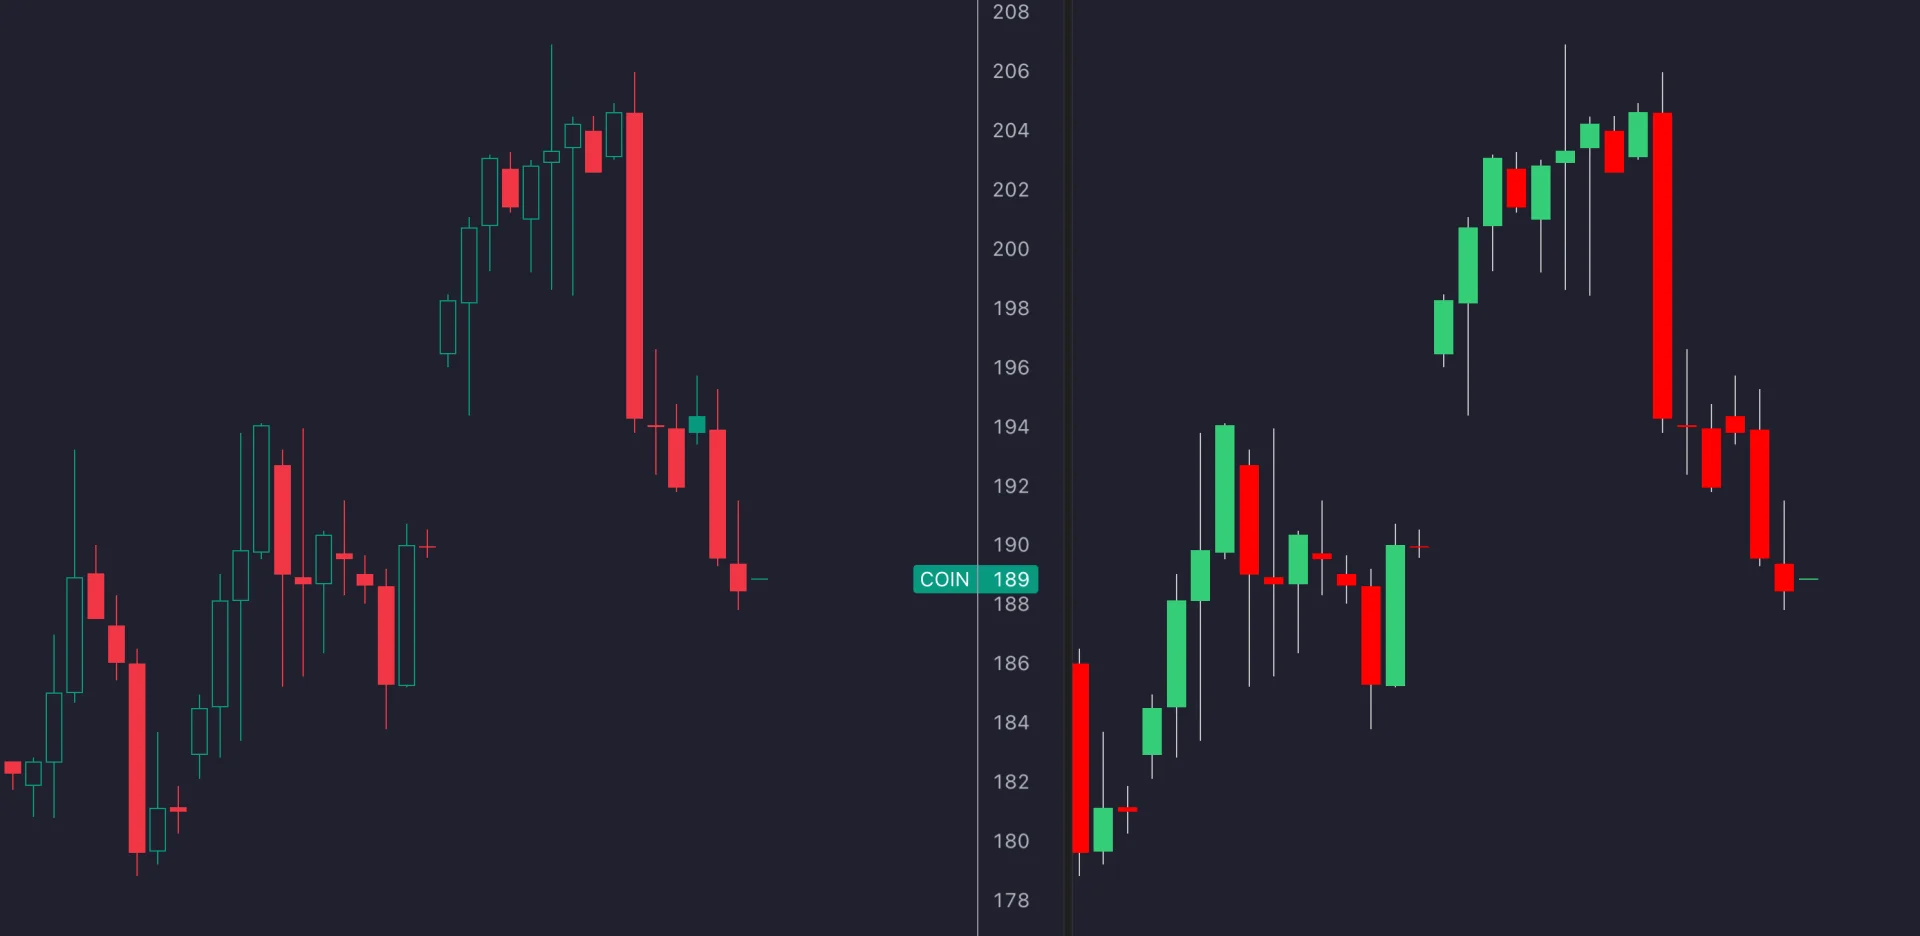
Hollow candles display two comparisons at once: the close versus the current open, and the close versus the previous close. Under the common green/red convention, fill answers the first question and color answers the second. A red hollow candle can rise during its own period while still closing below the previous period.
This changes how existing price data is displayed; it does not create new market information or a guaranteed trading signal. You can study the same open, high, low and close relationships in native LuxAlgo charts and use Quant, our coding agent, to implement explicit rules. The mathematics matters more than the color theme.
Hollow Candle Structure
Let O be the current open, H the high, L the low, C the close and P the previous candle’s close. The body spans O to C; the upper shadow extends from the higher of O and C to H, and the lower shadow extends from L to the lower of O and C. Hollow candles preserve those price coordinates.
Body size = absolute(C − O), upper shadow = H − max(O, C), and lower shadow = min(O, C) − L. For O = 100, C = 102, H = 103 and L = 99, the body is 2 and each shadow is 1. That geometry does not reveal the complete sequence of intrabar trades.
TradingView’s hollow-candle documentation defines hollow as C > O and filled as C < O, with green for C > P and red for C < P. Other palettes may use different colors. Check the platform settings and actual OHLC values rather than treating white, black, green and red as universally interchangeable.
Equality requires separate handling. When C = O, the body has zero height, so hollow versus filled is not a useful visible distinction. When C = P, the close-to-close change is zero and the platform’s tie convention determines its appearance. In a strategy, state the equality rule explicitly. A first bar without a previous close cannot be classified by that comparison.
Read the Four Combinations
| Appearance | Required comparisons | Example with previous close 100 | What happened |
|---|---|---|---|
| Green hollow | C > O and C > P | Open 101; close 103 | Rose 2 from the open and 3 from the previous close. |
| Red hollow | C > O and C < P | Open 95; close 98 | Recovered 3 from the open but remained 2 below the previous close. |
| Green filled | C < O and C > P | Open 105; close 102 | Fell 3 from the open but remained 2 above the previous close. |
| Red filled | C < O and C < P | Open 99; close 96 | Fell 3 from the open and 4 from the previous close. |
These are four descriptions, not a universal ranking of signal strength. A green hollow candle can be tiny or large. A red hollow candle records an intraperiod recovery, but calling it simply bullish hides its lower close. A green filled candle records an intraperiod decline while retaining a close-to-close gain.
The identity C − P = (O − P) + (C − O) explains the mixed cases. For the red hollow example, −2 = −5 + 3: a gap down of 5 followed by a recovery of 3 still leaves a decline of 2. For the green filled example, +2 = +5 − 3. These are price-point changes; percentage returns use their respective denominators and should not be added in the same way.
Differences from Standard Candlesticks
In a common filled-candle theme, green means C > O and red means C < O. Hollow styling uses fill for that comparison and color for C versus P. Traditional candlestick charts can also use hollow bodies, and some platforms let ordinary candle colors depend on the previous close. Identify the chosen convention before comparing charts.
| Question | Hollow styling | What stays the same |
|---|---|---|
| Did price rise from its open? | Read hollow versus filled | The open and close values remain available in either display. |
| Did price close above the previous close? | Read the configured color | The same comparison can be calculated on ordinary OHLC bars. |
| How wide was the price range? | Read high minus low | The wicks and underlying range are unchanged. |
| Did changing style improve a strategy? | Test identical rules and data | Appearance alone does not add information or establish an edge. |
Hollow candles are not Heikin Ashi, which calculates transformed candle values. They are also different from volume-width displays such as EquiVolume. A hollow body does not measure volume, resting orders or money flow. Changing a chart’s style should not silently change the data used for an entry or assumed execution price.
Interpret Sequences with Their Price Context
Trend and Momentum
Several hollow bodies mean several periods closed above their own opens. They do not necessarily mean consecutive higher closes: repeated downward gaps can coexist with hollow candles. Check both comparisons, the size of changes, prior highs and lows, and the selected timeframe before describing a trend.
Likewise, a run of filled bodies does not prove a close-to-close downtrend if upward gaps repeatedly outweigh intraperiod declines. Long bodies and short shadows describe where the close finished relative to the bar’s range. They do not identify who traded or guarantee continuation.
Potential Reversals
A hollow candle after filled candles near a previously defined support zone can form a reversal hypothesis. Specify the zone before the event, its allowed distance from the candle, and the subsequent trigger. For example, test a completed close above the candidate’s high within the next three bars, with cancellation if its low is breached first.
A filled candle after hollow candles near resistance can be tested with the mirrored conditions. The first opposite body may be only a pause. Define an expiry and an executable next price rather than selecting successful turning points after the outcome is visible.
Volume and Indicator Filters
If adding volume, specify a reference such as the mean of the preceding 20 completed bars, excluding the signal bar. A completed volume of 180 against a reference of 100 is 1.8 times that reference. This measures relative activity on the selected feed, not a guaranteed reversal or net buying pressure.
Intraday volume varies by session time, and exchange-specific volume is not automatically total market volume. An unfinished candle’s volume is not directly comparable with completed bars without a defined adjustment. RSI or MACD can add a momentum condition, but they also derive from price; multiple agreements can repeat information. Compare each filter with the unfiltered rule on common dates.
Recognize Patterns from Geometry
A candle pattern is defined by prices and context, not merely by a sequence of colors. The StockCharts pattern dictionary describes conventional formations, which still need explicit rules for size, gaps and timing when tested.
- Three White Soldiers: three substantial rising bodies with successively higher closes near their highs; later opens are within the preceding bodies. Three hollow candles alone do not establish the full formation.
- Morning Star: a large bearish body after a decline, a small separated middle body, and a bullish candle closing above the first body’s midpoint. Specify the gap convention; a no-gap variant differs from the classic formation.
- Filled candle near a high: C < O describes its body direction. To claim rejection of higher prices, also examine its high, upper shadow, close location and prior context. A filled body alone is not a distinct proven reversal pattern.
For a morning-star midpoint example, a first candle opening at 104 and closing at 100 has a midpoint of 102. A third close at 103 exceeds that midpoint; the middle candle, prior decline and any required gaps must still qualify. Hollow display changes neither this calculation nor when the three-candle pattern becomes complete.
If pattern detection uses later bars to identify a swing or label a trend, a historical marker may appear at an earlier candle than the moment it became available. Use the detection time for strategy decisions. For multiple timeframes, use only the higher-timeframe information that existed at the entry decision.
Build a Testable Rule in Native LuxAlgo
Open native LuxAlgo charts and set the symbol, venue, interval and session. The current native chart overview lists Candles, Bars, Line, Area, Baseline and Heikin Ashi alongside specialized chart types; it does not document a separate Hollow candles option. Use ordinary OHLC candles to study these comparisons, rather than assuming a particular display control exists.
Use the Indicators picker for a defined study, or ask Quant, our coding agent to label the four cases from O, C and the previous close. Include how equality and missing prior values should be handled. A label or custom color is a display aid, not a backtest.
For a strategy, specify context, trigger, execution, size, stop, exit and costs. An example prompt is: “Test a completed close above both its open and previous close, with my stated trend condition and next-eligible-price entry. Define the stop and target, expose numerical inputs, and prevent future-data use.” Inspect the generated code and run it manually. Check individual entries before interpreting totals.
After reviewing the logic, compare exposed values through Inputs and simulation assumptions through Properties. Use the strategy viewer to review results, and reserve later data that did not select the settings. Changing only the visual candle style should not be mistaken for changing the strategy’s price conditions.
Add Position Sizing before Evaluating Results
Suppose a hypothetical long rule becomes known after a completed candle and fills at $103, with a predefined stop at $99. A $100 cash risk allowance minus $12 estimated total costs leaves $88 for price risk. For an instrument worth $1 per point per unit, quantity = floor($88 ÷ $4) = 22 units, with $2,266 notional exposure.
A 2R price target based on the initial $4 distance is $111, before costs. If a gap leads to an exit at $97, the loss becomes 22 × $6 = $132 before costs. Position size must use the expected executable entry and actual stop distance; a green hollow candle does not reduce the potential loss. Include point value, currency conversion and permitted increments for other instruments.
Define whether exits use a fixed target, a structural level, a trailing stop or a time rule. If a historical bar touches both target and stop, its OHLC values may not establish their order. Keep realistic costs and unfavorable fills in the comparison instead of judging the setup from candle colors alone.
Video: How to Read a Hollow Candle Chart
TC Trading’s 11-minute, 35-second tutorial demonstrates hollow-candle interpretation. Its title describes the style as “better,” but usefulness depends on your visual preference and tested process. Use the numerical comparisons above to interpret its examples; the video is not a native LuxAlgo interface walkthrough.
If following the video in TradingView, its current documentation places Hollow candles in the upper chart-type menu. Body, border and wick colors can be customized in the Symbol settings. Confirm the actual settings used in any screenshot rather than copying color interpretations blindly.
Strengths and Limitations
- Useful visual compression: fill and color show two comparisons without separate calculations, but both comparisons already exist in the OHLC data.
- Gap awareness: mixed cases distinguish a recovery within a down period from a decline within an up period; neither is inherently a strong or weak trade.
- Familiar geometry: bodies and shadows retain actual price coordinates, but visual similarity to other candle conventions can cause mistakes.
- Testable interpretation: price conditions are easy to state explicitly, while subjective labels such as accumulation or strong momentum require additional evidence.
Begin by checking several candles against their actual values, including a red hollow and a green filled example. Then choose one hypothesis and evaluate its complete trading rules. A clearer display can help inspection, but does not replace execution assumptions, risk controls or later-sample evaluation.
Frequently Asked Questions
Why can a red candle be hollow?
Its close is above its own open but below the previous close. For example, with previous close 100, an open of 95 and close of 98 produce an intraperiod recovery while retaining a close-to-close decline.
Why can a green candle be filled?
Its close is below its open but above the previous close. For example, previous close 100, open 105 and close 102 show an intraperiod decline while retaining a close-to-close gain.
Are hollow candles more accurate than ordinary candles?
They display the same underlying OHLC information using an additional visual distinction. They can make comparisons easier to see, but the style alone does not establish better predictions or trading performance.
Are hollow candles the same as Heikin Ashi?
No. Hollow styling preserves ordinary candle prices, while Heikin Ashi calculates transformed values. Keep the displayed series and executable price assumptions distinct.
What happens when the close equals the open or previous close?
A close equal to the open produces a zero-height body. A close equal to the previous close produces zero close-to-close change. Platform appearance can vary, so define equality explicitly in any strategy.
Can I research hollow-candle rules in native LuxAlgo?
Yes. The rules are comparisons of ordinary OHLC values. Use native charts and ask Quant, our coding agent, for explicit labels or strategy logic, then inspect and manually run the generated code. The current chart overview does not document a separate Hollow candles display option.
Read next