How Volume Spikes Confirm Candlestick Reversals
A volume spike can add context to a candlestick reversal setup, but it does not prove that price will reverse. Look for a completed pattern at a price level identified in advance, compare its activity with a consistent baseline, and define the entry and invalidation before taking a trade.
Use LuxAlgo’s native charts to examine price and volume together, then ask Quant to help build and test the rule. The useful question is whether a specified volume condition improves that strategy after costs—not whether a candle looks convincing in hindsight.
Steps to Evaluate a Volume Spike at a Reversal
Choose a Comparable Volume Baseline
A spike means unusually high reported activity relative to a stated comparison. Two or three times an average can be a test threshold, but it is not a universal definition or a proven reliability ranking.
For example, a completed bar with 240,000 shares against a preceding-bar average of 100,000 has 2.4 times average volume, or 140% more. Specify the averaging window and whether the current bar is excluded. Do not compare an unfinished bar with completed bars without accounting for the difference.
Intraday activity varies through the session. Relative Volume at Time provides a time-matched comparison. Keep the symbol, feed, session, and units consistent: shares, contracts, and forex tick counts are not interchangeable.
Define the Price Pattern and Its Context
Mark support or resistance before the signal appears. An eventual turning point is obvious only after later prices arrive; a live strategy needs a rule that was available at the decision time.
| Pattern | Price features to define | What volume can add |
|---|---|---|
| Hammer | Small body near the top of the range and a long lower wick after a decline | Compare activity on the completed candle with the chosen baseline |
| Shooting star | Small body near the bottom and a long upper wick after an advance | Investigate whether elevated activity improves a bearish setup |
| Engulfing | Second real body contains the preceding body, with direction and prior trend specified | Specify whether the test uses the second candle’s volume or both candles |
| Doji | Open and close close together under a defined tolerance | Activity adds context; the doji alone has no fixed reversal direction |
TradingView’s hammer explanation emphasizes its occurrence during a decline. Its pattern reference is useful for checking definitions. Different detectors use different body, wick, and trend tolerances, so record yours.
High volume does not require a wide candle. A narrow range with heavy activity and a wide range with little activity are both possible. Total volume does not identify institutional traders, buyer aggression, or the motive behind a wick.
A Worked Bullish Reversal Setup
Consider a hypothetical stock declining toward support marked near $50. A completed candle opens at $50.60, reaches $50.90, trades down to $49.80, and closes at $50.80. Its $0.20 body and $0.80 lower wick fit a possible hammer definition. Suppose volume is 240,000 shares versus the 100,000 baseline above.
This is a candidate setup, not an instruction to buy. An example rule might require a later trade above $51.00, place invalidation below the $49.80 low at $49.70, and cancel an untriggered entry after two bars. Those parameters are illustrative choices to test.
With a $150 risk budget and $0.10 per-share cost allowance, planned per-share risk is $51.00 − $49.70 + $0.10 = $1.40. Position size is floor($150 ÷ $1.40) = 107 shares, or $149.80 planned risk. Gaps and slippage can increase the actual loss.
If resistance was already identified near $53.60, that price represents $2.60 of gross potential reward against $1.30 of price risk, or 2:1 before costs. The target is not guaranteed, and its attractiveness changes if the entry fills higher. Follow position-sizing principles and account for other open exposure.
Set Entry and Exit Rules Before Testing
- Entry: choose a completed close, a later breakout trigger, or another explicit rule. You cannot use the final volume of a candle to enter earlier within that same candle.
- Stop: use the setup’s invalidation and an appropriate buffer. A volume spike does not guarantee that the stop will hold or fill at its trigger price.
- Target: use a premarked level or a specified exit method. “Volume resistance” needs a precise price reference, not an assumed profit target.
- Time exit: if confirmation fails to arrive, define how many bars you will wait.
- Alternative exit: a moving-average break or declining volume can be tested, but neither should become a discretionary rule chosen after seeing the outcome.
For bearish setups, define the mirrored price conditions and consider short-sale availability, borrowing costs, and instrument-specific rules. Simply labeling the volume “bearish” does not create a complete short strategy.
Give Other Indicators a Specific Role
RSI can describe momentum, a moving average can define trend, and support or resistance can define location. An RSI higher low against a price lower low is a divergence candidate; it does not establish a strong buy signal by itself.
A MACD crossover with high or low activity likewise has no universal signal-strength rank. Related indicators often summarize overlapping data. Compare one controlled change at a time, and wait for any required swing confirmation before recording an entry.
Use LuxAlgo’s Native Charts for Volume Context
Native volume profiles show activity distributed by price. They can help locate a reference area, but do not measure the same thing as a spike in volume over time. Session and Rolling profiles require footprint data; Visible Range uses candle volume and depends on the visible chart range.

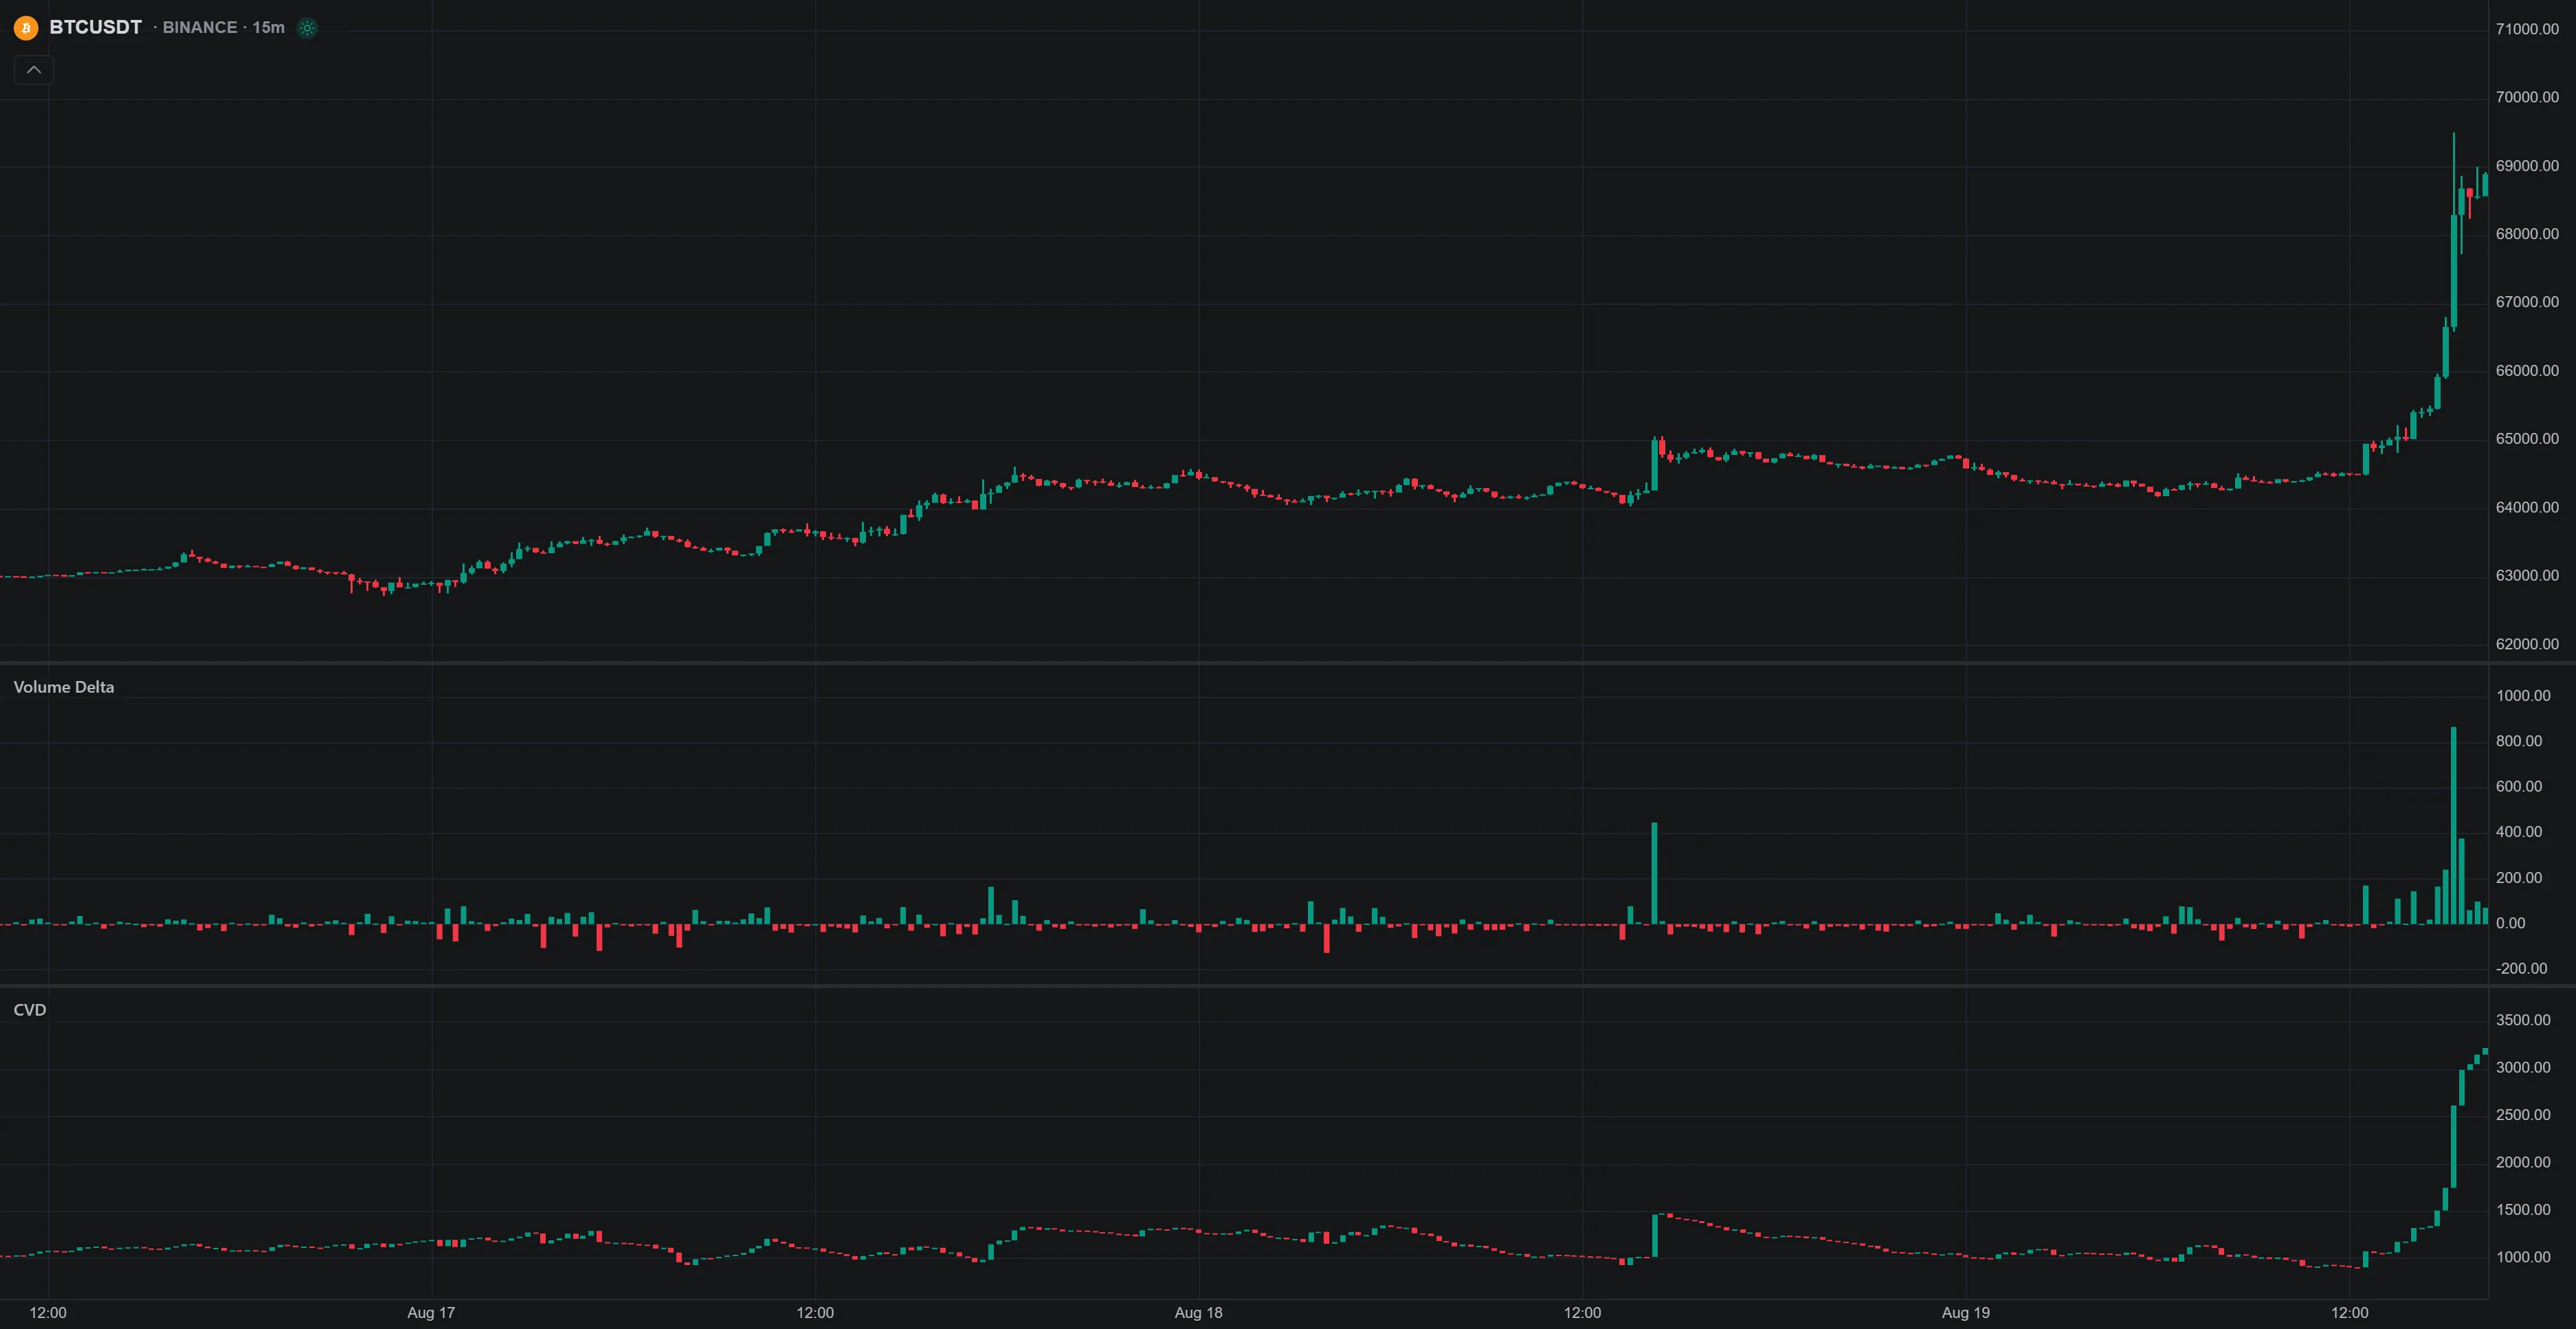
Native Volume Delta and CVD offer another view on supported footprint symbols and fixed-duration intervals. Total delta compares buy and sell volume; CVD accumulates delta from its selected anchor. Monthly chart intervals are unsupported, and data availability must be checked.
Build and Validate the Strategy with Quant
- Specify the pattern. Include body and wick ratios, trend definition, and the support or resistance rule.
- Specify the activity filter. Give the baseline, threshold, session, and treatment of missing or unfinished data.
- Specify the trade. Include entry timing, order type, stop, target, expiration, and position sizing.
- Review the code. Check that sample candles and trades match the written rule. Identify any approximation if requested footprint or lower-timeframe inputs are unavailable.
- Run a controlled comparison. Use native strategy properties for costs and review drawdown and individual trades. Compare the pattern alone with the same pattern plus volume, then evaluate later data not used to select settings.
Compilation and a positive backtest do not establish correctness or future profitability. Avoid assuming that every TradingView candlestick detector or private toolkit is available identically on native charts. Check the selected Library entry and implementation.
Video: Choose a Time-Matched Volume Comparison
This Trade Nation tutorial with TradingView explains a relevant volume-baseline tool. It helps with activity comparisons; it is not evidence that a particular candlestick pattern predicts reversals.
Use Education and Feedback to Improve the Test
Use LuxAlgo’s documentation to check tool definitions, and record the settings and examples when discussing a strategy with other traders. Feedback can uncover an unclear rule or data problem. Validate suggested changes on the same criteria rather than treating community agreement as proof of an edge.
FAQs
What does a volume spike indicate?
A volume spike indicates unusually high reported activity relative to a defined baseline. It does not identify participants or guarantee a direction. Evaluate the price pattern, location, session, and subsequent confirmation, then test whether the volume condition improves the strategy.
What is a high volume candle?
It is a candle whose reported volume is elevated relative to a specified comparison. There is no universal two-to-three-times threshold, and high volume does not require a wide price range. Use completed candles or account for elapsed time when comparing an unfinished candle.
Read next