Concept
Shooting Star
Shooting Star is a Chart & Candlestick Patterns concept. The Library holds 3 implementations, each one a working definition you can pull into Quant.
Top Shooting Star indicators
The top custom implementations, built on the original standard Shooting Star formula.
3 total
Any of the 3 Shooting Star implementations below can become a backtested trading strategy — describe your rules and Quant writes the code.
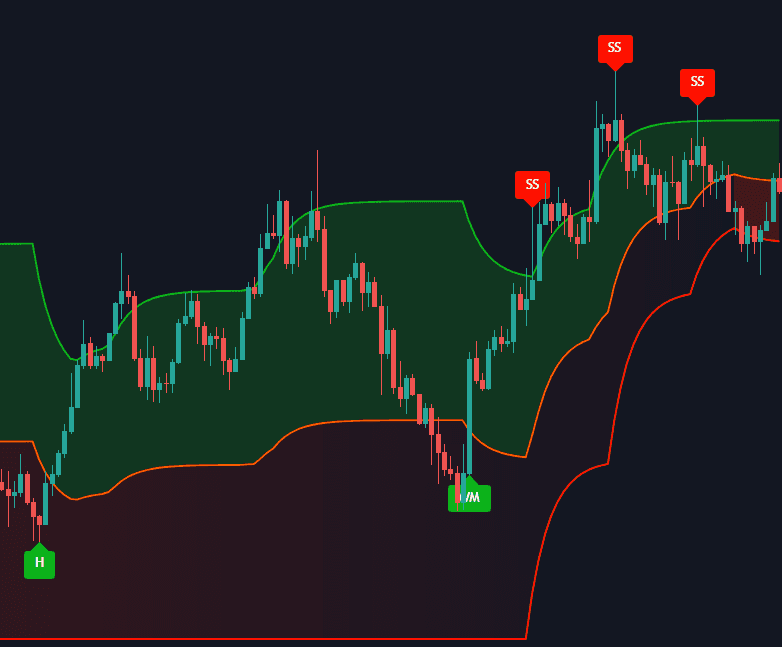
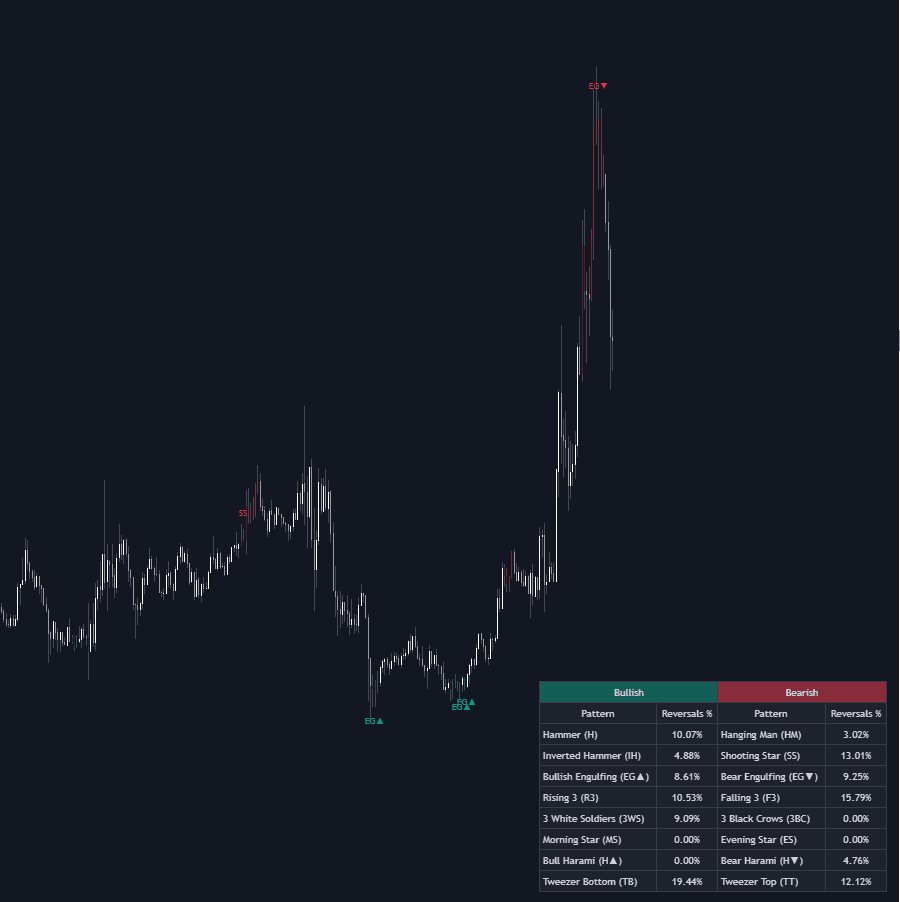
.png&w=3840&q=75)
What is a Shooting Star?
A shooting star is a single-candle bearish reversal signal from the candlestick catalog: after an advance, a candle prints with a small real body near the session's low, a long upper shadow (commonly at least twice the body's height), and little or no lower shadow. The shape records a failed auction higher: buyers extended the rally intrabar, sellers sold the excursion back down, and the close finished near where the candle opened or lower.
It belongs to the single-candle rejection family of the Japanese canon that Steve Nison's books carried west, where it plays the bearish counterpart to the hammer's bullish rejection at lows. Within the broader candlestick vocabulary it is the minimal statement of a failed advance: one session that manufactured new highs and could not keep a tick of them.
Location is the whole definition. The identical candle appearing after a decline is an inverted hammer, a potential bullish signal, so anatomy alone decides nothing. A shooting star that spikes above a prior swing high before closing back below it carries an extra read: the wick swept resting stops and found no acceptance, kin to a swing failure pattern.
Grading the candle is grading its rejection. Longer wicks relative to the body and to recent bars mean a bigger failed excursion; a close below the open adds sellers finishing in control; elevated volume says the failure happened with participation rather than in a vacuum; and the maturity of the advance behind it decides whether there is anything to reverse. The same geometry mid-range, or with a modest wick, is one of the most common false positives in candlestick scanning.
How to identify a shooting star on a chart
Every element is checkable; the discipline is refusing the candles that only half qualify.
- 1Require an advance into the candle: without a rally behind it, the geometry reads as noise or, after a decline, as an inverted hammer instead.
- 2Check the body: small, and positioned near the bottom of the candle's range, either color acceptable.
- 3Check the upper shadow: conventionally at least twice the body's height, the longer the more emphatic the rejection.
- 4Check the lower shadow: minimal to none, so the close sits near the session's low end.
- 5Weight the location: at a tested resistance level, a measured objective, or above swept equal highs, the candle carries its full meaning.
- 6Define the trade points: conventional trigger on a break of the star's low, invalidation above the wick's high.
How traders use it
- As a top-reversal trigger at a location: a shooting star into a tested resistance level, supply zone, or measured objective is the standard setting; entries commonly trigger on a break of the star's low with the stop above the wick's high.
- As an exhaustion tell within confluence: paired with overbought oscillator readings, an upper volatility-band tag, or fading momentum, the long rejection wick argues the advance is being sold into rather than bought.
- As a stop-run marker: when the wick pokes above equal highs or a prior swing and closes back inside, the candle doubles as evidence of a liquidity grab, which makes it useful to structure-based traders outside candlestick systems too.
- With follow-through demanded: many rule sets act only when the next candle confirms, a close below the star's low or a bearish engulfing bar, converting the one-candle warning into a two-candle sequence.
- At second tests: a shooting star printing at the second peak of a developing double top stacks candle-level rejection on structure-level failure, one of the cleaner confluence reads at highs.
Shooting Star vs. look-alike candles
Inverted Hammer: Anatomically identical; only context differs. After an advance the candle is a bearish shooting star; after a decline it is a potentially bullish inverted hammer that most conventions ask the next candle to confirm.
Pin Bar: The pin bar is the western, range-based cousin: a long tail rejecting one extreme, defined on bars rather than real bodies and used in both directions. A bearish pin at highs and a shooting star often tag the same candle.
Evening Star: The evening star is a three-candle top pattern with a small star as its middle act; the shooting star makes its rejection statement in a single candle.
Concept family
Chart & Candlestick Patterns
84 concepts mapped · 84 in the Library
Shooting Star FAQ
Turn Shooting Star into a trading strategy.
Take any implementation from this page into Quant, then build on it, backtest it on real data, and keep refining it in conversation.