ICT Immediate Rebalance Concept Explained
An immediate rebalance is a three-candle price pattern in ICT analysis in which the third candle returns into the first candle’s range while closing in the direction of the move. The idea is associated with Michael J. Huddleston, known as the Inner Circle Trader. It describes a particular overlap, not a guarantee that price will continue or that every imbalance in the market has disappeared.
This guide explains the pattern, the stricter rules in LuxAlgo’s published toolkit source, and the surrounding liquidity, block, void and session features. Use it as a setup to investigate within a defined strategy. The historical charts illustrate the concepts; the current native workflow appears below.
Immediate Rebalance Versus a Fair Value Gap
Label three consecutive candles A, B and C. In a basic bullish fair value gap, C’s low is above A’s high. In a bearish gap, C’s high is below A’s low. The first and third candles therefore leave a non-overlapping price interval. Candle B may have traded through that interval: the pattern does not establish that no trades occurred there or that price was economically unfair.
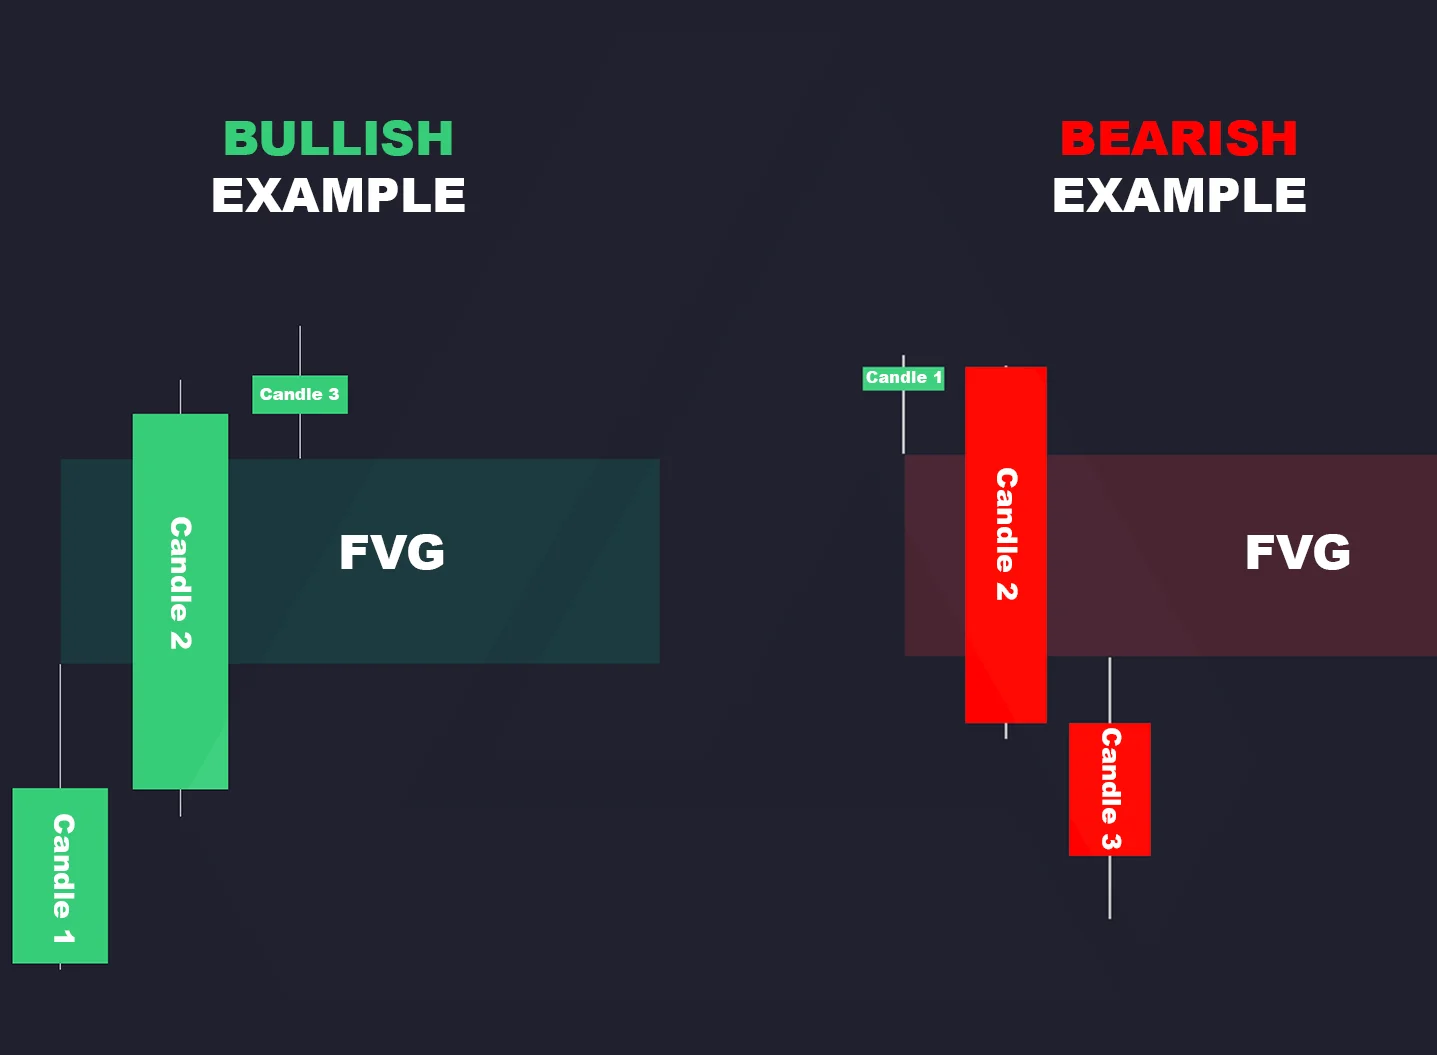
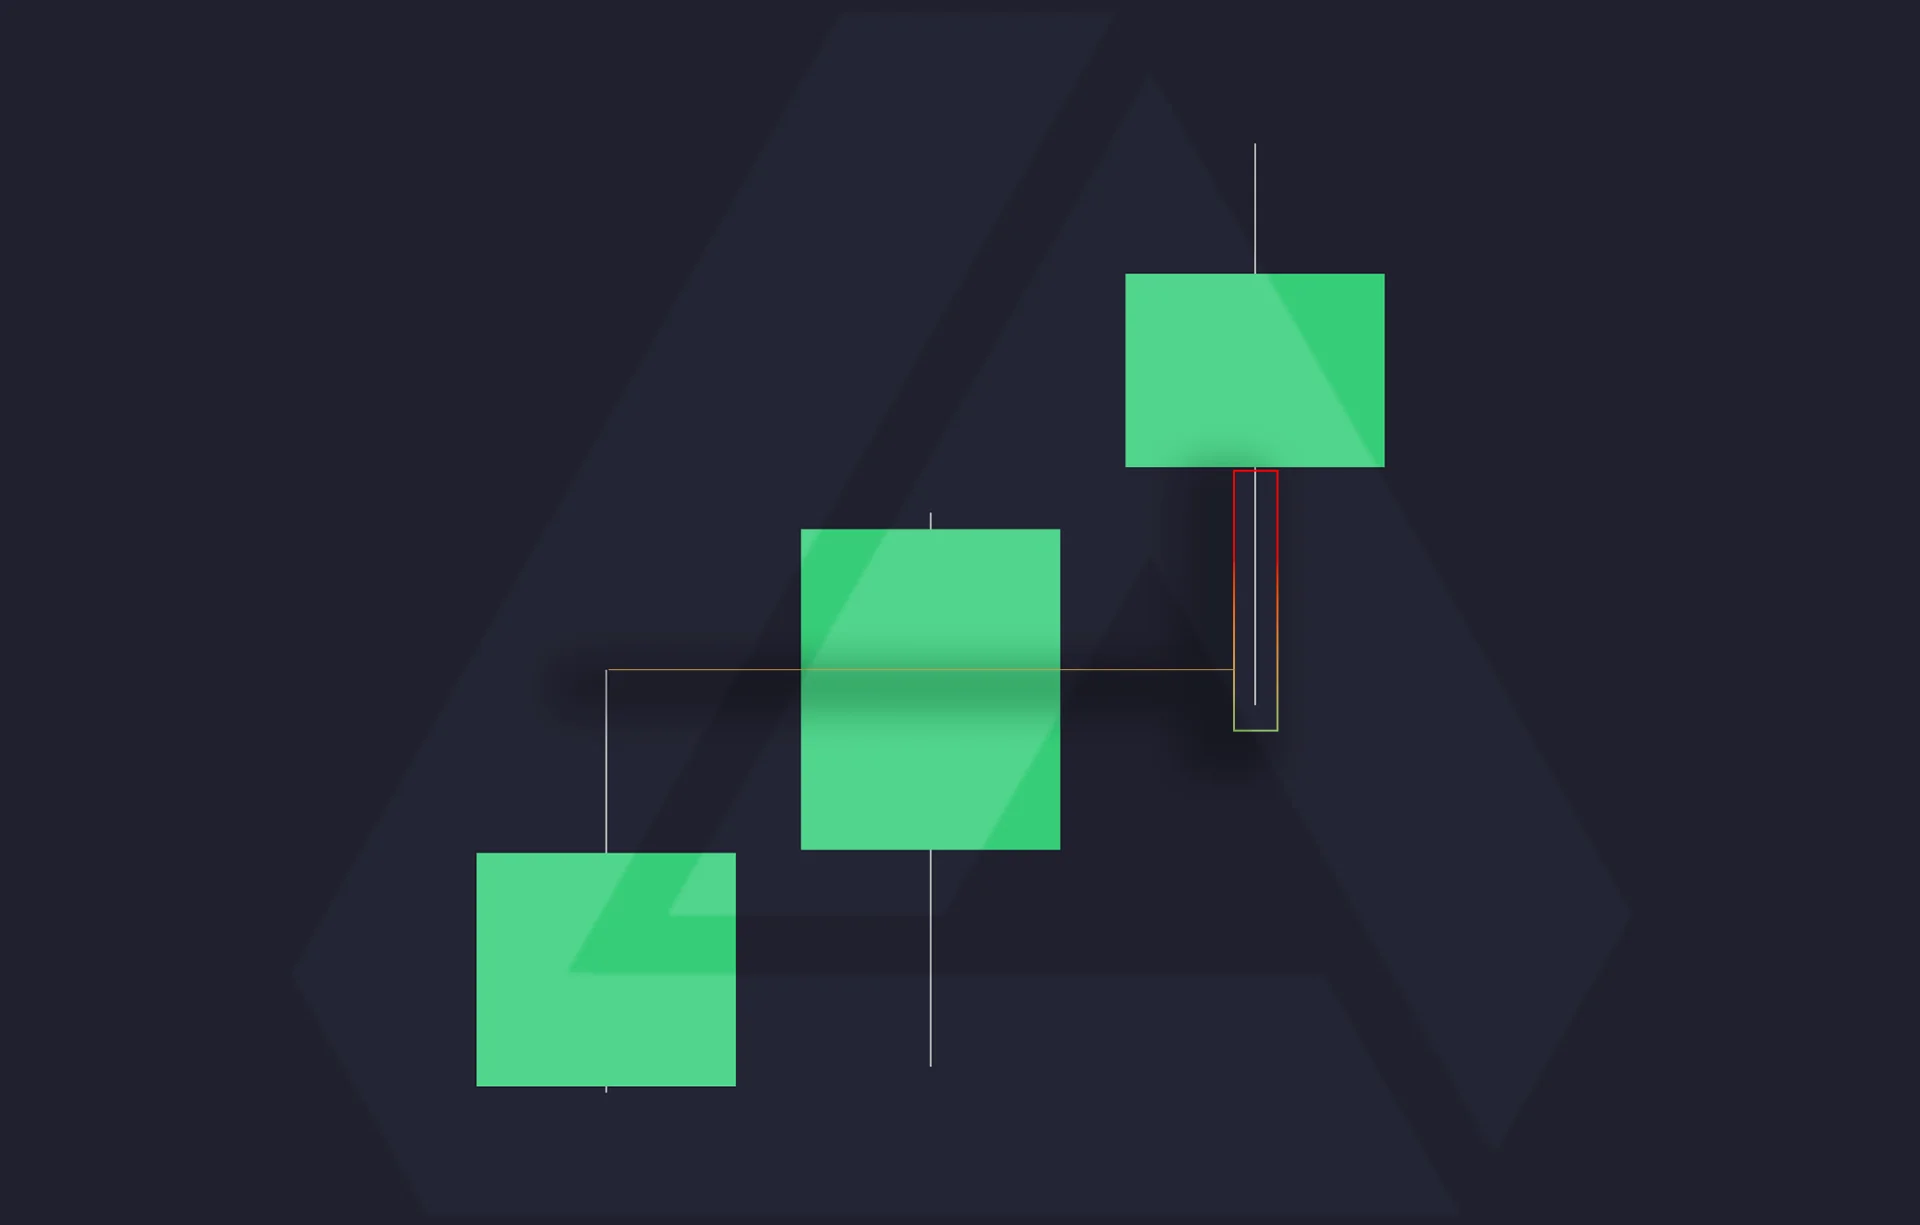
In the bullish immediate-rebalance illustration, C instead dips below A’s high and closes above it. The bearish version reverses that geometry. A later return to a completed FVG is a different sequence from overlap during the third candle itself. Neither formation obliges the market to retrace, continue or reach a target.
The Toolkit’s Actual Candle Conditions
The ICT Immediate Rebalance Toolkit Library page provides the published source. Its detection is more specific than simply finding three overlapping candles. For the inspected version, the conditions are:
| Condition | Bullish detection | Bearish detection |
|---|---|---|
| Third candle’s extreme | C low is below A high but above A close | C high is above A low but below A close |
| Second candle’s close | B closes above A high | B closes below A low |
| Third candle’s close | C closes above A high and above B close | C closes below A low and below B close |
| Equality at a boundary | Strict inequalities: equality fails the relevant test | Strict inequalities: equality fails the relevant test |
Notice the comparison with A’s close, rather than always using the body edge nearest the relevant wick. The script does not require all three candles to have the same color. Its 25%, 50% and 75% reference lines divide the first candle’s relevant wick; those percentages are not success probabilities.
A Concrete Bullish Example
Suppose A has a high of 100 and closes at 98. B closes at 102. C trades down to 99 and closes at 103. Then 98 < 99 < 100, both later closes are above 100, and 103 is above 102. Those values meet the bullish detection conditions. If C’s low were exactly 100, this implementation would not label the same pattern.
This example identifies a setup, not an order. An illustrative later fill at 103.2, planned stop at 98.8 and target at 112 would have 4.4 price units of planned risk and 8.8 of potential reward, a planned reward-to-risk value of 2 before costs. Define sizing and order type separately. A close-based decision cannot assume a fill before the close was known; a stop can slip and a limit order may not fill.
Detection and Later Validation Are Different
The source’s Confirmation (Bars) setting defaults to two and accepts one to five. On that exact later bar, after it closes, the script checks whether the low is below A’s high for a bullish setup, or the high is above A’s low for a bearish setup. If so, it changes the original marker to a failed-pattern symbol.
That implementation detail matters: it is a check on the selected later bar, not a continuous test of every intervening candle. A marker that has not been changed to a failure symbol does not prove two uninterrupted extension candles, a profitable entry or survival of an independently chosen stop.
A test using the later classification must wait until that classification is available. Do not use the final historical symbol as though it were known on the detection candle. Live detection also uses changing candle values, so require a completed bar for a close-based research rule and inspect how the selected platform handles updates.
Use the Supporting Modules as Context
The toolkit combines several price-based annotations. More annotations do not automatically produce a stronger strategy. Choose the role of each module before examining outcomes, and compare whether adding it improves a defined test on later data.
Buyside and Sellside Liquidity
These labels mark price-derived levels near selected swings, where traders may hypothesize that orders cluster. The indicator cannot see all stop orders, identify their owners or prove that institutions deliberately caused a sweep. A move beyond a level can continue as well as reverse.
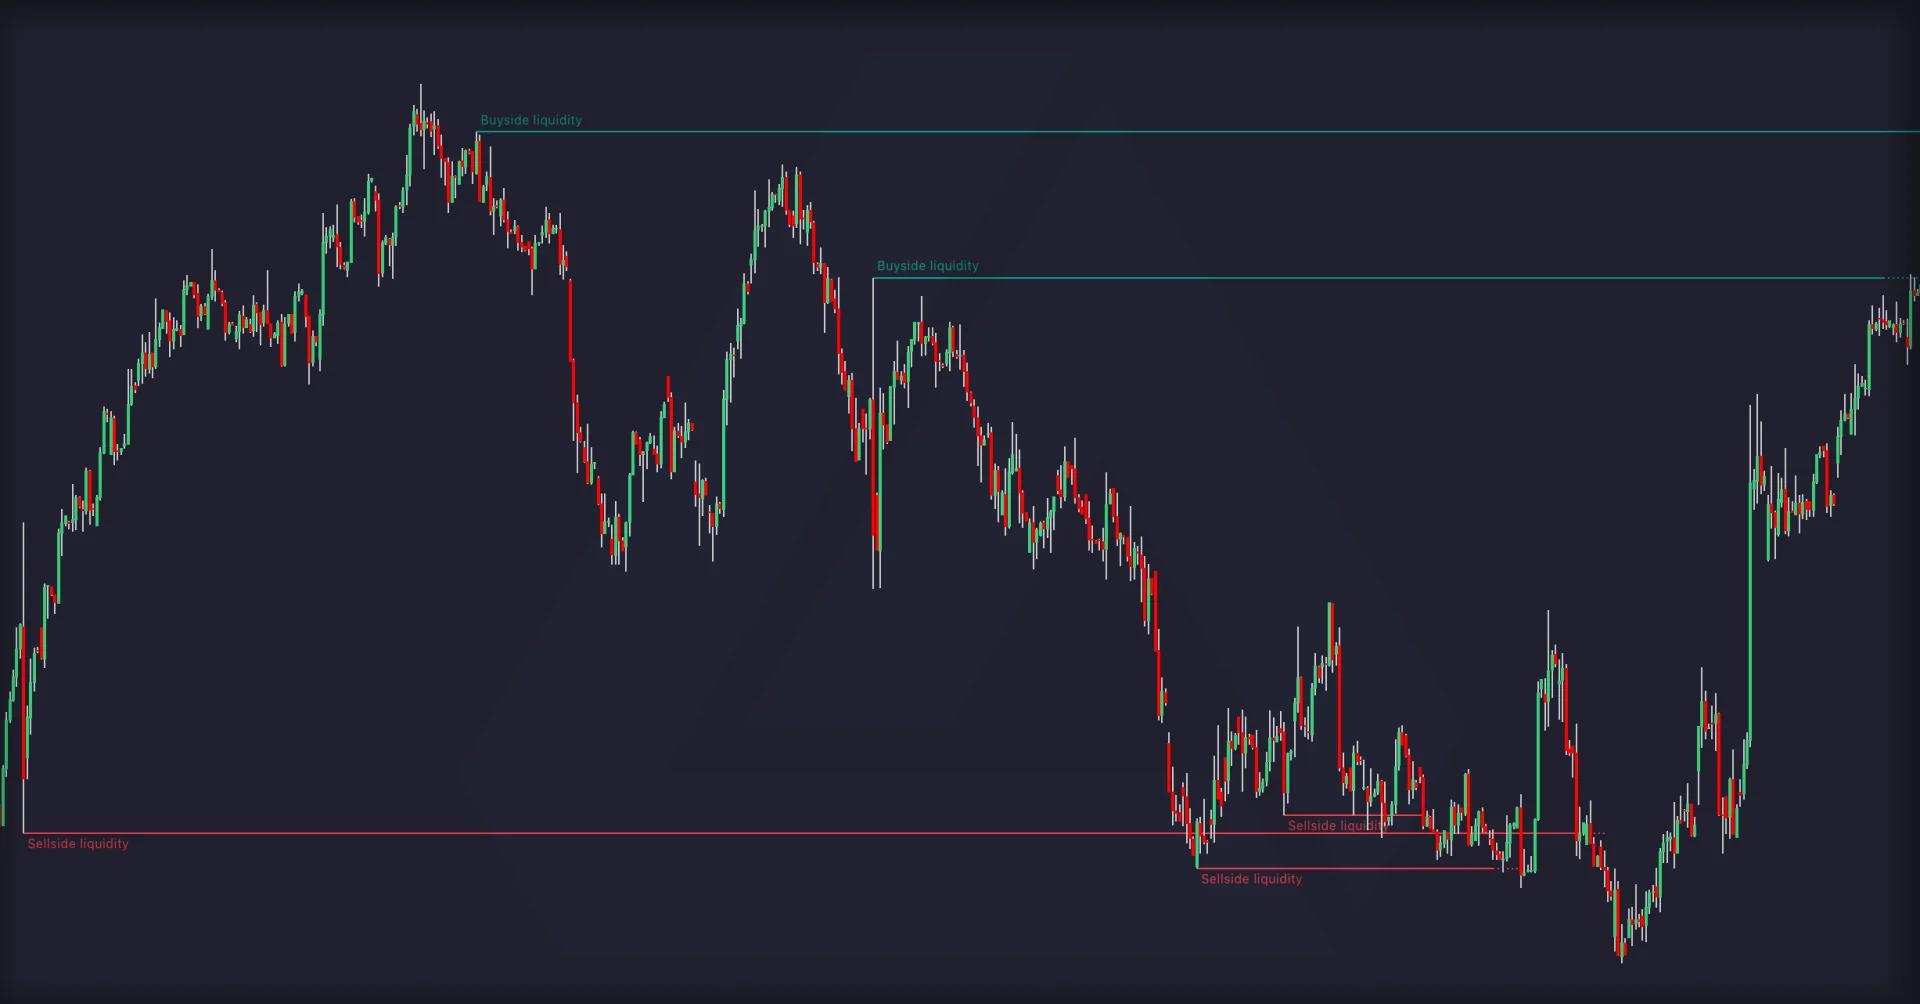
The inspected source’s Timeframe selection scales the pivot lookback on chart candles. It does not request a separate higher-timeframe candle series for this module. Selecting one day on a five-minute chart should therefore not be described as importing the exact daily-chart pivots. Verify the resulting levels against the intended research definition.
Order Blocks and Breaker Blocks
Order blocks mark zones derived from swing and candle rules. A breaker reflects invalidation of a prior zone under the selected price rules, rather than any ordinary touch of an order block. The toolkit exposes swing length, closing-price versus wick mitigation, and whether to use candle bodies for detection.
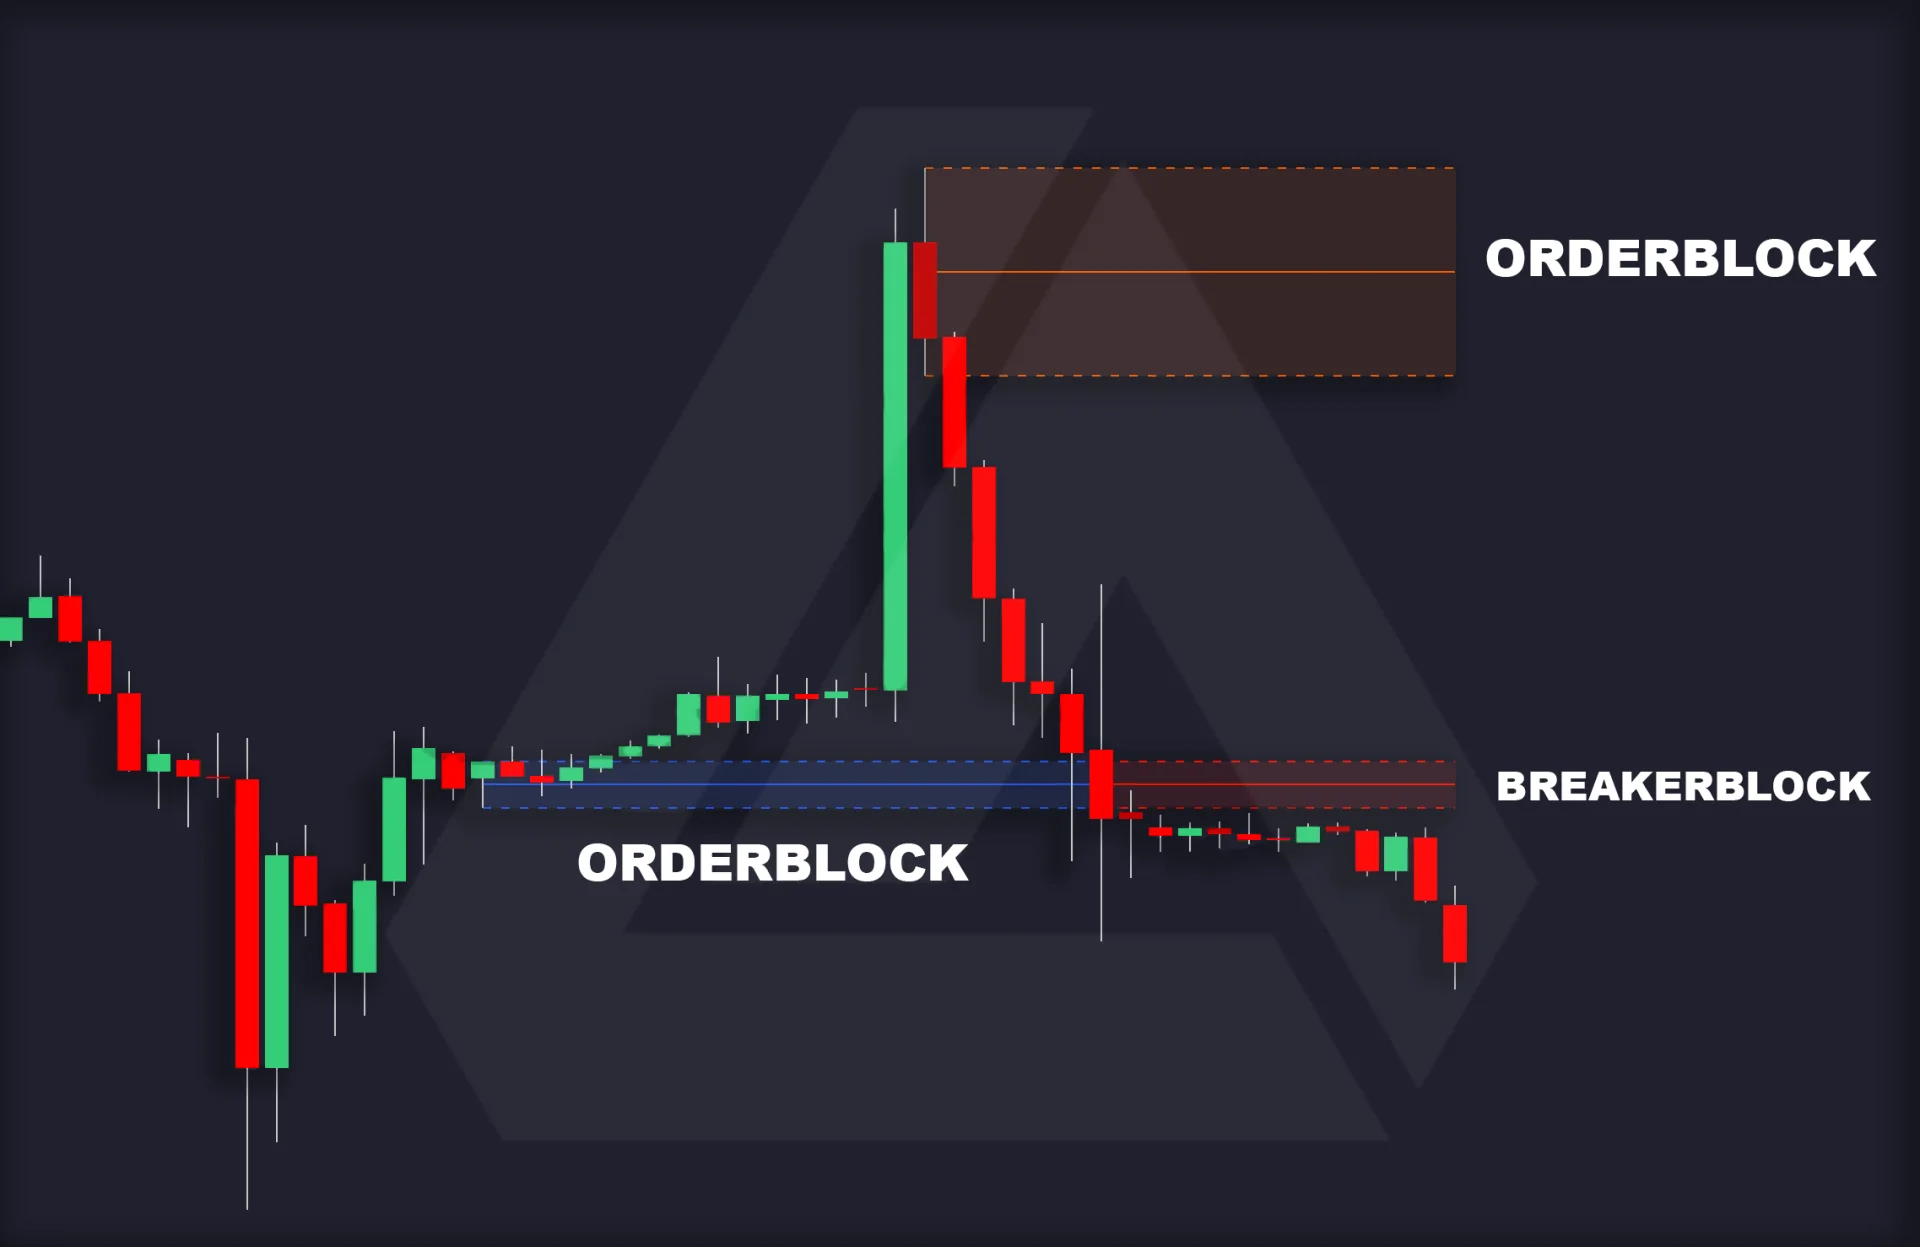
Record when the zone first became identifiable, which boundary invalidates it, and whether a retest is required for entry. A rectangle extending back to an earlier candle does not mean the completed zone was known at that earlier time.
Liquidity Voids
The void module highlights a separate price-gap structure using a width filter based on ATR. It can optionally ignore adjacent-candle price gaps and change or remove regions as price revisits them. In the inspected source, Ignore Price Gaps belongs to this void module; it is not an immediate-rebalance detection setting.
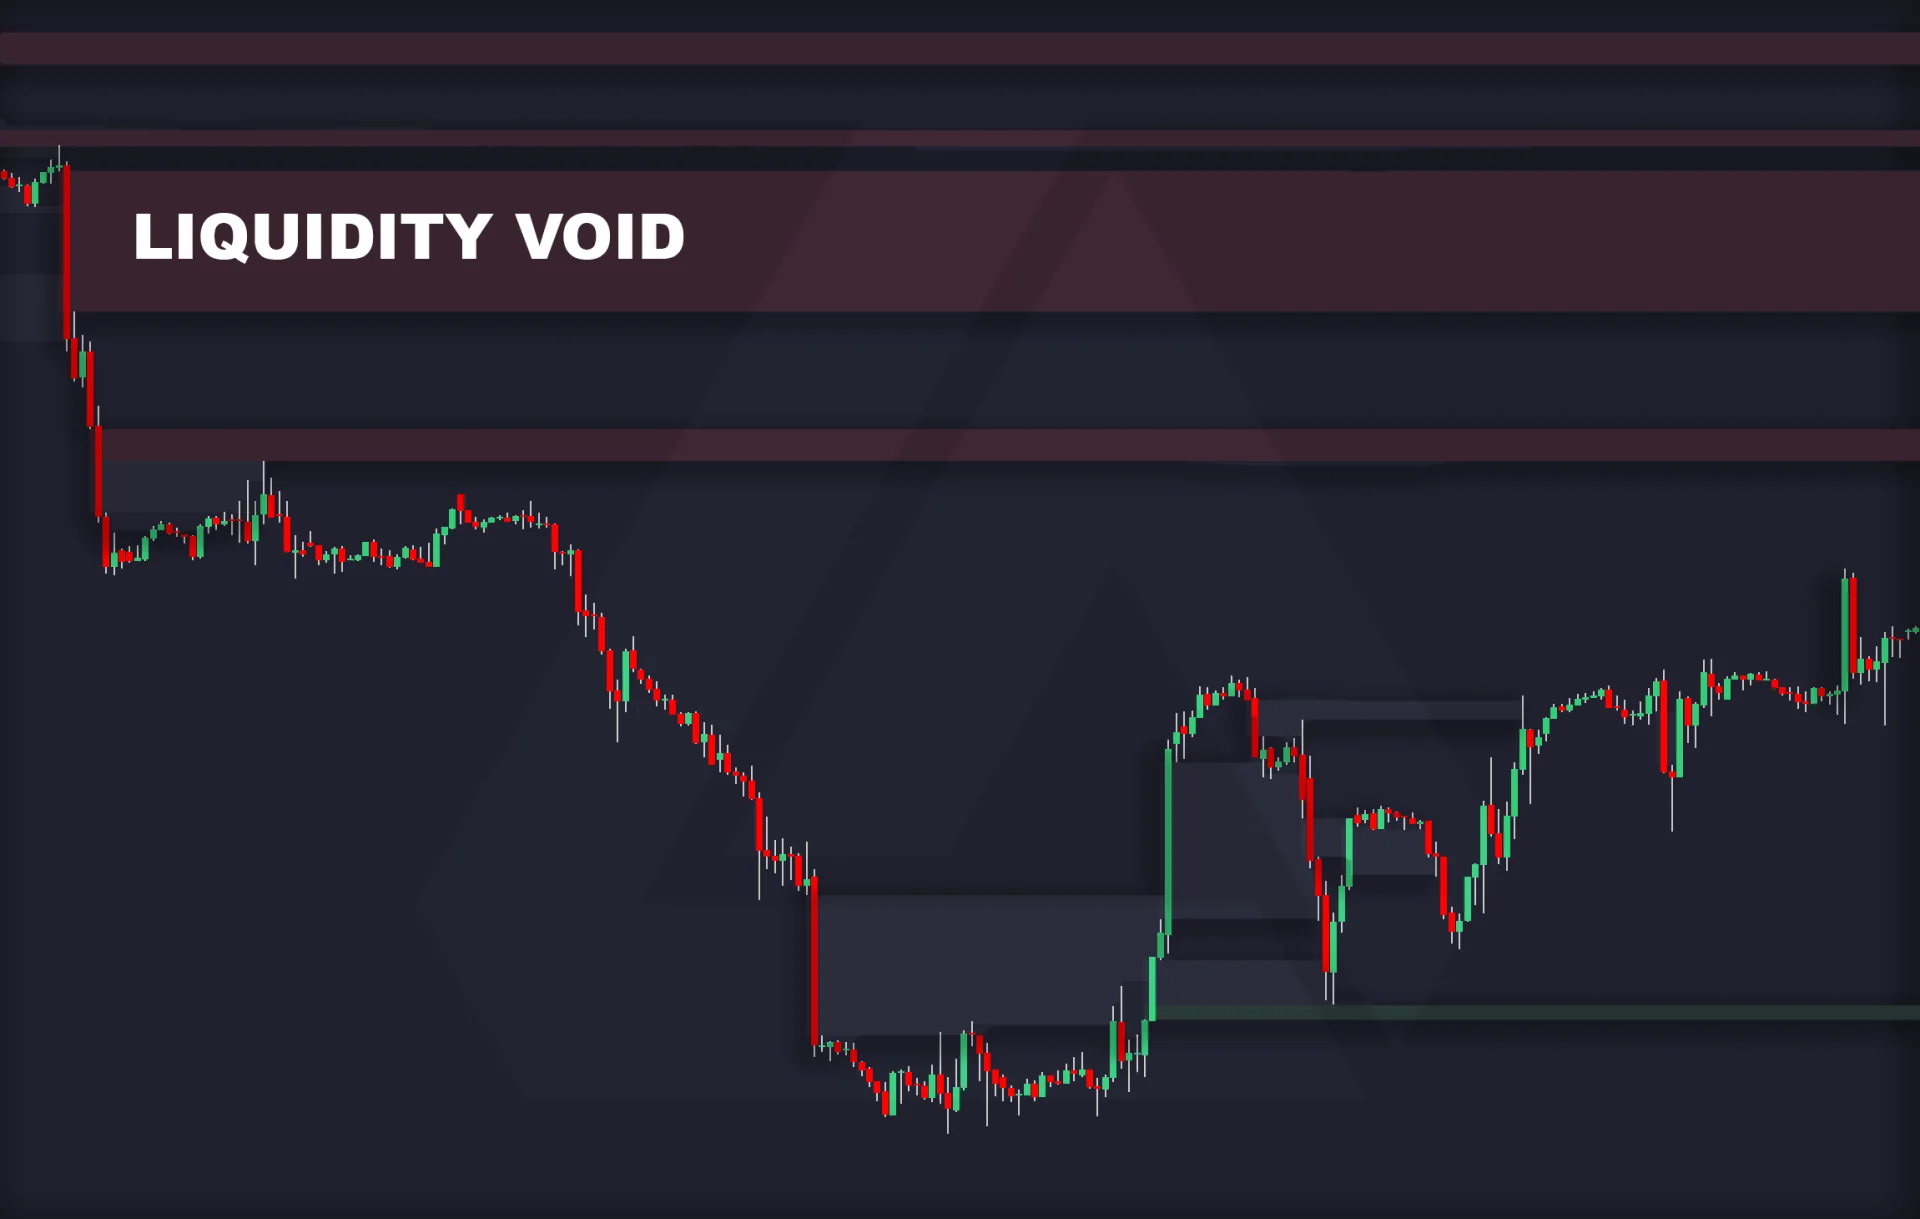
A visual void is not proof of absent volume, a mandatory future destination or a single cause of the move. Keep the chart interval, history and width setting fixed when comparing examples.
Macro Timings
Macros highlight selected intraday windows. They can help organize time-of-day comparisons, but a colored window does not prove that a central algorithm controls price or identify a perfect entry time.
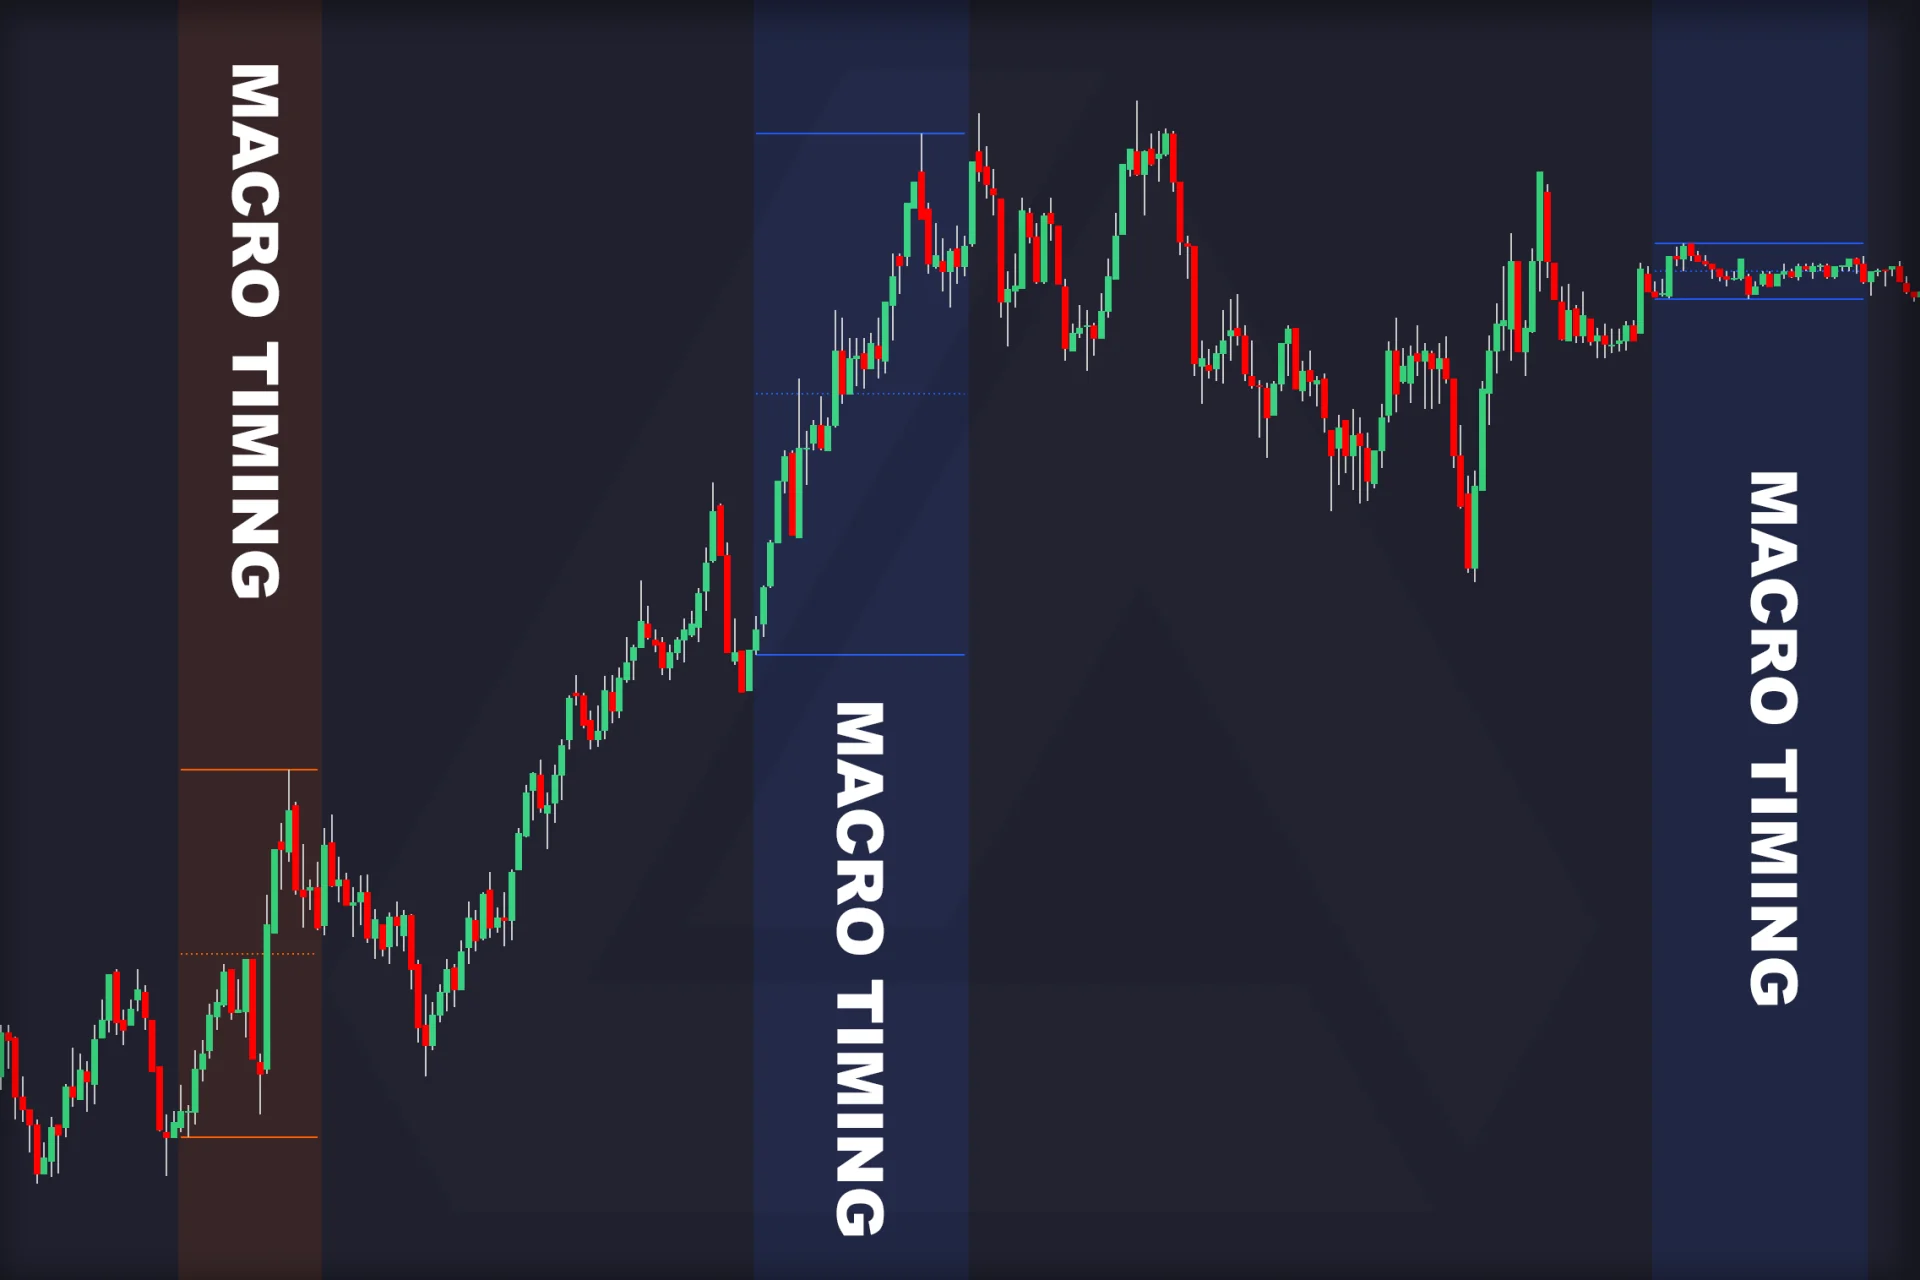
The inspected published source uses a fixed UTC−5 offset for both its London-labeled and New York-labeled windows, with macro rendering on minute charts up to 15 minutes. It does not automatically follow seasonal New York or London clock changes. For a pair such as GBP/JPY, a London-session hypothesis still needs an explicit date-aware time definition and a test; the label alone is insufficient.
Build a Reproducible Research Plan
| Decision | Specify before testing |
|---|---|
| Market and timing | Symbol, data source, candle interval, session and time reference |
| Setup and context | Exact rebalance rules; optional swing, block, void or macro conditions |
| Entry and invalidation | When information becomes available, order type, expiry, stop and target |
| Evaluation | Costs, sizing, losing examples, later data and comparison with simpler rules |
For example, test a bullish rebalance only after a predefined block retest, then compare it with the same entry rule without that filter. Keep failures and missed fills in the results. Several related price-based tools may repeat the same information, so agreement between them is not independent evidence of an edge.
Research It in the Current LuxAlgo Platform
Start from the toolkit’s current Library page and Open on Quant Charts. Confirm which implementation and settings you are using. The historical TradingView-oriented illustrations above are useful concept examples, while the native platform provides the current starting point for research.
Ask Quant, our coding agent to express a supported strategy hypothesis with the exact detection and delayed-validation rules. Inspect the generated code and run it manually. Review strategy settings and individual trades, including costs, standard candle prices and an evaluation period not used to tune the rules.
Check data coverage when comparing results. A single exchange feed is not the entire market, and changing the source or interval can change candle patterns. Native executed-volume tools, where supported, measure something different from this toolkit’s inferred liquidity labels.
Historical Toolkit Walkthrough
LuxAlgo’s August 5, 2024 toolkit walkthrough demonstrates the pattern and supporting modules. Treat its interface and promotional framing as historical. Its title is not evidence that rebalances are superior to FVGs; use the precise conditions and limitations above when evaluating either setup.
Frequently Asked Questions
Does an immediate rebalance guarantee continuation?
No. It describes an overlap and closing-price pattern. Neither the pattern nor the absence of one particular FVG establishes the direction of the next move.
Is touching the first candle’s extreme enough?
Not in the inspected LuxAlgo source. Its inequalities are strict, and the second and third closes must also satisfy directional conditions.
What does the Confirmation Bars setting validate?
On the selected later closed bar, the source checks a specific low or high against the original reference and can mark the pattern as failed. It is not a continuous test of every intervening candle or a profitability test.
Do the liquidity labels show actual stop orders?
No. They are inferred from price structure. The chart does not reveal all resting orders, their owners or the reason for a move.
Do the macro windows automatically adjust for daylight saving?
The inspected published source uses fixed UTC−5 windows. Verify the implementation and date-aware time conversion rather than assuming the labels follow local seasonal clocks.
Read next