Shares Outstanding vs Float: Float Squeeze Math
Two share counts describe every listed company, and traders who confuse them misjudge how a stock will move. Shares outstanding is the total number of shares in investors' hands, the figure Investor.gov uses to define market capitalization. Float is the smaller subset that can actually change hands on any given day, once shares locked up by insiders and other restricted holders are set aside. The gap between the two decides how much buying or selling it takes to move the price, and when a large short position sits on a small float, the arithmetic can produce the sharp, self-feeding rallies known as short squeezes or float squeezes. This guide defines both counts, explains short selling and short interest as the SEC, FINRA and Investor.gov describe them, works through the squeeze arithmetic with hypothetical numbers, sets out the risks, and shows how to monitor low-float names in Quant Charts. It uses no company examples and no thresholds presented as rules.
Shares Outstanding
A company's charter authorizes a maximum number of shares. Of those, the shares it has actually sold to investors and not bought back are issued and outstanding. Shares the company has repurchased and holds as treasury stock are issued but not outstanding. The count changes with new issuance, employee stock compensation, buybacks and splits, and the current figure appears on the cover page of the company's quarterly and annual reports.
Investor.gov defines market capitalization as the current public market price of one share multiplied by the number of total outstanding shares. That is why shares outstanding is the denominator for per-share figures such as earnings per share and book value per share: it counts every claim on the company, whether or not the holder is likely to trade.
Float
Float, sometimes called free float or public float, is shares outstanding minus shares that are not freely tradable: holdings of officers, directors and other insiders, shares subject to lock-up agreements after an offering, restricted stock that cannot yet be sold, and stakes held by controlling shareholders or governments. Large institutional holdings of unrestricted stock are usually counted in the float because they can be sold, which is a common point of confusion. Index providers weight most major indices by float rather than by shares outstanding, so the float is the number the market itself treats as the supply available for trading.
Two figures follow. The float percentage is float divided by shares outstanding, the share of the company that is in public hands. The absolute float, in shares, is what matters for liquidity: a company with a small float will see its price move on order sizes that a large-float company absorbs without a ripple.
| Count | What it includes | What it is used for |
|---|---|---|
| Authorized shares | Maximum the charter permits | Ceiling on future issuance |
| Shares outstanding | All issued shares held by investors, insiders included; excludes treasury stock | Market capitalization, EPS, book value per share |
| Float | Shares outstanding minus insider, restricted and lock-up holdings | Tradable supply, index weights, short interest as a percentage |
| Short interest | Shares sold short and not yet covered, on a settlement date | Percent of float and days-to-cover |
Short Sales, as the Regulators Describe Them
Investor.gov describes a short sale as the sale of a stock the investor does not own, settled by delivering borrowed shares, with the position closed later by buying shares in the market and returning them to the lender. The SEC's summary of Regulation SHO adds the detail that matters for squeezes: unlike a long position, where risk is limited to the amount invested, a short position exposes the seller to unlimited loss because a stock can keep rising. The brokerage lends the shares from its own inventory, other customers' margin accounts or another lender, charges interest on the loan, and requires the short seller to pay any dividend to the lender.
The SEC also explains the mechanics that constrain shorting a small float. A broker must locate shares to borrow before executing a short sale. When shares are scarce, borrowing fees rise and locates fail, and a sale made without arranging a borrow is a naked short that can result in a failure to deliver, which Regulation SHO, in force since 2005, was adopted to curb. In a low-float stock the borrow supply is a fraction of an already small number, which is why short positions there are expensive to hold and hard to exit.
Short Interest and How It Is Measured
FINRA describes short interest as a snapshot of the total open short positions on brokerage firms' books for a security on a given settlement date. Firms report it twice a month, around mid-month and month-end, and FINRA publishes it free. FINRA is explicit that its daily short sale volume file is not short interest: the daily file counts trades marked short on a given day, many of which are closed the same day, while short interest counts positions still open on the settlement date.
The Library's short interest entry explains how the figure is scaled. Percent of float divides short interest by the float, showing how crowded the short side is relative to the shares actually available. Days-to-cover divides short interest by average daily volume, estimating how many normal sessions it would take every short seller to exit. The entry also notes the staleness: the figures are published roughly eight business days after the settlement date, so they are one to two weeks old on arrival, and nothing on the price chart reveals open short positions. Commercial vendors estimate live short interest from securities-lending data, but those are modeled proxies.
The Squeeze Arithmetic
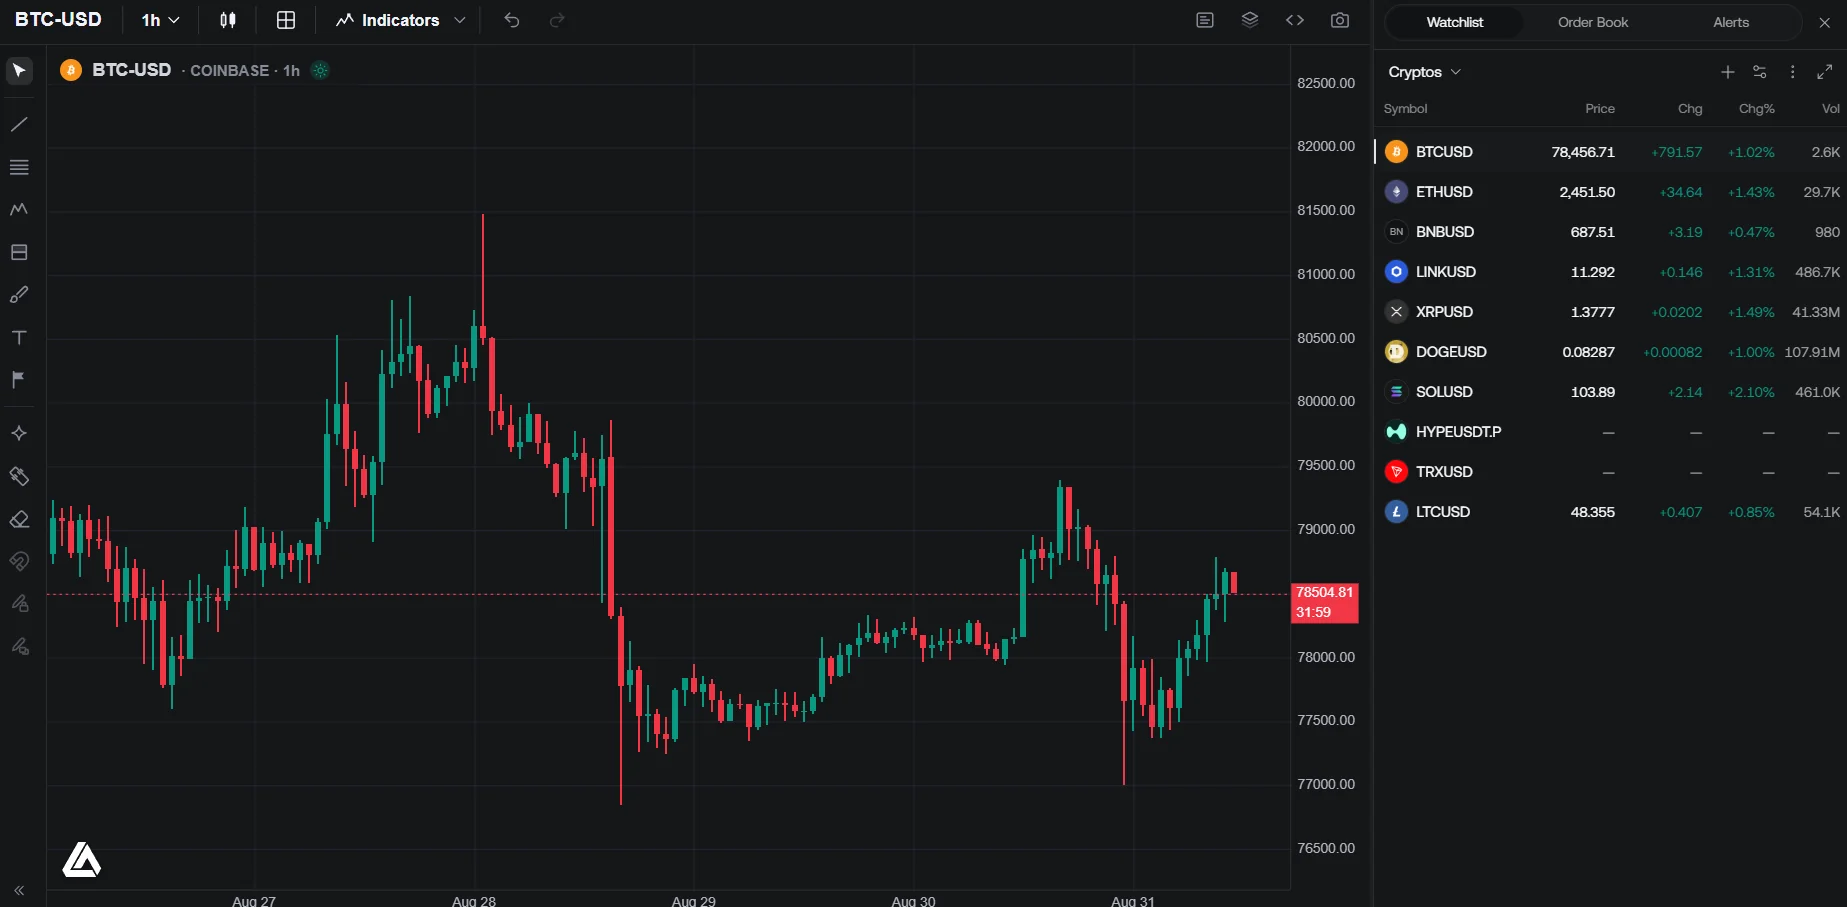
A squeeze is a supply-and-demand event. Short sellers must buy to close, so when a heavily shorted stock rises, covering adds buying pressure that pushes the price higher, which forces more covering. The Library's entry describes scarce borrow and rising loan fees tightening the vise, and concentrated call buying layering dealer hedging on top. It also states the honest base rate: genuine squeezes are episodic and rare, not a repeatable outcome.
The arithmetic uses only hypothetical figures here. Suppose a company has 100 million shares outstanding, insiders and lock-ups hold 60 million, and the float is therefore 40 million shares. Suppose short interest is 12 million shares, which is 30 percent of the float, and average daily volume is 3 million shares, giving four days-to-cover. If the price rises and short sellers try to cover half their position in one session, they need to buy 6 million shares, twice the average day's entire volume, from a float in which many holders are not sellers at any price. That imbalance, not any property of the company, is what produces the vertical move. Change the float to 400 million shares with the same 12 million short and the same 3 million daily volume, and the short position is 3 percent of float; the covering demand is a fraction of normal turnover and the price impact is modest.
Three Library entries describe what the chart shows while this happens. Relative volume expresses the session's volume as a multiple of the symbol's own baseline, which is how a covering wave is recognized in real time. ATR measures the size of the bars and rises sharply, so stops set in ATR multiples widen with conditions rather than being run by noise. Gap fill covers what happens afterwards: some gaps are traded back through to the pre-gap reference, and whether a given gap fills is not knowable in advance.
The Risks on Both Sides
- For short sellers: unlimited loss, as the SEC states; borrow fees that rise with scarcity; recalls by the lender that force covering at the worst time; and the obligation to pay dividends to the lender.
- For buyers of a squeeze: the same small float that produced the rally produces the decline once covering is exhausted. Stops become market orders when triggered, and in a stock that gaps, the fill can be far from the stop price. The Library's fixed fractional entry warns that gaps and slippage can take more than the budgeted fraction of equity.
- For everyone: short interest data is one to two weeks stale, short sale volume is not short interest, and free websites often show proprietary calculations rather than the raw FINRA figures, as FINRA's own explainer cautions.
Where Quant Charts Fits
A low-float watchlist. Quant Charts includes US equities and ETFs from Cboe EDGX on every plan. Build a watchlist of the names you follow and open the Advanced view: the Price tab shows price, change, volume, market cap, sector and the 52-week range, and Sections let you group symbols by the float bucket you have assigned them from the filings. Short interest itself is not a chart data field, for the reasons the Library's entry gives, so the FINRA figure is read from FINRA and noted in the Section name or a Journal tag.
Indicators for the live picture. Add relative volume and ATR from the Indicators picker so unusual participation and expanding ranges are visible the moment they start. Market cap in the Price tab, divided by the share price, recovers shares outstanding; the float percentage from the filing then gives the tradable supply in shares.
The video below shows how indicators are added to a chart in Quant Charts.
Quant tests a volume-and-range rule. Describe a rule to Quant, our coding agent, in plain language, for example buying when relative volume exceeds three and the close is above the prior day's high, with a stop two ATRs below entry and an exit after five sessions. Quant writes the Pine Script; open Code to inspect it, then click Run. The Backtest Summary reports net profit, trade count, win rate, max drawdown and profit factor. Set commission and slippage in the strategy's Properties, and set slippage generously, because a low-float stock fills worse than its last print. The docs warn that a metric with few trades behind it is noise, and squeeze conditions are rare by construction.
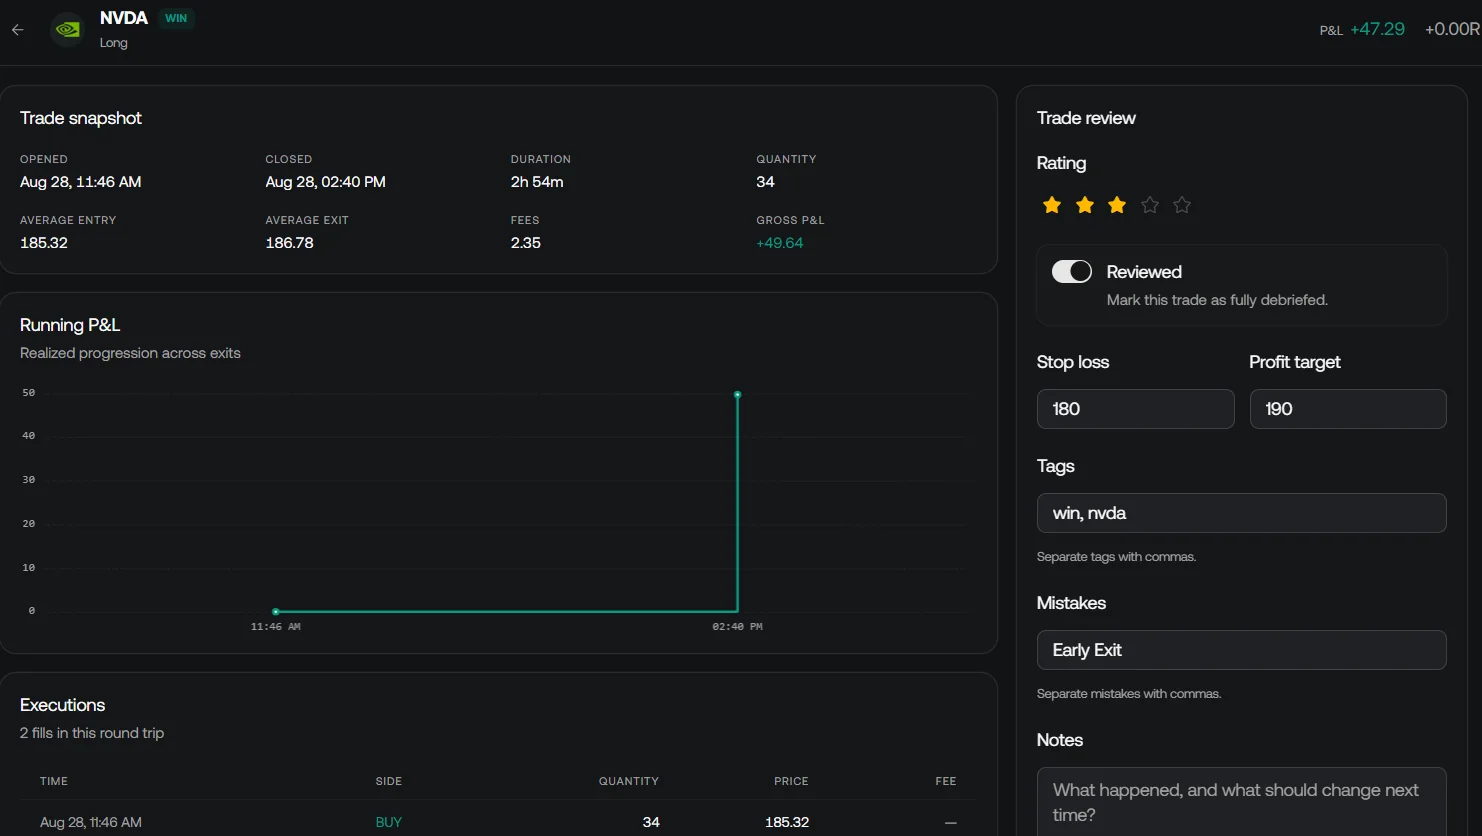
The Journal records the fills. Every plan includes the Journal, which turns broker fills or imported trades into round trips and reports results by symbol, side, hold time and time of day. Recording the planned stop and the actual exit for each low-float trade shows how much slippage the float cost, which is the number to carry into the next position size. No LuxAlgo tool places orders or lends shares; the Journal records trades made elsewhere.
FAQs
What is the difference between shares outstanding and float?
Shares outstanding is every issued share held by investors, insiders included, and is the count Investor.gov uses for market capitalization. Float is the subset that can trade freely, after insider, restricted and lock-up shares are removed. Float is the tradable supply.
What is short interest and how often is it published?
FINRA describes it as a snapshot of open short positions on brokerage books on a settlement date, reported twice a month and published free. It is not the same as FINRA's daily short sale volume file, which counts trades marked short rather than positions still open.
What does days-to-cover mean?
Short interest divided by average daily volume, an estimate of how many normal sessions it would take all short sellers to exit. Combined with short interest as a percent of float, it describes how crowded the short side is and how narrow the exit is.
What causes a short squeeze?
Short sellers must buy to close, so a rally in a heavily shorted, small-float stock forces covering that adds buying pressure and can feed on itself. Scarce borrow and rising loan fees intensify it. The Library's entry notes that genuine squeezes are episodic and rare.
Why is short selling described as riskier than buying?
The SEC's Regulation SHO summary states that a long position's loss is limited to the amount invested, while a short position's loss is unlimited because a stock can keep rising. Short sellers also pay borrow interest and any dividends to the lender.
Can Quant Charts show float or short interest?
Not directly. The watchlist Advanced view shows market cap and volume for US stocks on every plan, and relative volume and ATR indicators show unusual activity live. Float and short interest come from filings and FINRA, and can be noted in Sections or Journal tags.
References
LuxAlgo Resources
- Short Interest, Relative Volume, ATR, Gap Fill and Fixed Fractional concepts (LuxAlgo Library)
- Watchlist, Advanced view and Data (LuxAlgo Docs)
- Making strategies with Quant and Journal (LuxAlgo Docs)
External Resources
- Market Capitalization (Investor.gov Glossary)
- Stock Purchases and Sales: Long and Short (Investor.gov)
- Key Points About Regulation SHO (SEC)
- Short Interest: What It Is, What It Is Not (FINRA)
This article is educational and is not a recommendation to buy, sell or sell short any security. The squeeze example uses invented figures to show the arithmetic, not any real company.
Read next