SpotGamma Levels: Interpreting Dealer Positioning

SpotGamma levels are model-based reference points for investigating how options positioning may affect support, resistance, and volatility. Call Wall, Put Wall, Volatility Trigger, and Absolute Gamma summarize different aspects of that analysis. They are useful inputs to a trading plan, but they do not reveal every dealer’s inventory or guarantee where price will turn.
LuxAlgo provides native charts and Quant, our coding agent, for turning a clearly defined market idea into an editable indicator or strategy. You can study reactions around externally supplied gamma levels in that environment. Keep the data boundary clear: drawing a SpotGamma level on a chart does not create a live SpotGamma integration, and a price-only backtest does not automatically contain historical dealer-positioning data.
Key SpotGamma Levels at a Glance
| Level | What it represents | How to use it carefully |
|---|---|---|
| Call Wall | SpotGamma’s strike with the largest net call gamma | A potential upper-range reference; a catalyst or changing positioning can invalidate it |
| Put Wall | SpotGamma’s strike with the largest net put gamma | A potential lower-range reference; it is not a guaranteed floor |
| Volatility Trigger | A proprietary threshold below which SpotGamma expects higher-volatility behavior | A regime-risk input, distinct from an exact directional forecast |
| Absolute Gamma | The index strike with the largest combined absolute call and put gamma | A concentration to monitor for reactions or pinning, rather than a compulsory price destination |
| Hedge Wall | A single-stock volatility reference with a role similar to the index Volatility Trigger | Review the individual stock’s events and positioning; do not treat it as a universal squeeze trigger |
Definitions and product scope were checked against official documentation on September 8, 2026. Always record the symbol, report time, expiration scope, and units alongside a level. An SPX strike cannot simply be copied onto an SPY or ES chart: they are different instruments, and a futures basis can change over time.
How Gamma and Dealer Hedging Affect Markets
Delta, Gamma, and the Direction of a Hedge
Delta measures how an option’s value changes for a small underlying-price move. Gamma measures how delta changes as the underlying moves. For a conventional long call or long put, gamma is positive; selling that option reverses the position’s gamma sign. A vendor’s market-gamma sign convention can incorporate assumptions about who owns each side, so it is not the same as saying that every put intrinsically has negative gamma.
Consider a simplified dealer short one call representing 100 shares. If the call delta rises from 0.50 to 0.60, the short option’s delta changes from −50 to −60 shares. A delta-neutral hedge would increase from 50 to 60 shares: the dealer buys 10 as price rises. If delta falls, the dealer reduces that hedge. This example excludes other positions, volatility changes, transaction costs, and discrete hedging decisions.
| Net position being hedged | Underlying rises | Underlying falls | Possible feedback |
|---|---|---|---|
| Long gamma | Sell some underlying to rebalance | Buy some underlying to rebalance | Can dampen movement |
| Short gamma | Buy more underlying to rebalance | Sell more underlying to rebalance | Can amplify movement |
This is why the sign of net exposure matters. It is incorrect to explain resistance by saying that a dealer who is short calls must sell more shares simply because the underlying is rising. Likewise, short-put hedging does not automatically generate buying as price falls. The complete portfolio and hedging assumptions determine the required action; a wall’s name alone does not.
Gross Activity Is Different from Net Exposure
Open interest counts outstanding contracts, with a buyer and seller for each contract. Large call or put open interest does not by itself identify dealers’ net position. Offsetting trades, spreads, stock hedges, expiration, implied volatility, and time decay can all change the estimated effect.
The distinction is especially important for zero-days-to-expiration options, or 0DTE. In its May 2, 2025 analysis, Cboe reported almost two million SPX 0DTE contracts per day. Yet its analysis found relatively balanced customer activity and estimated net market-maker gamma hedging at only about 0.2% of daily SPX liquidity. That is a dated finding for the examined market, not a rule that every session has negligible impact. It shows why high volume alone does not prove a large destabilizing hedge.
A dollar-gamma estimate also needs a unit: per index point, per dollar, or per 1% move. Do not compare gross notional exposure with a signed net hedge estimate, or quote a fixed market-wide gamma amount without a date and methodology. A historical association between gamma and volatility is different from proving that hedging caused a particular price move.
Reading the Levels in Context
Call Wall and Put Wall
SpotGamma’s Call Wall and Put Wall describe concentrations of net call and put gamma in its framework. Treat them as potential range boundaries to investigate. A level far from the market, a level repeatedly tested, and a level moving after new positioning are different situations.
Before considering a reversal, observe what price does at the level: does it reject, pause, hold beyond it, or return after a break? Set a separate invalidation rule. If the market moves through a wall, do not assume that the wall must immediately become the opposite type of support or resistance, or that every dealer’s gamma changes sign at that strike.
Volatility Trigger and Hedge Wall
The Volatility Trigger is SpotGamma’s proprietary threshold for an expected shift in volatility behavior. Its purpose is different from simply marking the price where an aggregate gamma calculation equals zero. Below the trigger, an analyst may plan for wider ranges and stronger feedback; above it, a more stable environment may be plausible. Neither condition removes event risk.
The Hedge Wall plays a related volatility-context role for individual stocks. Earnings, corporate actions, liquidity, and the stock’s options activity still matter. A rising or falling modeled level is additional information, not proof of a forthcoming squeeze or an instruction to buy or sell.
Absolute Gamma and Pinning
SpotGamma defines Absolute Gamma for index products using the combined magnitudes of call and put gamma. A large concentration may be relevant to pinning or repeated reactions, especially when hedging flows are stabilizing. The same price can still be crossed when directional demand, news, or changing exposure dominates.
Use a range-bound zone or prominent gamma node as a place to observe behavior. Avoid turning a visually sharp heatmap feature into a guaranteed pivot. Check the selected model and participant group before interpreting its color, magnitude, or any strength ranking.
What the Published Statistics Actually Measure
SpotGamma’s SPX key-level statistics identifies a sample from May 10, 2019 through May 28, 2024. The published figures distinguish intraday containment from where the session closes:
| Historical measure | Reported share of sessions |
|---|---|
| Intraday high did not exceed the Call Wall | 83% |
| SPX closed below the Call Wall | 88% |
| Intraday low did not fall below the Put Wall | 89% |
| SPX closed above the Put Wall | 93% |
| Implied 1-Day Move was not broken intraday | 35% |
| SPX closed within the Implied 1-Day Move | 76% |
These are vendor-reported historical frequencies, not a strategy win rate. A close inside a range does not mean the market stayed inside it, that a stop survived, or that an option spread earned a profit. The one-day move estimate is also distinct from the Call Wall/Put Wall pair. Do not relabel the 76% closing frequency as a 78% “success rate” or a guarantee of low-risk mean reversion.
To evaluate a trading method, define entries, exits, costs, position sizing, and the information available at each decision. Include every eligible session, including breaches and losses. Test a later period separately. Any comparison of average forward returns around a wall should specify the sample and event definition; it cannot establish a repeatable payoff without an executable strategy.
TRACE, HIRO, and Equity Hub
TRACE uses SpotGamma’s proprietary Options Inventory Model for intraday SPX positioning. Its documentation describes one-minute updates and five-day forward projections. The strike plot includes gamma exposure, open interest, and net open interest views; heatmap lenses cover Gamma, Delta Pressure, and Charm Pressure. Participants such as market makers and customers can be selected. Read the lens and participant settings before comparing two screenshots.
Those projections are conditional model outputs. A future heatmap does not show transactions that have already happened in the future, and a modeled inventory is not the same as an independently audited dealer account. Delta Pressure describes changes in options delta positioning; Charm Pressure addresses the passage of time, which can matter near expiration.
HIRO aggregates options-trade delta notional to estimate associated hedging requirements across more than 400 active U.S. tickers, according to its documentation. It can add intraday flow context when price tests a level. It is not a direct record of every dealer’s subsequent stock or futures hedge, and agreement between HIRO and TRACE is not independent proof of causation.
Equity Hub supports single-stock positioning research and key-level review. Use it to compare a stock’s expiration scope and concentrations rather than treating an index level as that stock’s own signal. TRACE and HIRO are described as Alpha features in their help pages; confirm current access before choosing a subscription.
Historical Examples and What They Establish
April 23, 2025: A Large SPX Call Cluster
A SpotGamma case study published May 2, 2025 discusses April 23 activity involving approximately 37,000 SPX 5520 calls and an 81-point decline. The publication date should not turn this into a separate “May selloff.” SpotGamma interprets the flow, HIRO movement, and TRACE inventory changes as evidence of a bearish structure and a possible dealer-hedging contribution.
The useful lesson is that a call purchase can belong to a larger position. Long calls combined with a sufficiently large short underlying position can have a bearish exposure; a synthetic long put includes financing terms in a full put-call-parity relationship. A call print alone does not reveal those other legs. The vendor’s reconstruction is a case interpretation, not proof of the trader’s complete account or that hedging exclusively caused the decline.
AMC in July 2021: Reacting Around a Known Strike
A separate SpotGamma guest example from July 21, 2021 discusses AMC, the $40 strike, Equity Hub, HIRO, and visible liquidity. The author describes adjusting a trade after observing price and flow, then reducing exposure ahead of the watched level. This is a sourced illustration of combining context with a reaction, rather than evidence that every high-open-interest strike produces a squeeze.
It is a selected trader account with historical interfaces and product access. It does not substantiate a general promise of a 5%–10% move in five minutes or a repeatable 140% weekly gain. Preserve the distinction between a useful example and a representative performance record.
GameStop and the Limits of a Gamma-Squeeze Story
A short-gamma hedging loop can amplify a rising market: additional call buying may leave dealers needing more underlying exposure as price increases. But a dramatic rally is not enough to diagnose that mechanism. The SEC staff report on early-2021 market conditions states that staff did not find evidence of a gamma squeeze in GME during January 2021. Its options observations were not consistent with that explanation.
Treat a gamma squeeze as a hypothesis requiring position and flow evidence. Short covering, news, demand for the stock, and other flows can coexist. The reversal can also be sharp when buying slows, options expire, or hedges unwind. A historical negative-gamma reading followed by a rally does not establish that the reading predicted the low.
Expiration and Regime Changes
Options expiration can remove or relocate exposures, while changes in implied volatility and time to expiry alter delta and gamma even without a new directional trade. That makes expiration a useful review point for both range and momentum plans. It does not mean every selloff starts after expiration, or that crossing a 200-day moving average guarantees another fixed percentage decline.
A Practical LuxAlgo Workflow for Gamma-Level Research
1. Record and Mark the External Levels
Begin with a level you are entitled to use from the correct SpotGamma report or tool. Record its timestamp, underlying, expiration scope, and whether it is a daily reference or an intraday update. Mark it in the matching chart and distinguish it from levels that came from ordinary price analysis.
The short LuxAlgo clip below demonstrates adding a chart drawing. It illustrates the annotation workflow; it does not calculate, import, or refresh SpotGamma data.
2. Compare Price Behavior Across Timeframes
Use native LuxAlgo charts to compare a broader context chart with the timeframe where a decision is made. A 30-minute range and a five-minute break can tell different stories. Keep the symbol, session, timezone, and data feed consistent, and record which bar must close before the condition is considered confirmed.
The market-data guide matters when comparing platforms. For example, Cboe EDGX equities volume is not consolidated U.S. market volume. Footprint data summarizes executed volume at price on supported markets; it is not an options-inventory feed. A price-action zone, a footprint imbalance, and a SpotGamma level are different inputs.
3. Define a Rule with Quant
For a hypothetical study, use a manually supplied level of 500 on the matching instrument. Define a long condition only after a completed five-minute candle trades below 500 and closes back above it. Specify whether entry occurs at the next bar’s open, the invalidation level, the exit condition, and the position size. The number is illustrative, not a current SpotGamma level.
Ask Quant to implement that rule with an editable level input, then review Code and Run. Check Inputs, Properties, simulated trades, commission, and slippage. An indicator that marks the condition is different from a strategy that simulates entries and exits. Confirm that the implementation uses only information available at the decision time.
Do not backtest today’s gamma levels across earlier dates as though they were known then. A valid historical gamma study needs timestamped historical levels, their update times, and a supported way to align that data with the price series. If those inputs are unavailable, a fixed-level demonstration tests only the rule’s mechanics. Keep a prospective journal or paper-test the process while collecting the required records.
4. Use Library Tools for Their Specific Tasks
The Library’s market-structure, price-action, and momentum tools open in one click on a Quant Chart.
A break of structure, change of character, breaker block, or liquidity sweep can help define a price-based condition near an external gamma level. An oscillator divergence can describe a momentum disagreement. Neither confirms an institution’s identity or turns two related price measures into independent evidence of profitability.
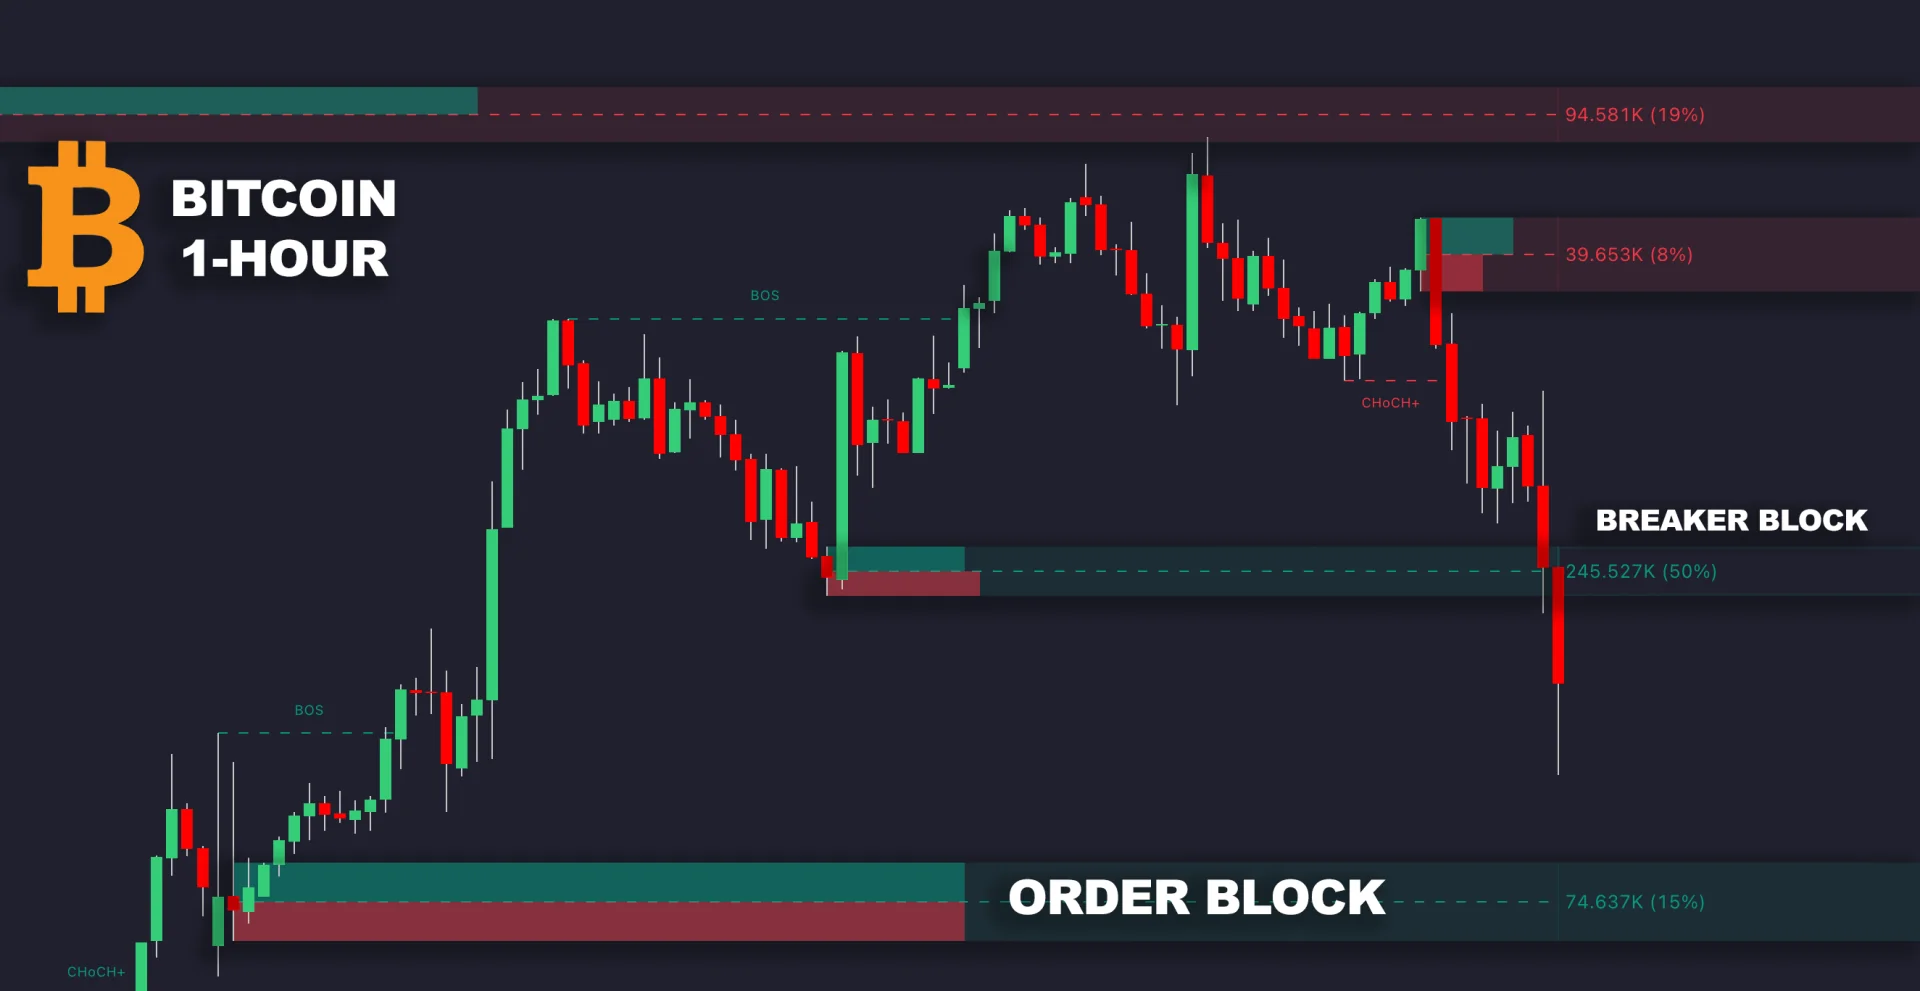
The Library also offers tools for studying dynamic support/resistance, supply and demand, and liquidity levels. Use their documented definitions and confirmation timing. A chart label inferred from candles is an analytical construction, not a view of every resting order or a guarantee that a level will hold.
5. Set Alerts in the Correct Product
A Quant strategy built on your rule can fire strategy alerts; no tool reads a SpotGamma feed automatically. Update manually entered levels when the external source changes, and test trigger timing and delivery.
Entry, Exit, and Risk Planning
| Scenario | Condition to investigate | What would challenge it |
|---|---|---|
| Range or mean reversion | A documented level plus an explicitly defined rejection in a stabilizing environment | Sustained acceptance beyond the level, changing gamma model, or a major catalyst |
| Momentum after a breach | A completed break with a defined continuation rule and adequate liquidity | Failed follow-through, a return into the range, or a changed external level |
| Volatility expansion | Price below a relevant trigger with wider realized movement | A quick recovery, offsetting flows, or evidence the model no longer fits |
| Swing-trade context | Daily levels and expiration changes aligned with a longer-term plan | Using a short-lived intraday reading as a multi-week forecast |
Size positions from a predefined loss budget and realistic execution assumptions. A stop is a trigger, not a guaranteed fill through a gap. A limit order controls the worst acceptable price if it fills, but it can leave the trade unexecuted. Neither order type removes liquidity risk.
Options add expiration, volatility, time-decay, spread, and contract-multiplier effects. A favorable underlying move does not guarantee an option profit. Deep out-of-the-money short-dated contracts can lose value quickly if the expected move fails to arrive, while uncovered short options can create losses beyond the premium received. Evaluate the actual position payoff rather than borrowing a chart-level “success rate.”
Keep a complete record of the level available at entry, the price reaction, the decision, fills, costs, and exit. Include skipped trades and failed setups. Compare later results with the research sample, and review whether the external levels added information beyond the price rule alone.
Using SpotGamma Levels Effectively
SpotGamma provides options-positioning models and reference levels; LuxAlgo provides a native environment for chart research and editable strategy development with Quant. Combining them can make a research process more explicit when the inputs and timing are documented. Start with one defined reaction, retain the historical level record, and judge the full set of outcomes. A modeled wall is a place to investigate—not a promise of a reversal or a substitute for a risk plan.
FAQs
Do SpotGamma levels reveal every dealer’s actual position?
No. They summarize positioning through data, assumptions, and proprietary models. Open interest and flow do not reveal every participant’s complete portfolio or subsequent hedge. Treat the levels as research inputs, not certain forecasts.
Does closing inside a SpotGamma range mean a trade was profitable?
No. SpotGamma reports that SPX closed inside its Implied 1-Day Move in 76% of sessions in its May 2019–May 2024 sample, while the range remained unbroken intraday in only 35%. Neither figure includes a complete trading rule, fills, costs, or option payoff.
Can Quant automatically backtest historical SpotGamma levels?
A price-only backtest does not contain historical SpotGamma levels automatically. Quant can help implement an explicit rule, but a valid gamma-level study also needs timestamped external level history and a supported way to align it with the chart data. Applying today’s levels to past dates creates look-ahead bias.
References
- SpotGamma: Call Wall
- SpotGamma: Put Wall
- SpotGamma: Volatility Trigger
- SpotGamma: Absolute Gamma
- SpotGamma: historical SPX key-level statistics
- SpotGamma: TRACE data and lenses
- SpotGamma: HIRO methodology
- Cboe: 0DTE positioning and market impact, May 2025
- SEC: early-2021 equity and options market structure report
- LuxAlgo: developing strategies with Quant
- LuxAlgo: chart strategy simulations
Read next