Concept
Supply & Demand Zones
Supply & Demand Zones, also known as rally-base-rally, rally-base-drop, drop-base-drop, drop-base-rally, are Support/Resistance & Levels concepts. The Library holds 6 implementations, each one a working definition you can pull into Quant.
Top Supply & Demand Zones indicators
The top custom implementations, built on the original standard Supply & Demand Zones formula.
6 total
Every Supply & Demand Zones implementation here is strategy-ready: open one in Quant, set your rules, and it backtests automatically.
What are Supply & Demand Zones?
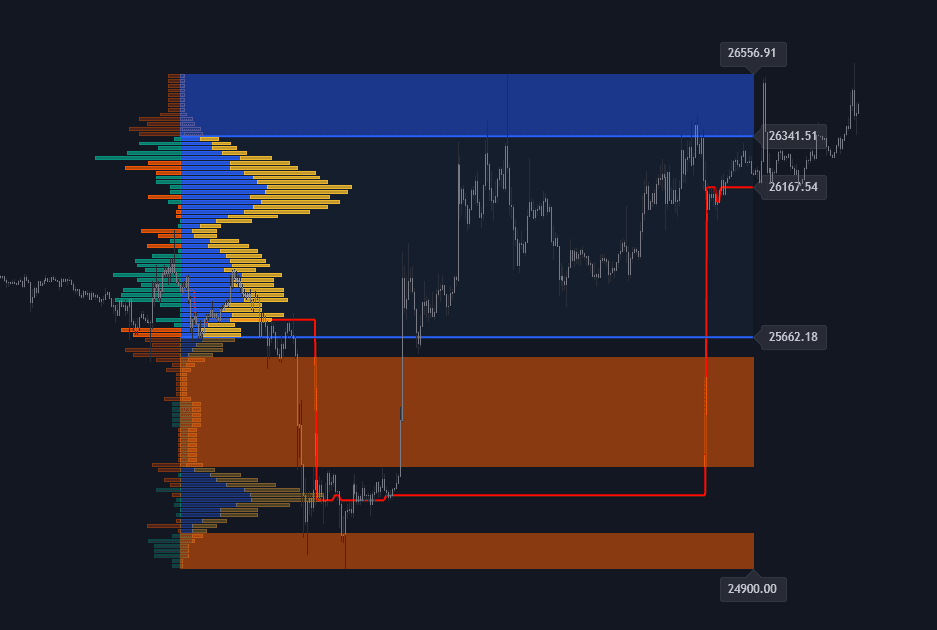
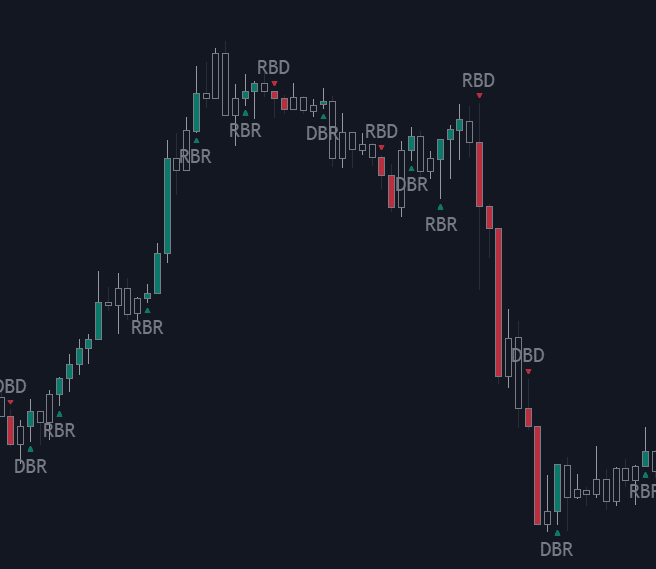
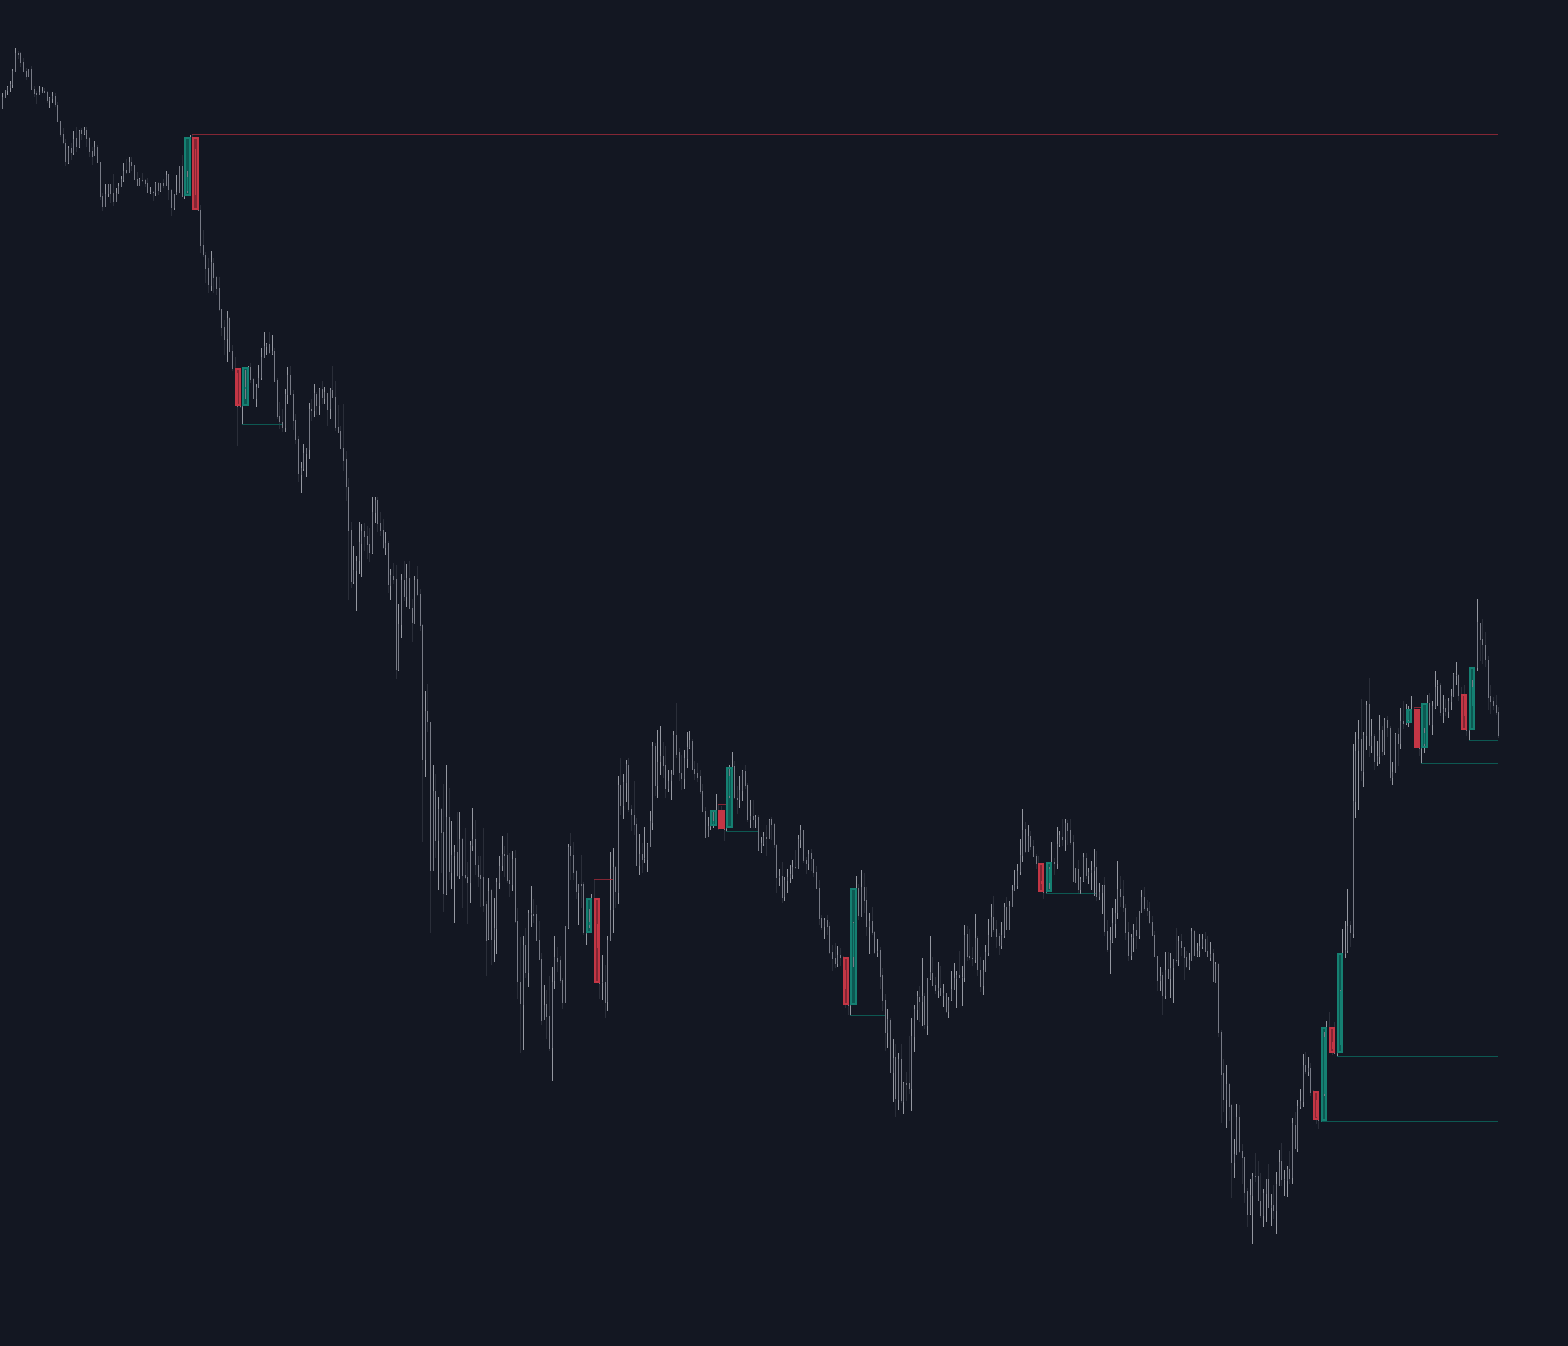
Supply and demand zones mark the origins of imbalanced moves. A demand zone is a small consolidation, called a base, that price left with an impulsive rally; a supply zone is a base that price left with an impulsive drop. The methodology names four formations by their leg-base-leg sequence: rally-base-rally (continuation) and drop-base-rally (reversal) create demand zones, while drop-base-drop (continuation) and rally-base-drop (reversal) create supply zones.
The premise is that a fast, one-sided departure leaves unfinished business: orders at the base that never got filled before price ran away. A return to the zone is the scenario in which that interest, or interest like it, gets another chance to act. Quality is judged by the strength of the departure (wide-range candles, ideally breaking structure), how little time price spent at the base, whether the zone is still fresh, and its curve position within the larger range.
The approach matters because it inverts classical support and resistance logic. An S/R zone earns credibility through repeated touches; a supply or demand zone is considered strongest before it is touched at all, with each revisit consuming the resting interest that defined it. That gives the method clean bookkeeping (zones get used up and retired) and clean risk framing, since the far edge of the zone defines the stop. It guarantees nothing: impulsive departures are far easier to see in hindsight than in real time.
How to identify supply and demand zones
The zone is found by working backward from an impulsive move to the consolidation that launched it.
- 1Find the departure. Look for a run of strong, one-directional candles leaving an area quickly; a slow drift away does not qualify. Departures that break a prior swing point carry more weight.
- 2Locate the base. Immediately before the departure there should be a compact consolidation, often just one to a handful of candles of overlapping range. That base is the zone.
- 3Draw the edges. Place the distal line at the base's far extreme (lowest wick of a demand base, highest wick of a supply base) and the proximal line at the near edge, commonly the candle bodies. Conventions vary; pick one and apply it consistently.
- 4Classify and grade. Label the sequence (rally-base-rally, rally-base-drop, drop-base-drop, drop-base-rally), then grade the zone on departure strength, time at base, freshness, and position on the curve.
How traders use it
- For set-and-forget entries: a limit order at the proximal edge with the stop beyond the distal edge, accepting more failed touches in exchange for best price and a fixed, known risk per attempt.
- For confirmation entries: wait for the first retest of a fresh zone and require a visible reaction, such as a rejection wick or a lower-timeframe structure shift, before committing; the fill is worse but the evidence is real.
- For target selection: longs from demand are commonly aimed at the next opposing supply zone and shorts from supply at the next demand, so the zone map supplies both ends of the trade.
- For bookkeeping: zones are marked consumed once price trades cleanly through them, and zone scoring and refinement frameworks rank the survivors by freshness, departure strength, and higher-timeframe alignment.
Supply & Demand Zones vs related concepts
Bullish/bearish Order Block: The Smart Money Concepts analogue, drawn from the last opposing candle before a displacement rather than from a base. The two often mark overlapping areas while following different drawing and mitigation rules.
S/R Zone: Touch-based rather than origin-based. An S/R zone gains standing from repeated reactions; a supply or demand zone is prized fresh and conventionally weakened by every test.
Fair Value Gap: An imbalance inside the departure itself, defined by a three-candle gap, rather than the consolidation the move departed from. The two frequently appear together, with gaps stacked just beyond a base.
More Supply & Demand Zones implementations
Concept family
Support/Resistance & Levels
38 concepts mapped · 38 in the Library
Supply & Demand Zones FAQ
Turn Supply & Demand Zones into a trading strategy.
Take any implementation from this page into Quant, then build on it, backtest it on real data, and keep refining it in conversation.