Concept
Head & Shoulders
Head & Shoulders are Chart & Candlestick Patterns concepts. The Library holds 1 implementation, a working definition you can pull into Quant.
Top Head & Shoulders indicator
The top custom implementation, built on the original standard Head & Shoulders formula.
1 total
The Head & Shoulders implementation below can become a backtested trading strategy — describe your rules and Quant writes the code.
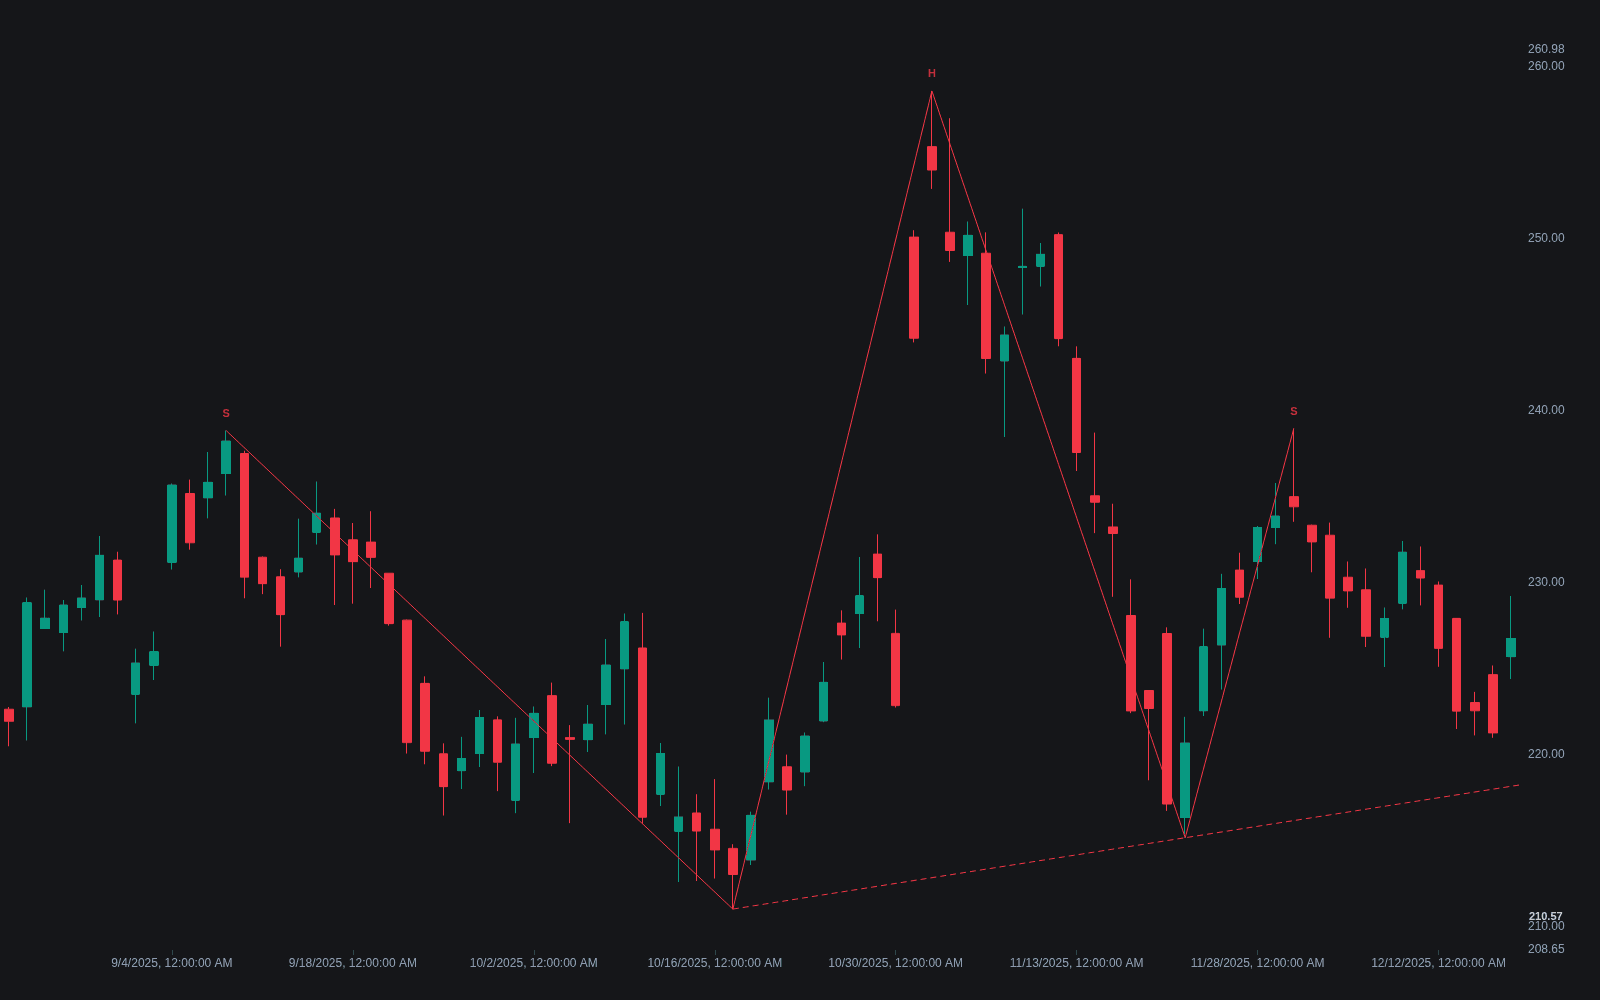
What is a Head & Shoulders?
A head and shoulders is the classic three-peak reversal pattern of Western charting, codified in the Schabacker and Edwards & Magee lineage. An uptrend makes a peak (the left shoulder), a higher peak (the head), then a lower peak (the right shoulder), and a neckline is drawn across the two lows between them. The right shoulder's lower high is the tell: the trend has stopped making higher highs, the failure that sets up a change of character in modern structure vocabulary. The pattern completes only when price closes through the neckline; before that it is a possibility, not a signal.
The inverse head and shoulders is the mirror at bottoms. In the classic description volume fades across the head and right shoulder and expands on the neckline break, and the measure rule projects the head-to-neckline distance from the break as an objective.
Necklines are rarely textbook-horizontal. A downward-sloping neckline signals more aggressive selling into the troughs and completes earlier, while an upward slope delays the trigger and, past a point, degrades the structure into something closer to a rising consolidation. Complex variants add second heads or shoulders, and the same failed-higher-high logic scales from intraday swings to multi-year tops. Related structures carry their own entries in this library: the double top/bottom encodes an equal-high rejection instead of a failed one, and the Quasimodo variant popular in supply-and-demand circles lets price break the interior low before the right shoulder even forms.
The evidence on the pattern is genuinely mixed and worth stating honestly. Thomas Bulkowski's large chart-pattern samples rank head and shoulders tops among the better-performing classical reversals, while a well-known Federal Reserve study of currency markets by Osler and Chang found profitability in some currencies and none in others. The practical reading: the pattern encodes a real behavioral event, a trend that stops making higher highs, but its edge depends on context, execution and risk placement rather than on the shape alone. The Library's detection tools, including ProjectSyndicate's geometric pattern engine and EmirTradeHub's Quasimodo structure script, automate the geometry so the discretionary work shifts to context.
How to identify a head and shoulders pattern
The pattern only means something after a trend, and it only triggers on completion. These steps walk through the classical checklist.
- 1Require an established uptrend into the pattern; without higher highs and higher lows beforehand there is nothing to reverse, and three-peak shapes inside ranges are noise.
- 2Mark the left shoulder and the head: the head must set a higher high, and momentum divergence at the head strengthens the case even though it is not required.
- 3Watch the right shoulder fail below the head, ideally roughly symmetric to the left shoulder in height and duration; heavy asymmetry weakens the read.
- 4Draw the neckline across the two interior troughs and note its slope, since a downward tilt completes earlier and an upward tilt demands more patience.
- 5Track the volume signature: in the classic description activity fades across the head and right shoulder and expands on the break, so treat a silent break with suspicion.
- 6Wait for a decisive close through the neckline to call the pattern complete; before that close the structure is a scenario, not a signal.
How traders use it
- As a reversal entry: short the neckline break, or wait for the frequent retest of the broken neckline from below, with the stop above the right shoulder.
- As a target framework: the pattern's height projected from the neckline gives a measured objective, treated as a scenario or scale-out level rather than a promise.
- As a warning for trend followers: a developing right shoulder that cannot exceed the head is a cue to tighten stops on longs even before the neckline gives way.
- As the bottoming mirror: the inverse head and shoulders gives reversal longs the same completion logic, with the measure-rule objective projected upward and volume expansion on the break carrying extra weight at lows.
- As a confluence anchor for candlestick confirmation: a pin bar or engulfing bar rejecting the right-shoulder zone lets traders position before the neckline break with a tighter, structure-backed stop.
Head and shoulders vs other reversal patterns
Double Top/Bottom: A double top rejects from an equal high twice; a head and shoulders makes one higher high first and then fails. The head and shoulders therefore carries more information about exhaustion, while double tops form faster and are easier to automate.
Rising/Falling Wedge: A wedge is a converging-trendline structure where momentum bleeds out gradually and the break carries a bias against the slope. The head and shoulders is a discrete three-peak sequence with a single defined trigger at the neckline rather than a squeeze toward an apex.
Triangles: Triangles are consolidation patterns that lean toward continuation of the prior trend. A head and shoulders is reversal-first: it exists specifically to mark the end of the trend that produced it, and its trigger fires against that trend.
Concept family
Chart & Candlestick Patterns
84 concepts mapped · 84 in the Library
Head & Shoulders FAQ
Turn Head & Shoulders into a trading strategy.
Take the implementation from this page into Quant, then build on it, backtest it on real data, and keep refining it in conversation.