Trade Ideas Review AI Alerts Under the Microscope
Trade Ideas is built around stock discovery: scanning, event alerts, and AI-generated trade ideas. LuxAlgo connects chart research with custom indicator and strategy development through Quant Charts and Quant, our coding agent. Both can support active traders, but they solve different parts of the research process.
The central question is whether you want a scanning system to surface stocks or a charting platform where you can define, inspect, and test your own logic. This review examines Trade Ideas’ alerts, Holly AI, OddsMaker backtesting, costs, and execution boundaries alongside LuxAlgo. Features and standard prices were reviewed September 8, 2026.
Quick Comparison
| Research need | Trade Ideas | LuxAlgo |
|---|---|---|
| Discover candidates | Stock scans, ranked lists, and event alerts | Watchlists, chart research, and indicator tools |
| Use AI | Holly provides generated trade ideas with entry and exit information | Quant develops editable indicator and strategy code from a defined idea |
| Test rules | OddsMaker tests alert-based strategies across a market or watchlist | Run strategy scripts on the selected chart and inspect simulated trades |
| Customize | Configure alerts, filters, windows, and scan criteria | Change code, inputs, chart tools, and strategy assumptions |
| Best initial task | Build a focused stock scan and inspect why alerts trigger | Turn one chart question into a clear indicator or strategy |
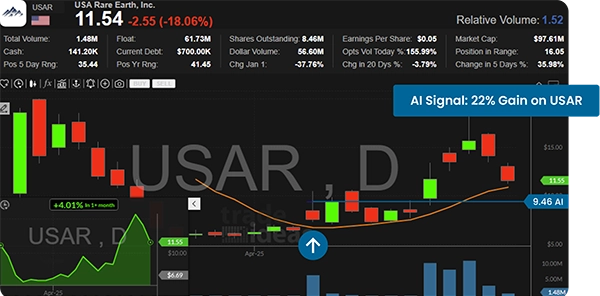
Do not equate an AI label with a verified trading edge. The older article’s blanket claim of a success rate above 60% and its isolated 25% winner do not establish representative future results. Win rate needs context: average gains and losses, costs, drawdown, sample size, and how the trades were selected.
Trade Ideas Backtesting: Official Walkthrough
This March 6, 2025 tutorial from the TI–Trade Ideas Educational Channel is embedded on the current OddsMaker feature page. It explains backtest configuration and result review. Treat the historical interface and plan references as instructional context; current pricing and documented testing limits take precedence.
1. Trade Ideas AI Alerts Overview
Holly and the Broader AI Toolset
The current AI overview presents Holly as a virtual trading assistant providing real-time buy/sell ideas with entry and exit points. The page separately describes TI Wave and Money Machine. These products should not be collapsed into one universal “Holly Grail” engine or assumed to have identical access and execution behavior.
Trade Ideas has historically used overnight strategy selection to prepare ideas for the next session. Its historical Holly Morning Huddle explicitly describes the displayed win percentages as optimized backtested scenarios. Those figures are not a current live success rate, and an overnight selection process does not make every alert suitable for every trader.
Alert Windows and Ranked Lists
The Top List guide distinguishes two important tools. Alert Windows show event-based updates with timestamps. Top Lists rank stocks that meet filters and refresh on a documented 30-second cycle. A stock can remain near the top of a list without generating a new event alert.
Multiple alerts operate as alternatives: one alert can trigger when its event occurs. Filters narrow the qualifying universe and must all be satisfied. This distinction matters when combining a new-high event with a volume condition; adding two alerts does not automatically mean both events happened together.
| Research interest | Configuration idea | Review before acting |
|---|---|---|
| Price movement | An event alert for a defined price change or breakout | Timestamp, spread, and whether the move already occurred |
| Unusual activity | A volume filter applied to a selected stock universe | Field definition, time of day, and normal trading activity |
| Technical setup | A specific alert plus trend or price filters | Whether conditions combine as intended |
| News context | Inspect relevant headlines alongside the chart | Source and release time; correlation is not proof of cause |
Example: define a stock universe and liquidity threshold, select one breakout event, then inspect several resulting alerts. Write down the event time and the chart condition that produced it. Begin with a small, understandable configuration rather than adding many filters solely because the historical results improve.
OddsMaker Strategy Testing
OddsMaker is Trade Ideas’ point-and-click, event-based backtesting tool. It can test alert strategies across the market or a custom watchlist and report metrics such as profit factor, win rate, average winner and loser, and drawdown. Its market-wide scan workflow differs from testing one chart’s price series.
The user guide explains how to open Backtest Strategy from an Alert Window and configure starting equity, position size, and commission. Review the equity curve, daily calendar, and individual trades before adjusting filters. A few unusually large winners can dominate the total.
The same guide documents important limits: no current-day, premarket, or postmarket backtesting; once a symbol is entered, it is not reconsidered that day. Tests use one-minute candles rather than tick data, and modeled exit prices do not include the spread. Rapid scalping results may therefore differ materially from actual fills.
Use optimization to form a hypothesis, then evaluate it on a different period and in paper trading. Check skipped trades, available buying power, spreads, and execution costs. Neither a high backtested win rate nor a smooth equity curve guarantees that a live account can reproduce the result.
Execution and Broker Connections
The broker page labels TradeStation, Interactive Brokers, E*TRADE, and Alpaca as API integrations, while other listed firms are partnerships. A logo alone does not establish the same integration capability. Confirm the account type, supported orders, software version, and permissions for the workflow you intend to use.
Scanning, paper trading, and auto trading are separate actions. Review the configuration in simulation before enabling a broker workflow, and monitor order status and risk limits. An alert arriving on screen is not proof that an order was submitted or filled at the displayed price.
Current Trade Ideas Pricing
The current pricing page names its tiers Core (TI Standard) and Apex (TI Premium). These are standard U.S. dollar rates, excluding temporary promotional discounts.
| Trade Ideas tier | Monthly billing | Annual total | Annual equivalent / month |
|---|---|---|---|
| Core / TI Standard | $127 | $1,068 | $89 |
| Apex / TI Premium | $254 | $2,136 | $178 |
Core lists real-time data, customizable scans and screeners, price alerts, paper trading, and TI Wave. Apex adds first-generation AI signals, backtesting, smart risk levels, and auto trading among its features. The older $188 figure is not the current listed entry price. Check the final plan and renewal terms rather than treating annual equivalents as monthly billing.
2. LuxAlgo Charts, Quant & Toolkits Overview
Start with the Chart and a Defined Question
LuxAlgo’s Quant Charts provides a browser workspace for market charts, drawings, indicators, and layouts. Use a watchlist to organize candidates, then investigate the behavior you want to understand. The charting platform is central to this workflow, alongside the separate TradingView products below.
With Quant, our coding agent, describe the indicator or strategy you want to build. Specify what triggers an entry, what ends the trade, and how risk is controlled. Review the generated script in Code, sign in, and click Run on the intended chart. A strategy creates simulated entries and exits; an indicator alone needs rules defining how its values become trades.
Example: after observing breakout alerts, ask Quant to study a close above the previous 20 completed bars’ high, with a defined stop, position size, and exit rule. Exclude the current bar from the breakout threshold. Inspect the generated conditions and several plotted trades before changing parameters. This studies a price rule; it does not recreate Holly’s proprietary logic or the complete Trade Ideas stock-selection process.
Read the Backtest, Then Review Execution
The strategy viewer exposes performance statistics and a Trades Log. Set realistic commission and slippage, use standard price bars, and compare results across appropriate periods. Examine drawdown and trade count as well as net profit. A chart with a handful of favorable trades is weak evidence for a repeatable strategy.
Keep the data source, session, and timeframe consistent with the question. A strategy applied to today’s watchlist does not automatically reproduce a historical stock universe. If your approach depends on changing scan candidates, that selection process must be modeled separately with information available at the time.
The LuxAlgo Journal can help review recorded fills and notes alongside charts. Keep simulated strategy results separate from actual or paper execution records. A difference between the two may reveal missed trades, discretionary changes, costs, or fill assumptions worth investigating.
LuxAlgo Pricing
The LuxAlgo pricing page distinguishes standard monthly billing from annual subscriptions. Temporary introductory offers are excluded here.
| LuxAlgo tier | Standard monthly billing | Standard annual total | Annual equivalent / month |
|---|---|---|---|
| Free | $0 | $0 | $0 |
| Premium | $67.99 | $479.88 | $39.99 |
| Ultimate | $119.99 | $719.88 | $59.99 |
| Ultra | $229.99 | $1,439.88 | $119.99 |
Free includes charting and a limited Quant allowance. Paid plans increase credits and other platform limits. The older $39.99, $59.99, and $119.99 figures describe annual-billing equivalents for the paid tiers, not their standard month-to-month prices. Confirm the features and entitlements required for your own setup.
Key Differences and Final Assessment
Choose Trade Ideas for stock discovery when your main need is a configurable scanning environment and event alerts. Holly adds generated trade ideas, and OddsMaker supports scan-based research. Plan costs, data scope, testing limitations, and broker behavior are part of the decision.
Choose LuxAlgo for chart-led development when you want to translate a market question into editable indicator or strategy code with Quant. It also supports manual chart analysis and journal review. Both day traders and swing traders can use this workflow; it should not be limited to one holding period by a comparison table.
Use both only when each removes a specific bottleneck. You can manually research a Trade Ideas candidate on LuxAlgo charts, but neither platform automatically validates the other’s signals. Begin with a narrow, repeatable process, inspect the evidence, and compare the value with the total cost.
FAQs
What makes Trade Ideas' AI alerts different from traditional stock scanners?
Holly supplies generated trade ideas with entry and exit information, while configurable scanners identify stocks meeting events or filters. AI-generated ideas still require review and are not guaranteed profitable trades.
Who can benefit the most from using Trade Ideas' AI alerts?
Active stock traders who need a structured way to discover and review candidates may find them useful. The alerts do not remove the need to understand risk, monitor execution, or evaluate results after costs.
Is Trade Ideas suitable for beginners, or is it better for experienced traders?
Beginners can use educational resources and paper trading to learn the platform, but its many settings require practice. Start with a simple scan and inspect its behavior before adding AI signals or automation.
References
Read next