Ultimate Guide to TradingView Chart Troubleshooting
Most TradingView chart problems trace back to one of five places: the browser, the indicator stack on the chart, the data subscription behind the symbol, the device or app, or TradingView's own services. This guide sorts the common symptoms by that origin, using the fixes TradingView documents in its Help Center rather than folklore, and closes with how the same symptoms behave on Quant Charts, LuxAlgo's native charting and AI platform, where the data feed, the indicator limits and the layout logic are different and the troubleshooting is shorter.
Key points:
- Check the status page before you touch anything. TradingView publishes component-level status for its website, data feeds, alerts, Pine Script studies and the chart itself.
- Frozen or slow charts are usually the browser. TradingView's own fix list is reload, restart the browser, close other tabs, remove extensions, try another browser.
- Compressed charts and floating indicators are scale problems, not bugs. A far-away indicator level or a wrong scale pin explains almost all of them.
- "Data is delayed" is a subscription state, not a fault. Real-time data for most stock and futures exchanges is sold separately from the TradingView plan.
Start With the Status Page
TradingView runs a public status page at status.tradingview.com that reports each component separately: Website, Data feeds, Alerts, Pine Script studies and strategies, Screener, Trading, Widgets, Chart, News and Watchlist, with a ninety-day incident history underneath. When candles stop updating for everyone at once, or scripts stop calculating, the incident is usually already listed there. Checking it first saves you from clearing caches and reinstalling drivers for a problem that is not on your machine. If the page shows every component operational, the fault is local, and the rest of this guide applies.
Symptoms and Their Fixes
The table maps the symptoms TradingView's Help Center addresses most often to their documented cause and fix. Each row links to the article it comes from.
| Symptom | Usual cause | Documented fix |
|---|---|---|
| Chart or cursor is slow or frozen | Too many browser tabs, extensions such as ad blockers, a browser that has run for days | Reload the chart page, restart the browser, close other tabs, remove extensions, try another browser (Help Center) |
| Coloured shapes or artifacts on the chart | Graphics rendering problems in recent Chromium browsers | Update the browser; if it persists, disable hardware acceleration in the browser's system settings (Help Center) |
| Candles or drawings look blurry | Browser zoom is not 100% | Set zoom to 100% with Ctrl and plus or minus, then refresh (Help Center) |
| Candles have disappeared | Main series hidden, or body, border and wick unticked or coloured like the background | Check the series visibility in the top-left legend, tick Body, Borders and Wick, enable autoscale (Help Center) |
| Chart looks compressed | An indicator plots levels far from price and autoscale fits them all | Hide or adjust the indicator, or enable "Scale price chart only" from the price-scale right-click menu (Help Center) |
| Indicator floats, or sits flat at the top or bottom | Indicator pinned to No Scale or to a different scale than price | Right-click the indicator, open Pin to Scale, choose the same scale as the main symbol (Help Center) |
| Indicator shows Ø after a timeframe change | Its timeframe input is higher than the chart with "Wait for timeframe closes" on | Expected behaviour; the plot only has a value on the higher timeframe's bars (Help Center) |
| Error about more than 10 indicators connected in a sequence | A calculation chain deeper than ten indicator-on-indicator links | Consolidate the chain into one Pine Script indicator (Help Center) |
| Indicator names and values vanished from the legend | Legend collapsed | Click the plus or minus button in the top-left corner (Help Center) |
| Drawings are gone | The same layout was saved from another tab or device and overwrote yours | Do not work on one layout from several devices or tabs at once; consider turning autosave off (Help Center) |
| Status line says data is delayed | No real-time subscription for that exchange | Buy the exchange's real-time package or verify a broker account; crypto exchanges are real time on every plan (Help Center) |
| Symbol not found in search | An exchange or symbol-type filter is active | Clear the filter in the top bar of the symbol search window (Help Center) |
| Android app shows no chart or dead buttons | Outdated Android System WebView or system browser | Update Android System WebView and Chrome, then fully close and reopen the app (Help Center) |
| Desktop app tab crashed | Outdated app, corrupted cache, heavy indicators, security software, low resources | Update the app, clear its cache, test indicators one at a time, check antivirus and VPN clients, update drivers (Help Center) |
The Browser Layer
For a slow or frozen chart in the web version, TradingView's guidance is deliberately mundane. Performance depends on how many tabs are open across all your browsers, which extensions are installed, and how long the browser has run without a restart. The fixes, in order, are to reload the chart page, restart the browser completely, close every tab except the chart, remove extensions, and try a different browser. Work through them in that order and stop when the chart recovers; the point is to find which layer was at fault, not to do all five.
Hardware acceleration cuts both ways. The chart renders on the graphics card when acceleration is on, which is normally what you want, but TradingView notes that recent Chromium-based browsers can produce coloured artifacts on the chart through rendering faults, and its fix is to update the browser and then, if the shapes persist, disable hardware acceleration in the browser's system settings. If you turn it off to cure artifacts and the chart becomes sluggish, you have traded one problem for another, and a graphics driver update is the real fix. A quick way to confirm the browser can render WebGL at all is get.webgl.org, which reports whether WebGL is supported, disabled or unavailable.
Two smaller items are worth knowing. Blurry candles are a zoom problem: set the browser to 100% and refresh. And if TradingView Desktop rather than a browser is misbehaving, the app has its own controls under its menu, including an About tab to check updates, a Clear cache button under Service, and a checkbox to disable hardware acceleration, all documented in the desktop performance article.
The Indicator Stack
The second-largest source of chart complaints is the set of indicators loaded on the chart, and three of the commonest are not faults at all. A compressed chart, where candles shrink to a thin band, almost always means an indicator is plotting levels far from the current price and autoscale is stretching the axis to include them; TradingView's answer is to hide or adjust the indicator, or enable "Scale price chart only" from the price-scale context menu. An indicator that floats away from the candles when you scroll, or lies flat along the top or bottom, is pinned to No Scale or to a different scale than the symbol; right-click it, open Pin to Scale and select the scale the price is on. And an indicator that prints Ø after you changed its timeframe input to something higher than the chart is behaving as designed: it only has a value on the bars where the higher timeframe closes.
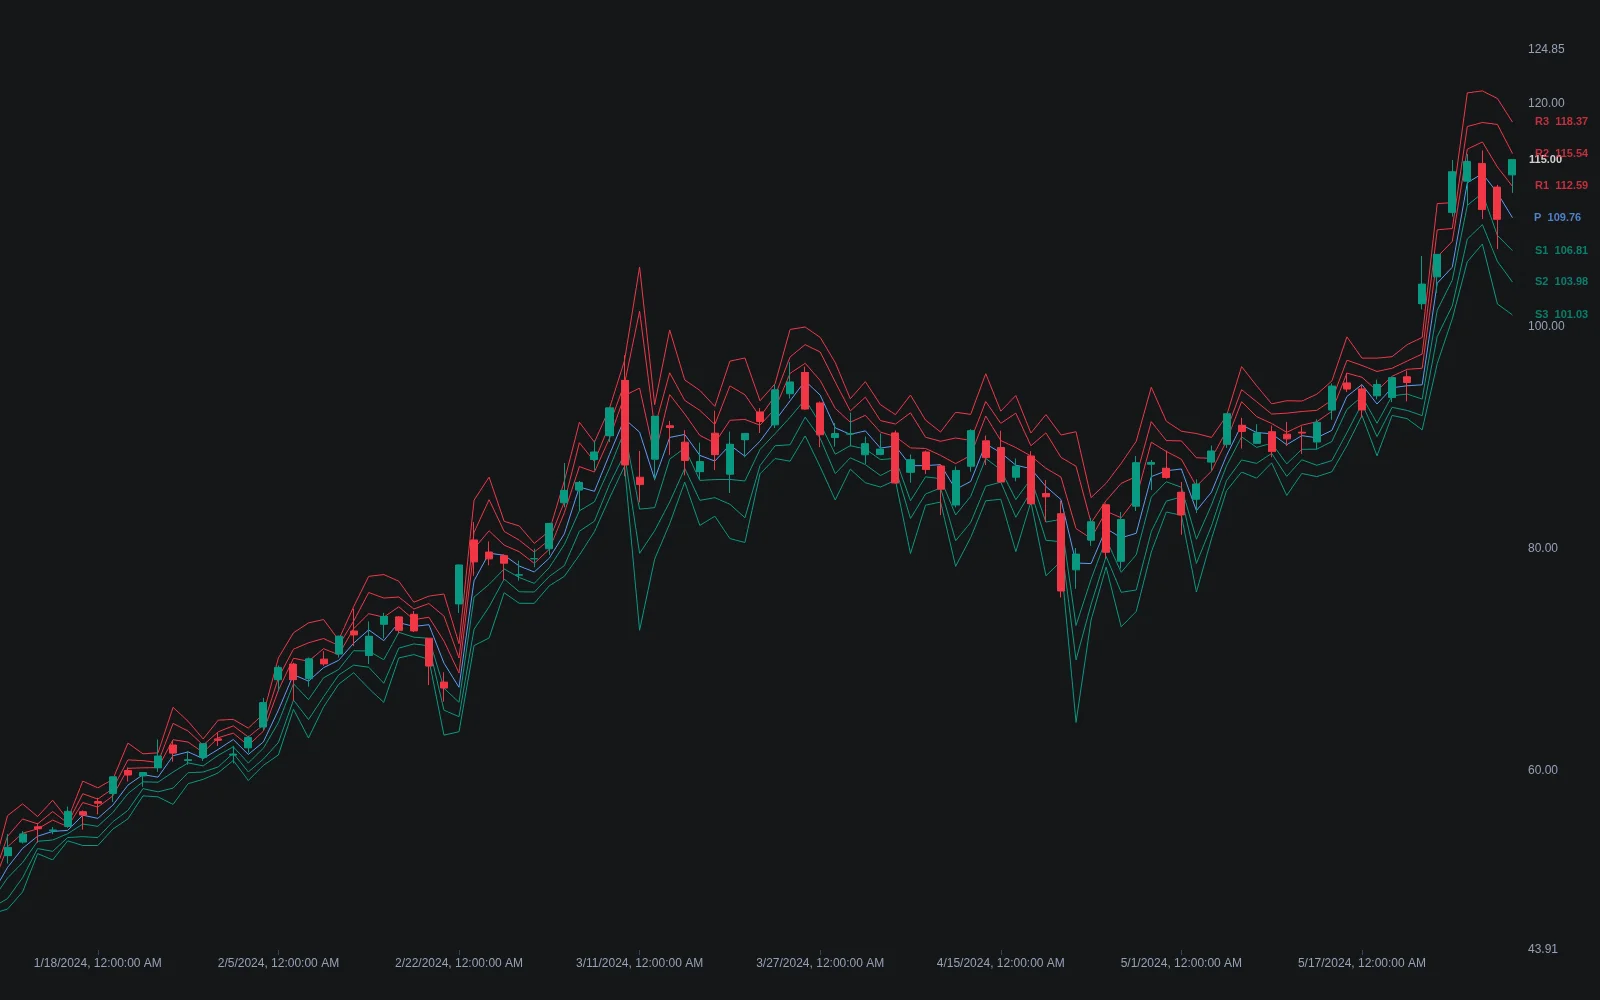
Limits matter too. TradingView's pricing page lists indicators per chart by plan, from 2 on the free tier through 5, 10, 25 and 50 on the paid tiers, with a separate indicator-on-indicator allowance that runs from 1 to 49. The error about a script relying on more than ten indicators connected in a sequence is a different limit again: it fires when one indicator's source input depends on a chain more than ten links deep, and the fix is to consolidate the chain into a single Pine Script indicator. When a chart has become unstable for no obvious reason, TradingView's own advice for its desktop app is the right procedure everywhere: disable all indicators, confirm the problem stops, then re-enable them one at a time until the culprit shows itself.
One caution about indicator templates from the layouts article: applying a template replaces the chart's indicators and panes, and drawings that lived in those indicator panes are removed with them. If a template wipes drawings you wanted, undo immediately.
Data and History
A status line that reads "Data is delayed" is the most misread message on the platform. Most stock and futures exchanges charge for real-time data, and TradingView's paid plans do not cover those fees; real-time feeds are bought as separate data packages, priced by exchange and by professional or non-professional status, or unlocked by verifying a broker account. Cryptocurrency exchanges are real time on every plan. Note also that US stock data comes from Cboe by default, so it can differ slightly from the primary listing exchange until you add NASDAQ, NYSE or ARCA data to the plan. None of this is a chart fault, and no browser fix will change it.
Missing history is a plan limit as well. The Help Center's intraday data article puts intraday history at 5,000 bars on the free plan, 10,000 on Essential and Plus, 20,000 on Premium, 25,000 on Expert and 40,000 on Ultimate, plus a few bars back to the start of the week, month or year. Daily and higher timeframes show all available data. If a strategy needs more intraday history than the chart loads, the Strategy Tester's deep backtesting mode calculates on the symbol's full history rather than the loaded bars.
Devices and Apps
On Android, the chart is drawn by Android System WebView or the device's default browser, so a chart that does not display, or buttons that do nothing, usually means those components are out of date. The documented fix is to update Android System WebView, update the system browser and Chrome, then fully close TradingView and reopen it. On the desktop app, the "tab crashed" message has a six-step procedure: update the app from its About tab, clear the cache under Settings and Service, test indicators individually, check antivirus, firewall and VPN clients that intercept network traffic, close other heavy applications, and update the operating system and drivers. TradingView asks that you reproduce the crash in a web browser before contacting support, because that isolates the app from the account.
The Same Symptoms on Quant Charts
Quant Charts is LuxAlgo's own charting platform in the browser, so several of the problems above cannot occur in the same form, and the ones that can have shorter fixes. Charts use LuxAlgo market data, candles plus a live stream delivered by one provider in front of several venues, with no exchange accounts, API keys or per-exchange real-time packages to buy; real-time stocks, ETFs and crypto are on every plan, and forex, commodities and CME futures come with the paid plans, per the Data page. A symbol that resolves to an aggregate when you wanted one exchange is pinned with the PROVIDER:SYMBOL form, for example binance:BTCUSDT. Order-flow tools that need footprint data warn on markets that lack it instead of drawing a blank series, so a missing plot always carries its explanation.
The most common "it did not work" on Quant Charts is a layout question. In a multi-chart layout only one chart is active, the one you last clicked, and everything that targets the chart, including symbol and timeframe changes, drawings, indicators and scripts from Quant, goes to that cell. Shortcuts also act on the focused chart, so click the chart first. A compressed view is fixed by pressing 0, which fits the content to the viewport, and the price scale modes, including log and invert, sit on the price-axis right-click menu. If the last price line and the forming bar seem to lag on a fast market, the Charts overview says to switch off Animate price changes under Chart settings, Symbol, Animation, so the bar snaps to each update with the lowest display latency. Indicators are hidden, locked, duplicated, reordered or removed from the Object tree, and a right-click on the chart offers Remove indicators to clear the lot at once, which is the fastest way to run the one-at-a-time test. The Free plan allows 5 indicators per chart plus one Quant script and the volume pane; the paid plans are unlimited, and history runs from 5,000 bars on Free to 50,000 on Ultra.
The other difference is how custom studies get onto the chart. Instead of a chained stack of indicator-on-indicator sources, you describe the rule to Quant, LuxAlgo's coding agent, in plain language; Quant writes the Pine Script, you inspect it under Code and click Run, and the study plots on the active chart, marked in the legend so you can tell it from picker indicators. The same path produces strategies: the Backtest Summary reports net profit, trade count, win rate, maximum drawdown and profit factor, with commission and slippage set in the strategy properties so the result is costed. A script that misbehaves is edited in Code and re-run, not debugged through a chain-depth error. The LuxAlgo platform does not place orders for you; the platform is for research and testing.
A Troubleshooting Sequence
- Check status.tradingview.com. If Data feeds or Chart show an incident, wait; nothing local will fix it.
- Reload, then restart the browser. Close other tabs and disable extensions before trying anything deeper.
- Read the message. "Data is delayed", Ø values and the ten-indicator error each describe a setting, not a fault.
- Isolate the indicator stack. Remove all indicators, confirm the chart recovers, re-add them one at a time.
- Fix scale problems at the scale. Scale price chart only for compressed charts; Pin to Scale for floating plots; zoom 100% for blur.
- Update the platform layer. Browser, Android System WebView, TradingView Desktop and graphics drivers, in that order of likelihood.
- Protect the layout. One layout, one device at a time, and save deliberately rather than relying on autosave from two places.
Conclusion
Chart troubleshooting on TradingView is mostly classification. Once you know whether a symptom belongs to the browser, the indicator stack, the data subscription, the device or TradingView's services, the Help Center already has the fix, and it is rarely more than a reload, a scale setting or an update. The traps are the messages that look like faults and are not: delayed data, Ø values and the chain-depth error all describe how the platform is configured. On Quant Charts the classification is shorter, because the data feed is one provider without exchange packages, indicator limits on paid plans do not exist, and custom studies are written and re-run by Quant rather than stacked. Either way, the discipline is the same: find the layer, apply the documented fix, and change one thing at a time.
Key Takeaways
- Check the status page first; component-level incidents explain platform-wide freezes.
- Slow charts: reload, restart, close tabs, remove extensions, try another browser, in that order.
- Compressed charts and floating indicators are scale settings; fix them at the price scale.
- Delayed data and intraday history are plan and subscription limits, not chart faults.
- On Quant Charts, check the active cell, press 0 to fit, and turn off price animation for the lowest latency.
FAQs
How do I unfreeze a TradingView chart?
Reload the chart page, then restart the browser completely. If it still freezes, close every other tab, remove browser extensions such as ad blockers, and try a different browser. TradingView attributes most slowness to tab count, extensions and long browser uptime.
Why does my TradingView chart look compressed?
An indicator is plotting levels far from the current price and autoscale is fitting them all into view. Hide or adjust that indicator, or right-click the price scale and enable "Scale price chart only" so the candles scale independently of indicator levels.
Why does the status line say data is delayed?
The symbol's exchange charges for real-time data and your account has no subscription for it. TradingView plans do not include those fees; buy the exchange's real-time package or verify a broker account. Cryptocurrency exchanges are real time on every plan.
Why is my indicator floating away from the candles?
It is pinned to No Scale or to a different scale than the main symbol. Right-click the indicator or its legend entry, open Pin to Scale and choose the scale the price uses, usually the right scale or Scale A.
Does Quant Charts have the same limits?
No. Quant Charts uses LuxAlgo market data from one provider with no exchange packages, so there is no delayed-data purchase. The Free plan allows 5 indicators per chart plus one Quant script and volume; paid plans are unlimited. History runs from 5,000 bars on Free to 50,000 on Ultra.
References
LuxAlgo Resources
- Quant Charts
- Charts overview: layouts, active cell, price animation
- Charts data: venues, PROVIDER:SYMBOL, history limits
- Charts indicators: Favorites, Object tree, plan limits
- Charts shortcuts
- Quant introduction
- Quant: making strategies
- LuxAlgo FAQ and plan limits
- Library: Floor Pivots
- Library concept: floor pivots
External Resources
- TradingView Status
- TradingView Help Center: Chart and/or indicators are being displayed incorrectly
- TradingView: My chart/cursor is slow
- TradingView: Color glitches (artifacts) suddenly appear on the chart
- TradingView: My chart looks compressed
- TradingView: Indicator moves separately or is not attached to the price
- TradingView: The script cannot rely on more than 10 indicators connected in a sequence
- TradingView: I've lost my chart drawings
- TradingView: Layouts, charts, drawings, indicators, and their interaction
- TradingView: Historical intraday data: bars and limits explained
- TradingView: How to purchase additional market data
- TradingView: Android: My chart is not displayed correctly
- TradingView: What to do if a tab crashes?
- TradingView: How to fix high memory and CPU usage in TradingView Desktop
- TradingView pricing and plan limits
- WebGL support check
Read next