Volume Grid Heatmap
 By LuxAlgoFeb 14, 2026
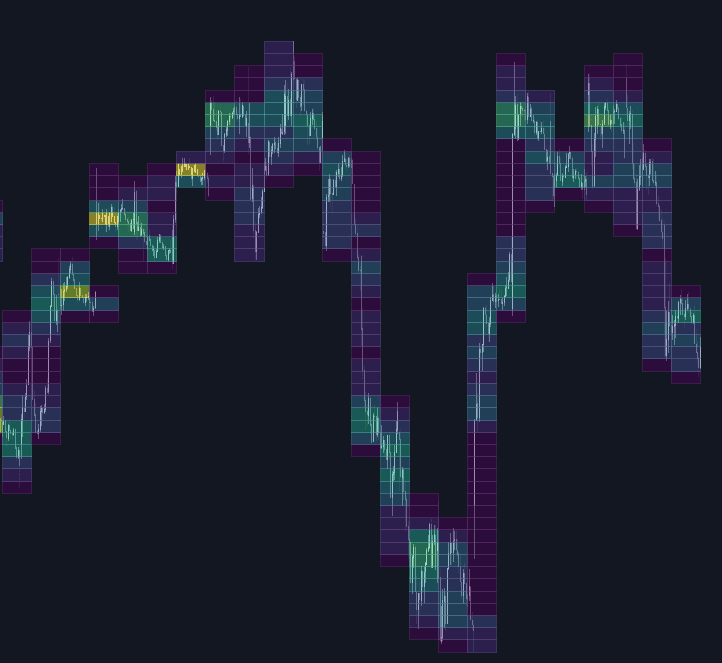

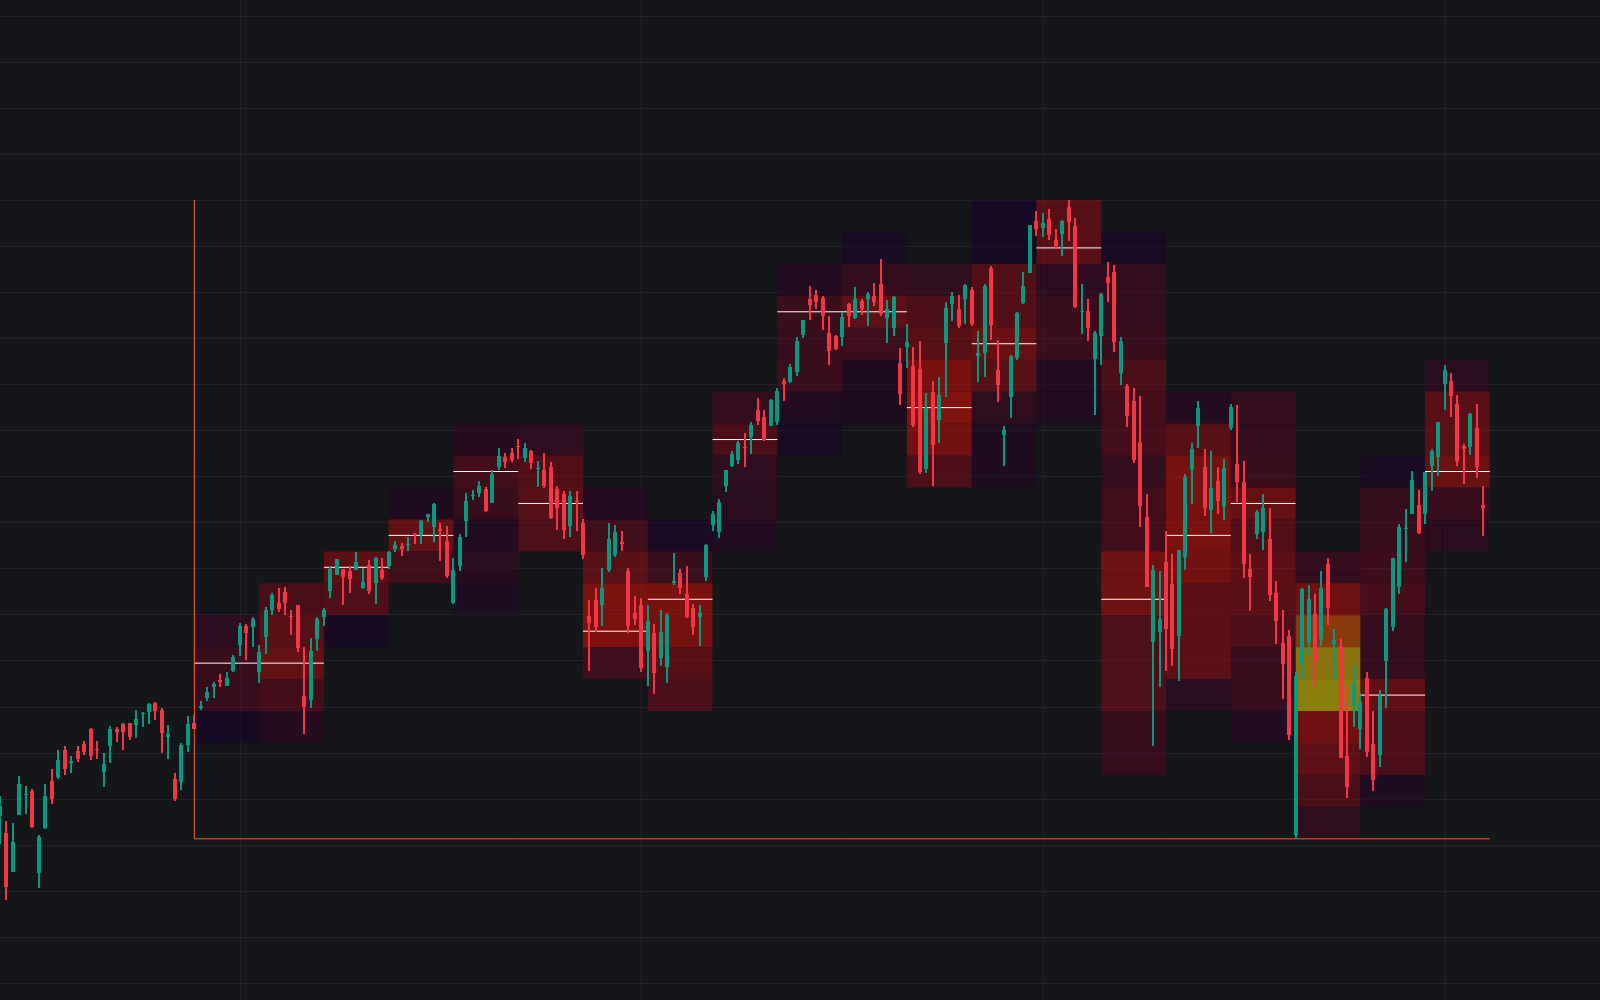
Volume Grid Heatmap converts a lookback window into a two-dimensional heat grid: rows are price levels, columns are time intervals, and each cell's color intensity reflects the volume traded there. Where a volume profile collapses the window into a single volume-at-price silhouette, the grid preserves the time axis, so a hot level reveals whether it was built by one violent burst or by steady interest across the whole range. Each bar's volume is distributed proportionally over the price rows its range overlaps, the grid is normalized against its busiest cell, and perceptually uniform colormaps keep the intensity scale honest.
How to Trade the Volume Grid Heatmap?
- Bright cells: heavy participation at that price and time, zones that often act as support, resistance, or price magnets on a revisit; watch for bounces, absorption, or clean breaks.
- Horizontal clusters: sustained trade at one price across many intervals builds the kind of high-volume nodes that define structure rather than noise.
- Isolated or vertical brightness: a lone bright cell points to a sharp spike from news, liquidations, or aggressive orders; a vertical stack shows activity packed into one time window. Both lean short-term.
Typical uses include confirming breakout retests, refining pullback entries and stop placement, and fading moves away from strong liquidity clusters in range-bound conditions.
Volume Grid Heatmap Settings
- Lookback Bars: the historical window measured. Shorter suits intraday work, longer exposes structural liquidity for swing trading.
- Rows (Price Resolution): vertical precision; more rows sharpen individual levels, fewer merge them into broader zones.
- Columns (Time Resolution): horizontal precision; more columns pinpoint when volume arrived, fewer simplify the overview.
- Heatmap Theme / Transparency: six perceptually uniform palettes (Viridis, Inferno, Magma, Plasma, Cividis, Turbo) plus grid opacity.
Frequently Asked Questions
Free on Vela
Run it on Vela. Go further with a paid plan.
- Up to 500 strategy alerts, with webhook automation
- Up to 10× the chart history of Free
- Orderflow lookback up to full history
- More Quant usage to customize it, plus extra usage when you need it
- Futures data alongside crypto, stocks, forex and commodities
Also works on

Related indicators
All 30 Volume Profile indicators
.png&w=3840&q=75)
Run it on Vela. Make it yours with Quant.
Open this indicator free on Vela, our next-generation charting platform. Then ask Quant, our coding agent built into Vela, to retune it or turn it into a backtested strategy of your own.