Volume Profile with Node Detection
 By LuxAlgoApr 25, 2024
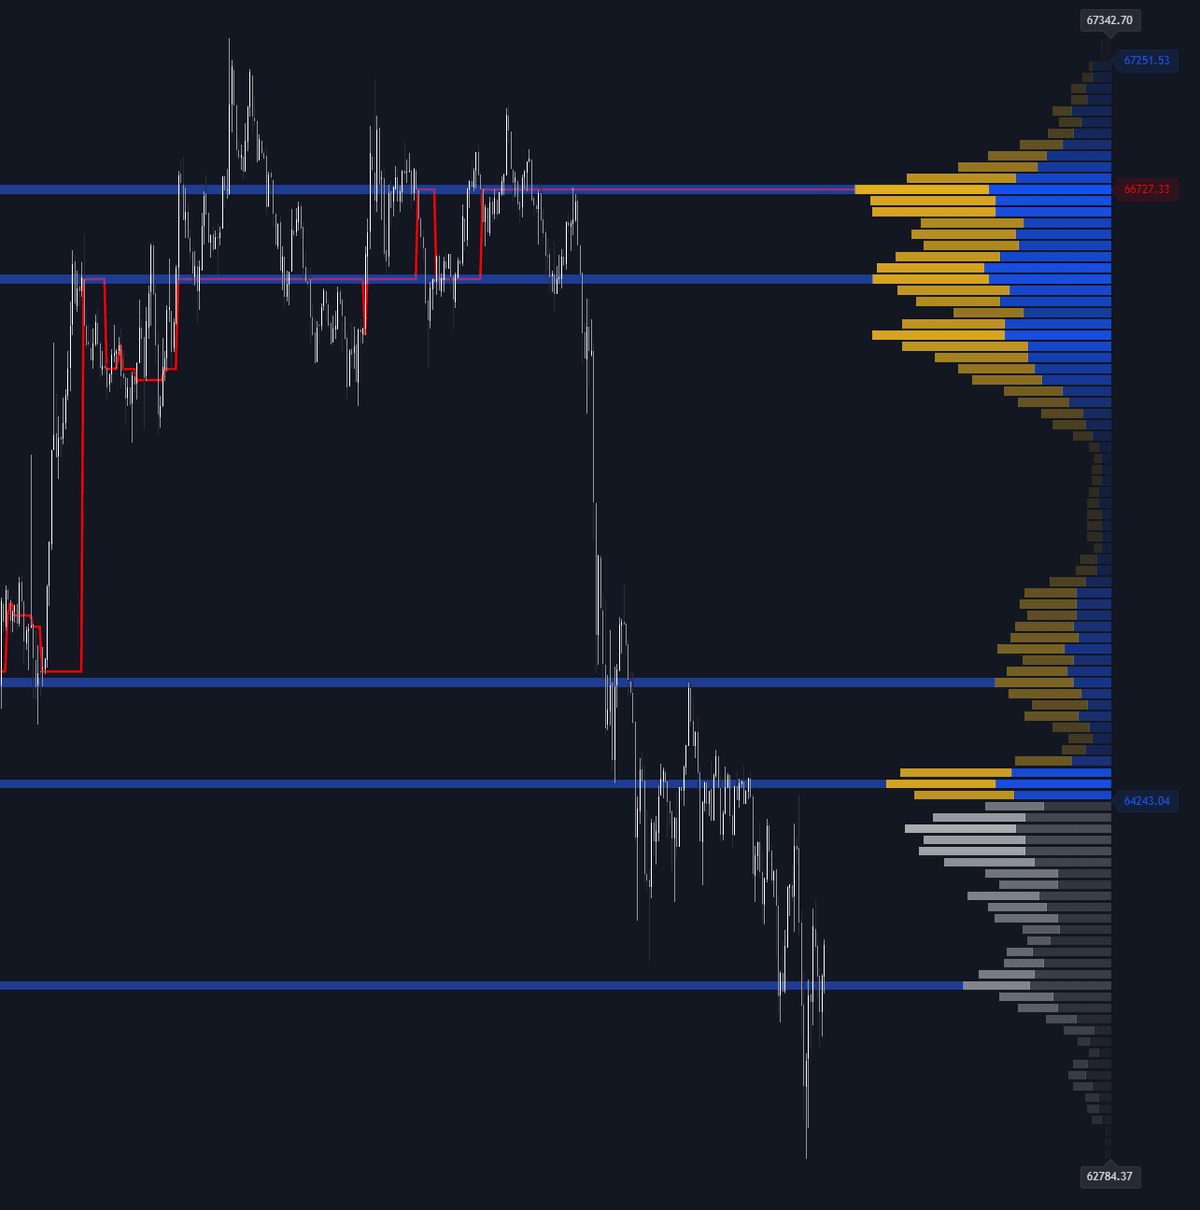
Volume Profile with Node Detection charts the volume distribution by price over a lookback window, then finds its significant nodes automatically. A peak node is a level whose volume exceeds the N rows on either side of it; a trough is the mirror case, surrounded by heavier rows. Peaks and their neighbors group into clusters that typically mark consolidation — concentrated, two-sided business — while troughs expose prices the market showed little interest in holding.
How to Trade the Volume Profile with Node Detection?
- Peak nodes and clusters: heavy-acceptance zones where price tends to stall or rotate — reference points for entries, exits, and anticipating reversals or breakdowns.
- Trough nodes: thin levels with waning interest; price is more likely to transit them quickly than to base there.
- Highest and lowest volume nodes: the profile's extremes — the top nodes sit around the point of control as maximum acceptance, while the lowest flag outright rejection.
The underlying profile bins traded volume into price buckets across the window, so every detected node is grounded in the same histogram traders already know how to read.
Volume Profile with Node Detection Settings
- Volume Peaks: shows detected peaks as "Peaks" or as "Clusters".
- Node Detection Percent %: the percentage threshold used for peak calculation — raise it to keep only dominant nodes, lower it to catch more.
- Volume Troughs: shows troughs as "Troughs" or "Clusters".
- Highest & Lowest Volume Nodes: how many of each extreme stay visible.
- Profile Lookback Length & Width: the window measured and the space the profile occupies.
- Display options: classical or gradient profile style, control points and area values, placement, and background colors.
Frequently Asked Questions
What exactly is a volume node?
A price area whose traded volume stands out from its surroundings — heavy nodes mark acceptance and candidate support/resistance, thin ones mark rejection. This build detects both varieties for you instead of leaving the histogram to visual inspection.
Can I combine it with supply and demand analysis?
Naturally — volume clusters frequently overlap supply and demand zones, and confluence between the two strengthens a level. Supply & Demand Profiles approaches that confluence from the opposite direction.
How do I access Volume Profile with Node Detection?
Free, via the LuxAlgo Library. Ideas built on it can also be backtested in Quant, LuxAlgo's AI, before they touch a live chart.
Free indicator
Get free access to this indicator on the platforms below.

The Library is free. Quant makes it yours.
Pull any concept or indicator into Quant: rebuild it, retune it, or turn it into a backtested strategy of your own.