Anchored Indicators: Pinpointing Market Trends
Anchored indicators measure price behavior relative to a chosen starting point or reference. Anchored VWAP (AVWAP) accumulates volume-weighted prices from an event such as an earnings release, breakout or confirmed swing. Anchored momentum uses a different idea: comparing current price with a moving-average baseline. Understanding that distinction helps you choose the right tool and avoid treating every “anchor” as an event timestamp.
Use LuxAlgo’s charting and AI platform to inspect these measurements on Quant Charts and develop explicit rules with Quant, our coding agent. The goal is a reproducible comparison with market context, not an indicator that guarantees support, resistance or a profitable reversal.
Key Takeaways
- AVWAP depends on the anchor, price source, volume feed and included sessions.
- A custom event anchor differs from an automatic day, week or month reset.
- Moving-average anchored momentum is a separate calculation from event-anchored AVWAP.
- An anchor selected after seeing a favorable reaction introduces hindsight into a test.
- Crosses, retests and overlapping lines need explicit entry and risk rules.
Using Anchored VWAP
AVWAP Mechanics
For an anchor bar a through the current bar t, the bar-based calculation is AVWAP = Σ(priceᵢ × volumeᵢ) ÷ Σ(volumeᵢ). Specify the price source, such as close or HLC3, where HLC3 = (high + low + close) ÷ 3. The result is a volume-weighted average of those selected bar prices, not a complete ledger of every participant’s cost basis.
If three bars have source prices of $100, $102 and $101 with volumes of 200, 100 and 300, the weighted sum is $60,500 and total volume is 600. AVWAP is therefore about $100.83. Starting instead at the second bar gives $40,500 ÷ 400 = $101.25. The different answer comes from the anchor, even though the final price is unchanged.
Before the anchor, the study should return no value. With zero cumulative volume, the division is undefined; missing volume should not be silently converted into a reliable VWAP. Bar-based results can also differ across timeframes because aggregating candles changes the selected price approximation.
| Tool | Reference or reset | What it measures |
|---|---|---|
| Session VWAP | Resets at a defined session boundary. | Volume-weighted price within that session. |
| Periodic VWAP | Resets by a configured day, week or month. | Volume-weighted price in the current calendar window. |
| Custom anchored VWAP | Starts at a selected timestamp or bar. | Cumulative volume-weighted price since that anchor. |
| Rolling moving average | Uses a moving lookback window. | A different reference that drops older observations. |
| Anchored momentum | Uses a moving average as its baseline. | Current price relative to that average; not necessarily event-anchored. |
Standard indicators are not inherently limited to one timeframe, and not all anchored tools use volume. Choose the calculation according to the question being asked rather than assuming that “anchored” always means more accurate or less noisy.
Setting Anchor Points
Useful candidates include the first bar after an earnings announcement, a breakout beyond a previously marked range, a confirmed swing high or low, or a session with unusual activity. Record why the anchor was chosen and when that information became available.
- Event anchor: specify the announcement timestamp and the first included trading bar, accounting for the exchange time zone and session.
- Breakout anchor: define the prior boundary and the close or trade that confirms the break.
- Swing anchor: a pivot requiring later bars is not known at the pivot’s timestamp. Start decisions only after confirmation.
- Volume anchor: state the baseline and threshold instead of choosing the largest spike after reviewing the whole chart.
A manually moved anchor recalculates the entire line. Preserve the original anchor in your research record rather than replacing an unsuccessful choice with a better-looking one. Multiple anchors are reasonable when each represents a distinct question, but a crowded chart can make almost any price appear near one reference.
Reading AVWAP Signals
Price above AVWAP means it is above the selected volume-weighted reference; price below means the opposite. A rising line and sustained closes above it can support a trend hypothesis, but neither establishes who is buying nor guarantees that all buyers since the anchor are profitable.
Define a breakout or cross precisely: for example, a completed close moving from below to above the line. A retest is a different setup and needs its own touch tolerance, confirmation and expiry. Repeated crossings in a range can produce whipsaws.
Several AVWAPs near the same area may create a useful reference zone, but the lines often share much of their underlying data. Their agreement is not independent proof of a high-probability trade. Standard-deviation bands describe dispersion under the indicator’s calculation; they are not guaranteed reversal boundaries or probabilities of future price containment.
Anchored Momentum Analysis
Momentum Indicator Basics
In Ron Rowland’s anchored momentum explanation, the reference is a moving average instead of one historical closing price. A percentage version can be specified as 100 × (current price ÷ moving average − 1). State the average type and length; the name alone is not a complete formula.
A two-point 21-bar return changes when either today’s price or the price leaving the lookback comparison changes. A moving-average baseline spreads that historical influence across several observations. This can smooth the reading, but it does not eliminate lag, false signals or parameter sensitivity.
Spotting Trend Reversals
Rowland’s March 2015 article illustrates how a January 16 peak in a lookback-momentum reading differed from the price behavior shown in a six-month SPY example. That is an illustration of reference-point sensitivity, not broad evidence that anchored momentum always finds reversals more accurately.
A zero-line crossing indicates that price has crossed its chosen moving-average baseline. A turning oscillator value does not necessarily mean price has reversed. Define any divergence, threshold or confirmation condition and test it separately. Selecting an earnings-date anchor is relevant to event-based studies, but it does not automatically configure this moving-average momentum calculation.
Integration with Other Tools
AVWAP can provide an event-based price reference while momentum describes price relative to a rolling baseline. RSI, ordinary moving averages and volume observations can add context, but combining several related transformations of price is not a guarantee of independent confirmation.
Keep the chosen settings fixed through the evaluation period. If you change lengths for volatile conditions, specify the rule that triggers the change using information available at the time.
Trading Implementation Guide
Setup Instructions
The LuxAlgo Anchored VWAP Library page provides a custom Anchor time, a price Source, optional Bands and a Multiplier. Its documented default source is HLC3 and the bands are disabled by default. Use the Open on Quant Charts workflow and verify the selected timestamp before interpreting the line.
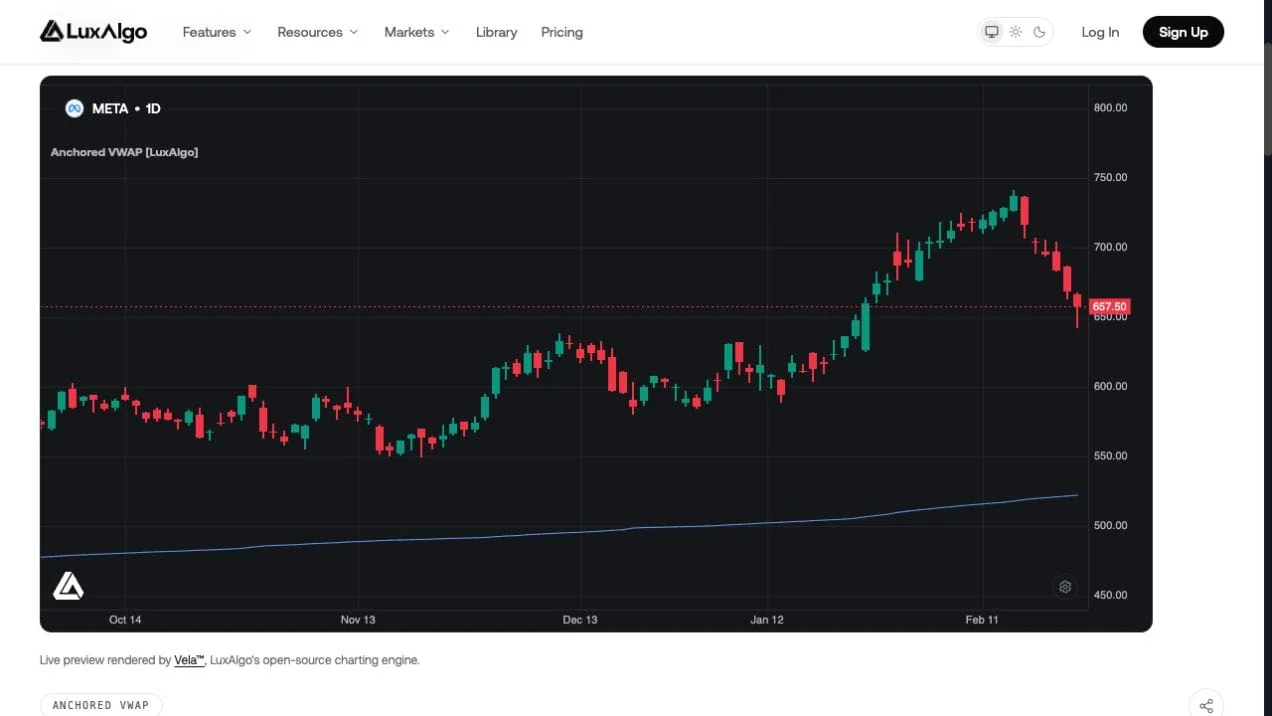
Keep that custom-anchor implementation distinct from native VWAP Bands under Indicators → Orderflow. The documented native tool restarts on UTC Day, Week or Month boundaries and supports HLC3, OHLC4 or Close as its source. A calendar reset is useful for periodic context but is not an arbitrary earnings-date anchor.
| Setup choice | Record before analysis | Why it matters |
|---|---|---|
| Anchor | Timestamp, time zone, first included bar and selection rule. | Changing the start changes the weighted history. |
| Data | Symbol, venue, volume coverage and adjustment settings. | Different feeds and corporate-action handling can change results. |
| Session | Regular, extended or other defined session. | Excluded bars also exclude their volume. |
| Calculation | Source, band method and any reset condition. | Different implementations may share a name but differ numerically. |
| Decision | Completed-bar trigger, expiry and execution assumption. | A historical line is not itself an executable strategy. |
Trade Entry and Exit Rules
A possible long plan waits for a completed close above AVWAP and a later specified trigger; a short plan uses the corresponding condition below. Crossing the line can also be an exit condition, but it should not be treated as the only valid management rule. Define whether the entry occurs at the next open, on a stop order, or after a retest.
Choose targets from pre-existing structure or an explicit reward-to-risk rule. A moving reference may change after entry, so record whether the stop tracks it continuously, updates only at completed closes, or remains fixed. Test each version as a different strategy.
Risk Control Methods
For a hypothetical long entered at $51.50 after confirmation, a $49 stop creates $2.50 planned risk per share. A $150 risk budget permits 60 shares before costs. A $56.50 target offers $5 per share, or 2R. The stop might be below a structural low; it need not sit an arbitrary distance beneath AVWAP.
Allow for spreads, fees and slippage when sizing. A dynamic stop does not lock in a guaranteed profit, and an overnight gap can cross the planned stop price. If using several targets, define the fraction exited at each level and how the remaining stop changes.
Multiple Timeframe Methods
Timeframe Selection
| Trading style | Broader view example | Setup and entry views example |
|---|---|---|
| Swing trading | Daily. | Four-hour setup, one-hour trigger. |
| Day trading | One-hour. | 15-minute setup, five-minute trigger. |
| Scalping | 15-minute. | Five-minute setup, one-minute trigger. |
These are examples rather than optimal combinations. Choose intervals that fit the holding period, liquidity and data coverage. Lower timeframes expose more intrabar detail but do not automatically make a signal more useful.
Use the same intended anchor event across views and document how a timestamp falling inside a larger candle is handled. A daily HLC3-based AVWAP need not equal one calculated from intraday bars, even with similar starting points. Apparent agreement can partly reflect shared data rather than separate confirmation.
Signal Confirmation
Higher-timeframe conditions must use candles completed by the lower-timeframe decision. A four-hour close cannot confirm a trade placed two hours earlier. Specify which view sets the trend, which supplies the trigger and how conflicts are resolved; neither timeframe automatically takes control of every trade.
Example Trades
Consider a hypothetical bearish setup: the four-hour chart shows a prior resistance area and price beneath an AVWAP whose anchor was chosen earlier. A 15-minute head-and-shoulders candidate develops below that area. A completed neckline break can be a trigger under the plan, but the pattern can fail and the stop must be defined before entry.
- Record the broader context and anchor selection before the lower-timeframe pattern completes.
- Wait for the required trigger and calculate size from the actual entry and invalidation.
- Manage according to the stated rules, recording any deviation.
- Review both the favorable outcome and comparable failed setups.
Researching Anchors with Quant
Use Quant Charts to compare event context and calculation settings. The supplied drawing-tool demonstration shows organizing chart references; drawing a vertical marker does not by itself change an indicator’s anchor input.
Ask Quant, our coding agent, to build a transparent study:
Add a configurable anchor timestamp and calculate cumulative HLC3 times volume divided by cumulative volume from the first included bar. Return no value before the anchor or when cumulative volume is zero. Do not reset automatically. Mark completed close crossings and report the next five-bar return without assuming order fills. Record the symbol, session and anchor in the output.
Inspect the generated code and run it manually, following Making Strategies with Quant. Check hand calculations on a small sample before adding trend filters or strategy execution. For anchored momentum, request its separate moving-average formula explicitly.
Evaluate unseen periods and alternative predeclared anchors. Keep a record of every anchor or parameter tried, include losing examples, and avoid selecting only the line that fit a later reversal. Strategy tests also need entry timing, costs, sizing, overlap and intrabar execution assumptions.
How To Set Proper Anchors With VWAP
Summary and Next Steps
Key Points Review
An anchor makes the reference explicit; it does not remove uncertainty. AVWAP accumulates price and volume from a selected start, while anchored momentum compares price with a moving average. Both need defined inputs, context and decision timing.
Getting Started
Begin with one event and one AVWAP. Verify the calculation and observe crossings, failed retests and periods of no useful interaction. Add a second anchor only when it represents a distinct question, then use Quant to evaluate rules that can be reproduced.
Additional Tools
Other anchored studies can summarize a chosen range. For example, LuxAlgo Supply and Demand Anchored estimates zones from volume within a selected start and end window. It is different from cumulative AVWAP and does not reveal every resting order.
Anchored volume-by-price, accumulation/distribution and stop studies also require their own definitions and platform support. An anchored Chandelier, volatility stop or trailing stop is not automatically the same as a tool merely linked under that name. Verify the actual formula and reset behavior before using it for trade management.
Frequently Asked Questions
How is anchored VWAP calculated?
Sum the selected bar price multiplied by volume from the anchor, then divide by cumulative volume over the same bars. State the price source and handle zero or missing volume.
Does AVWAP always reset daily?
No. A custom anchored VWAP starts at a chosen bar and can continue until changed. Session or periodic VWAP uses a separate automatic reset rule.
Is anchored momentum the same as anchored VWAP?
No. Moving-average anchored momentum compares current price with a moving-average baseline, while AVWAP accumulates volume-weighted prices from a selected start.
Can I choose any historical swing as an anchor in a backtest?
The anchor rule must account for when the swing became identifiable. A pivot confirmed by later bars cannot support an earlier decision without hindsight.
Do multiple AVWAP lines guarantee strong support?
No. They are reference levels and often share underlying observations. Define a reaction and invalidation rule rather than treating overlap as independent proof.
Can Quant research a custom anchor?
Yes. Specify timestamp handling, source, volume, reset behavior and outcomes. Inspect the generated code and run it manually before adding execution and risk rules.
References
LuxAlgo Resources
- LuxAlgo Quant
- Making Strategies with Quant
- Anchored VWAP
- Quant Charts: VWAP Bands
- Quant Charts Data and Market Coverage
- Supply and Demand Anchored
External Resources
Read next