Concept
VWAP Bands
VWAP Bands, also known as standard-deviation bands, percentage bands, are Volume & Order Flow concepts. The Library holds 3 implementations, each one a working definition you can pull into Quant.
Top VWAP Bands indicators
The top custom implementations, built on the original standard VWAP Bands formula.
3 total
Every VWAP Bands implementation here is strategy-ready: open one in Quant, set your rules, and it backtests automatically.
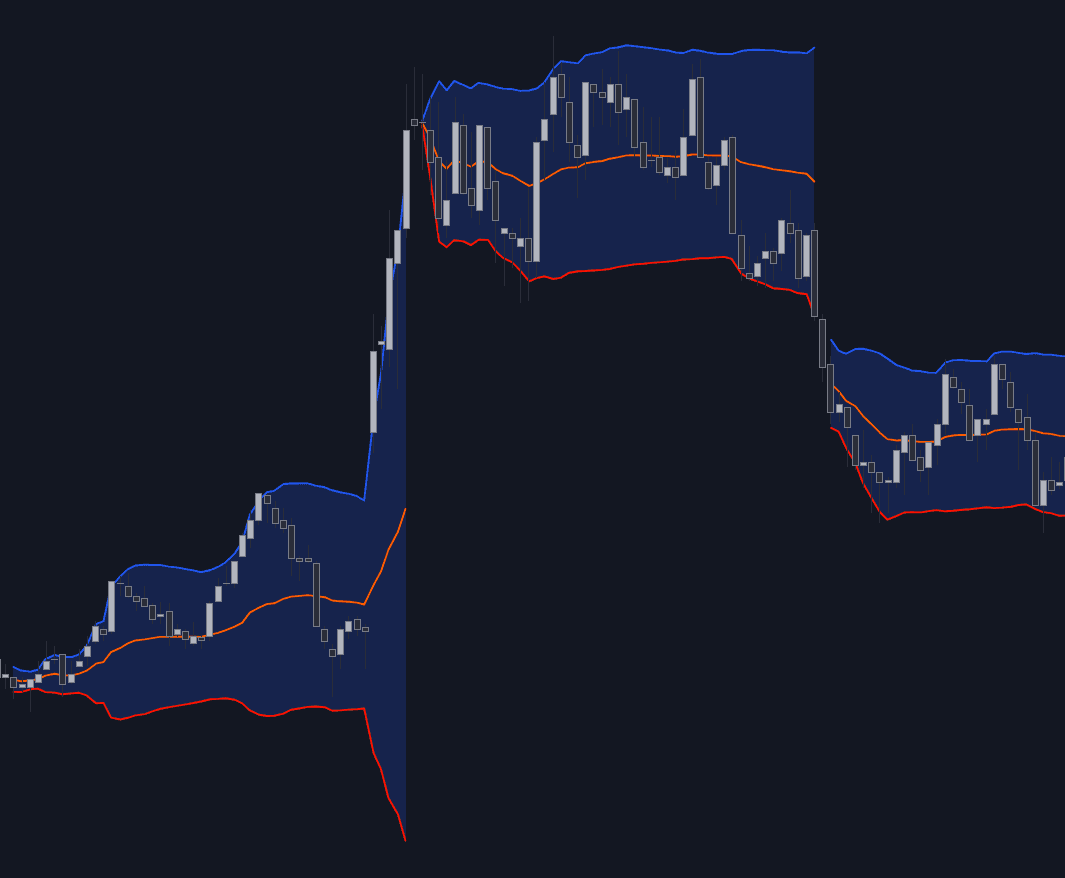
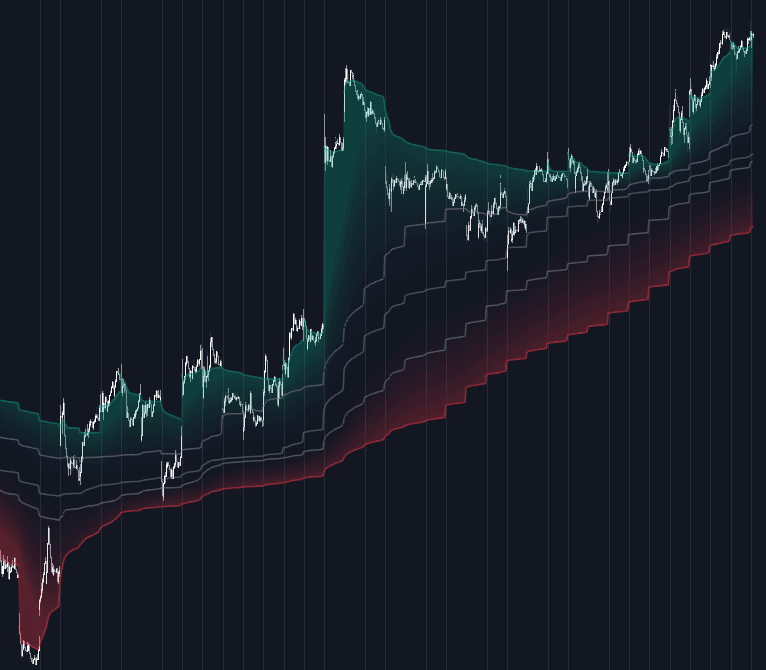
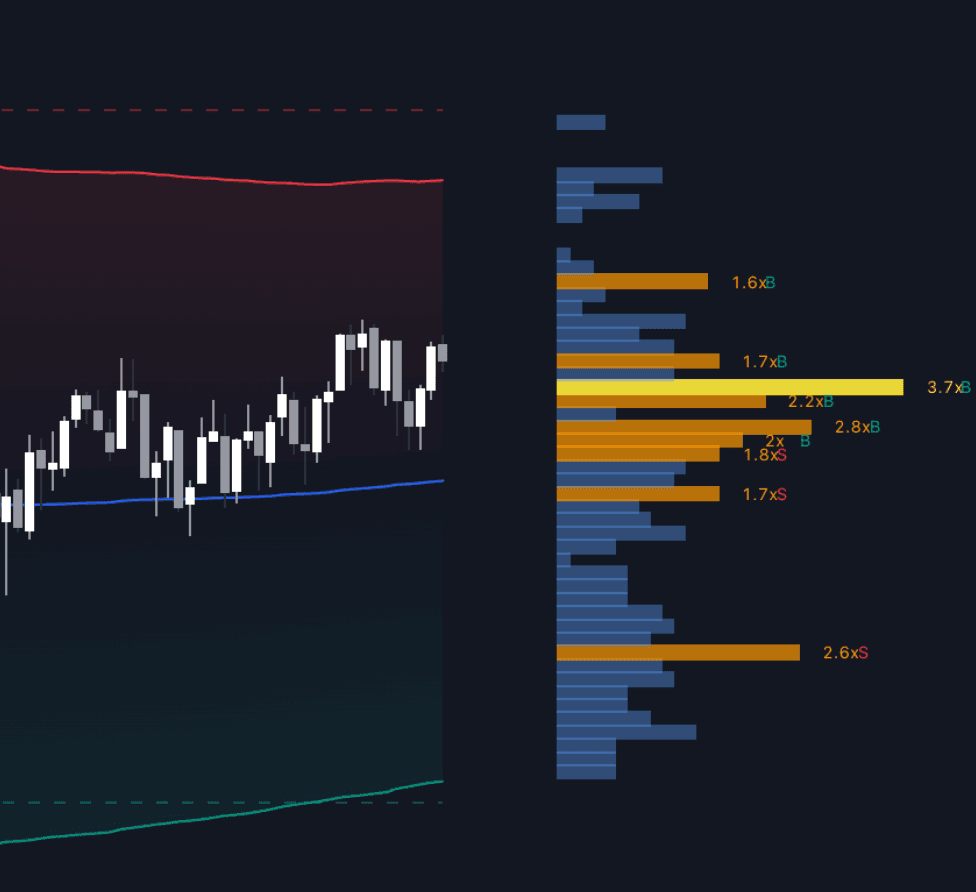
What are VWAP Bands?
VWAP bands are envelopes drawn above and below a volume-weighted average price line. Start from a base VWAP, most commonly a session VWAP but equally an anchored or rolling variant, then offset it by a chosen amount on each side. Two constructions dominate: standard-deviation bands, which measure how far price has dispersed around the running VWAP since the anchor (usually volume-weighted) and plot multiples such as 1x, 2x, and 3x that deviation; and percentage bands, which sit at fixed percent offsets. Implementations differ on the exact deviation formula, so two platforms can print slightly different bands from the same data.
The bands frame how stretched price is relative to the volume-weighted average. Trading near the +2 deviation band means price sits well above the average price at which volume has traded since the anchor, a volume-aware form of overbought/oversold. Band width itself carries information: expanding bands record a session whose dispersion is growing, while tight bands describe a balanced, compressed one.
VWAP bands matter because they anchor the idea of "stretched" to actual traded volume rather than to a fixed lookback average. That said, the bands are descriptive, not predictive: on one-sided trend days price can open beyond a band and stay there into the close, so an outer-band touch is context for a decision, never a signal by itself.
How to calculate VWAP Bands
The bands derive from the same cumulative series as the underlying VWAP, so every value resets at the anchor.
- 1Compute the base VWAP from the anchor: cumulative (typical price x volume) divided by cumulative volume, bar by bar. Session open is the default anchor; weekly, monthly, or event anchors work the same way.
- 2Measure dispersion. The common choice is a volume-weighted standard deviation of price around the running VWAP since the same anchor; simpler versions substitute a fixed percentage of the VWAP value.
- 3Plot bands at the chosen multiples, typically 1x, 2x, and 3x the deviation (or the fixed percents) above and below the VWAP line.
- 4Treat early-session values with suspicion: minutes after the anchor there are few observations, so the deviation estimate, and therefore the bands, whipsaws before settling down.
How it's calculated
Envelopes drawn around the session's volume-weighted average price at fixed multiples of a dispersion measure, or at fixed percentage offsets.
All sums reset at the anchor; anchored VWAP uses any chosen start such as a week, month, or event bar.
sigma is the volume-weighted standard deviation of typical price around VWAP; some platforms substitute a plain standard deviation of price over the session.
Percentage bands avoid the unstable sigma readings that occur in the first bars after the anchor.
How traders use it
- As mean-reversion context on balanced days: fades from the outer bands back toward the VWAP midline are the classic use, ideally filtered by a regime read such as VWAP mean-reversion vs trend regimes so the same trade is not taken on a trend day.
- As a trend-day tell: price that opens above the +1 band and refuses to close back inside it is advertising one-sided delivery. Band-riding along an outer band argues for joining pullbacks, not fading strength.
- As entry location with the trend: pullbacks to the VWAP line or the first band on the trend side offer a defined area to work orders, with the opposite band mapping the reversion risk.
- As target and risk scaffolding: reversion trades initiated at an outer band commonly target the VWAP or the opposite first band, with stops sized beyond the next deviation multiple.
VWAP Bands vs other band studies
Bollinger Bands: Bollinger Bands wrap a rolling moving average with a time-based standard deviation over a fixed lookback. VWAP bands wrap a cumulative, volume-weighted average from an anchor and typically weight the deviation by volume, resetting at each new anchor.
Keltner Channels: Keltner Channels offset an EMA by a multiple of ATR, so their width tracks bar range rather than dispersion around a volume-weighted mean. They never reset; VWAP bands restart at every anchor.
ATR Bands: ATR bands offset price or a moving average by an ATR multiple to frame typical bar-to-bar movement. VWAP bands measure how far price has strayed from the volume-weighted average, a positioning read rather than a range read.
MA Envelope: A moving-average envelope shifts a rolling MA by fixed percentages, structurally the same idea as percentage VWAP bands but centered on a time-weighted average instead of a volume-weighted, anchored one.
Concept family
Volume & Order Flow
88 concepts mapped · 88 in the Library
VWAP Bands FAQ
Turn VWAP Bands into a trading strategy.
Take any implementation from this page into Quant, then build on it, backtest it on real data, and keep refining it in conversation.