Bullish Chart Patterns Explained
Bullish chart patterns describe price structures that traders study for potential upward moves. They organize observations about swings, boundaries and breakouts; they do not predict an inevitable rally. A useful setup needs a defined trigger, an achievable entry, an exit rule and a position size that accounts for failure.
This guide covers double bottoms, cups and handles, and ascending triangles. Start with the price structure, then test whether volume or momentum conditions add value. Use native LuxAlgo charts to inspect examples and Quant, our coding agent, to help express reproducible strategy rules. Keep a favorable historical illustration separate from evidence about future returns.
- Identify: define the prior trend, selected swings and pattern boundaries before the outcome is visible.
- Wait for the stated trigger: an intraday break, completed close and later retest are different rules.
- Plan: measure a possible target, calculate actual entry-to-stop risk and allow for gaps and costs.
- Evaluate: retain failed setups and compare consistent rules across a complete sample.
Recognize the Structure Before Naming the Pattern
| Element | What to identify | What it cannot establish |
|---|---|---|
| Prior trend | A defined advance, decline or range before the formation | A reversal or continuation label without context. |
| Boundaries | Selected highs and lows, with an explicit tolerance for near-equal prices | An exact barrier that price must respect. |
| Breakout | The price event that completes your chosen rule | An assured follow-through move. |
| Volume | Activity relative to a stated baseline on the selected feed | Who traded, their intentions or guaranteed reliability. |
A reversal setup studies a possible change from a prior decline; a continuation setup studies a pause within an advance. The same broad shape can occur in different contexts. A triangle after a downtrend is not automatically an uptrend continuation, and two nearby lows alone do not complete a double-bottom reversal.
Record how many swing points are required, which prices define them, and how much variation is allowed around a boundary. If a swing requires later bars to identify it, record when it becomes knowable rather than pretending it was available at the earlier turning point. Avoid redrawing the boundary after every failed break.

Volume may contract during consolidation and expand during a break, but neither behavior is universal. The bars alone do not prove accumulation by informed traders or identify institutional orders. Define the comparison period and account for the exchange, session and whether the feed provides traded volume or tick activity.
Double Bottom: A Potential Reversal
A double bottom forms after a decline, with two lows around a similar area separated by a rebound. The intervening high provides the neckline. Under a close-based breakout rule, the setup completes when price closes above that level; the second low by itself is still an uncompleted candidate.
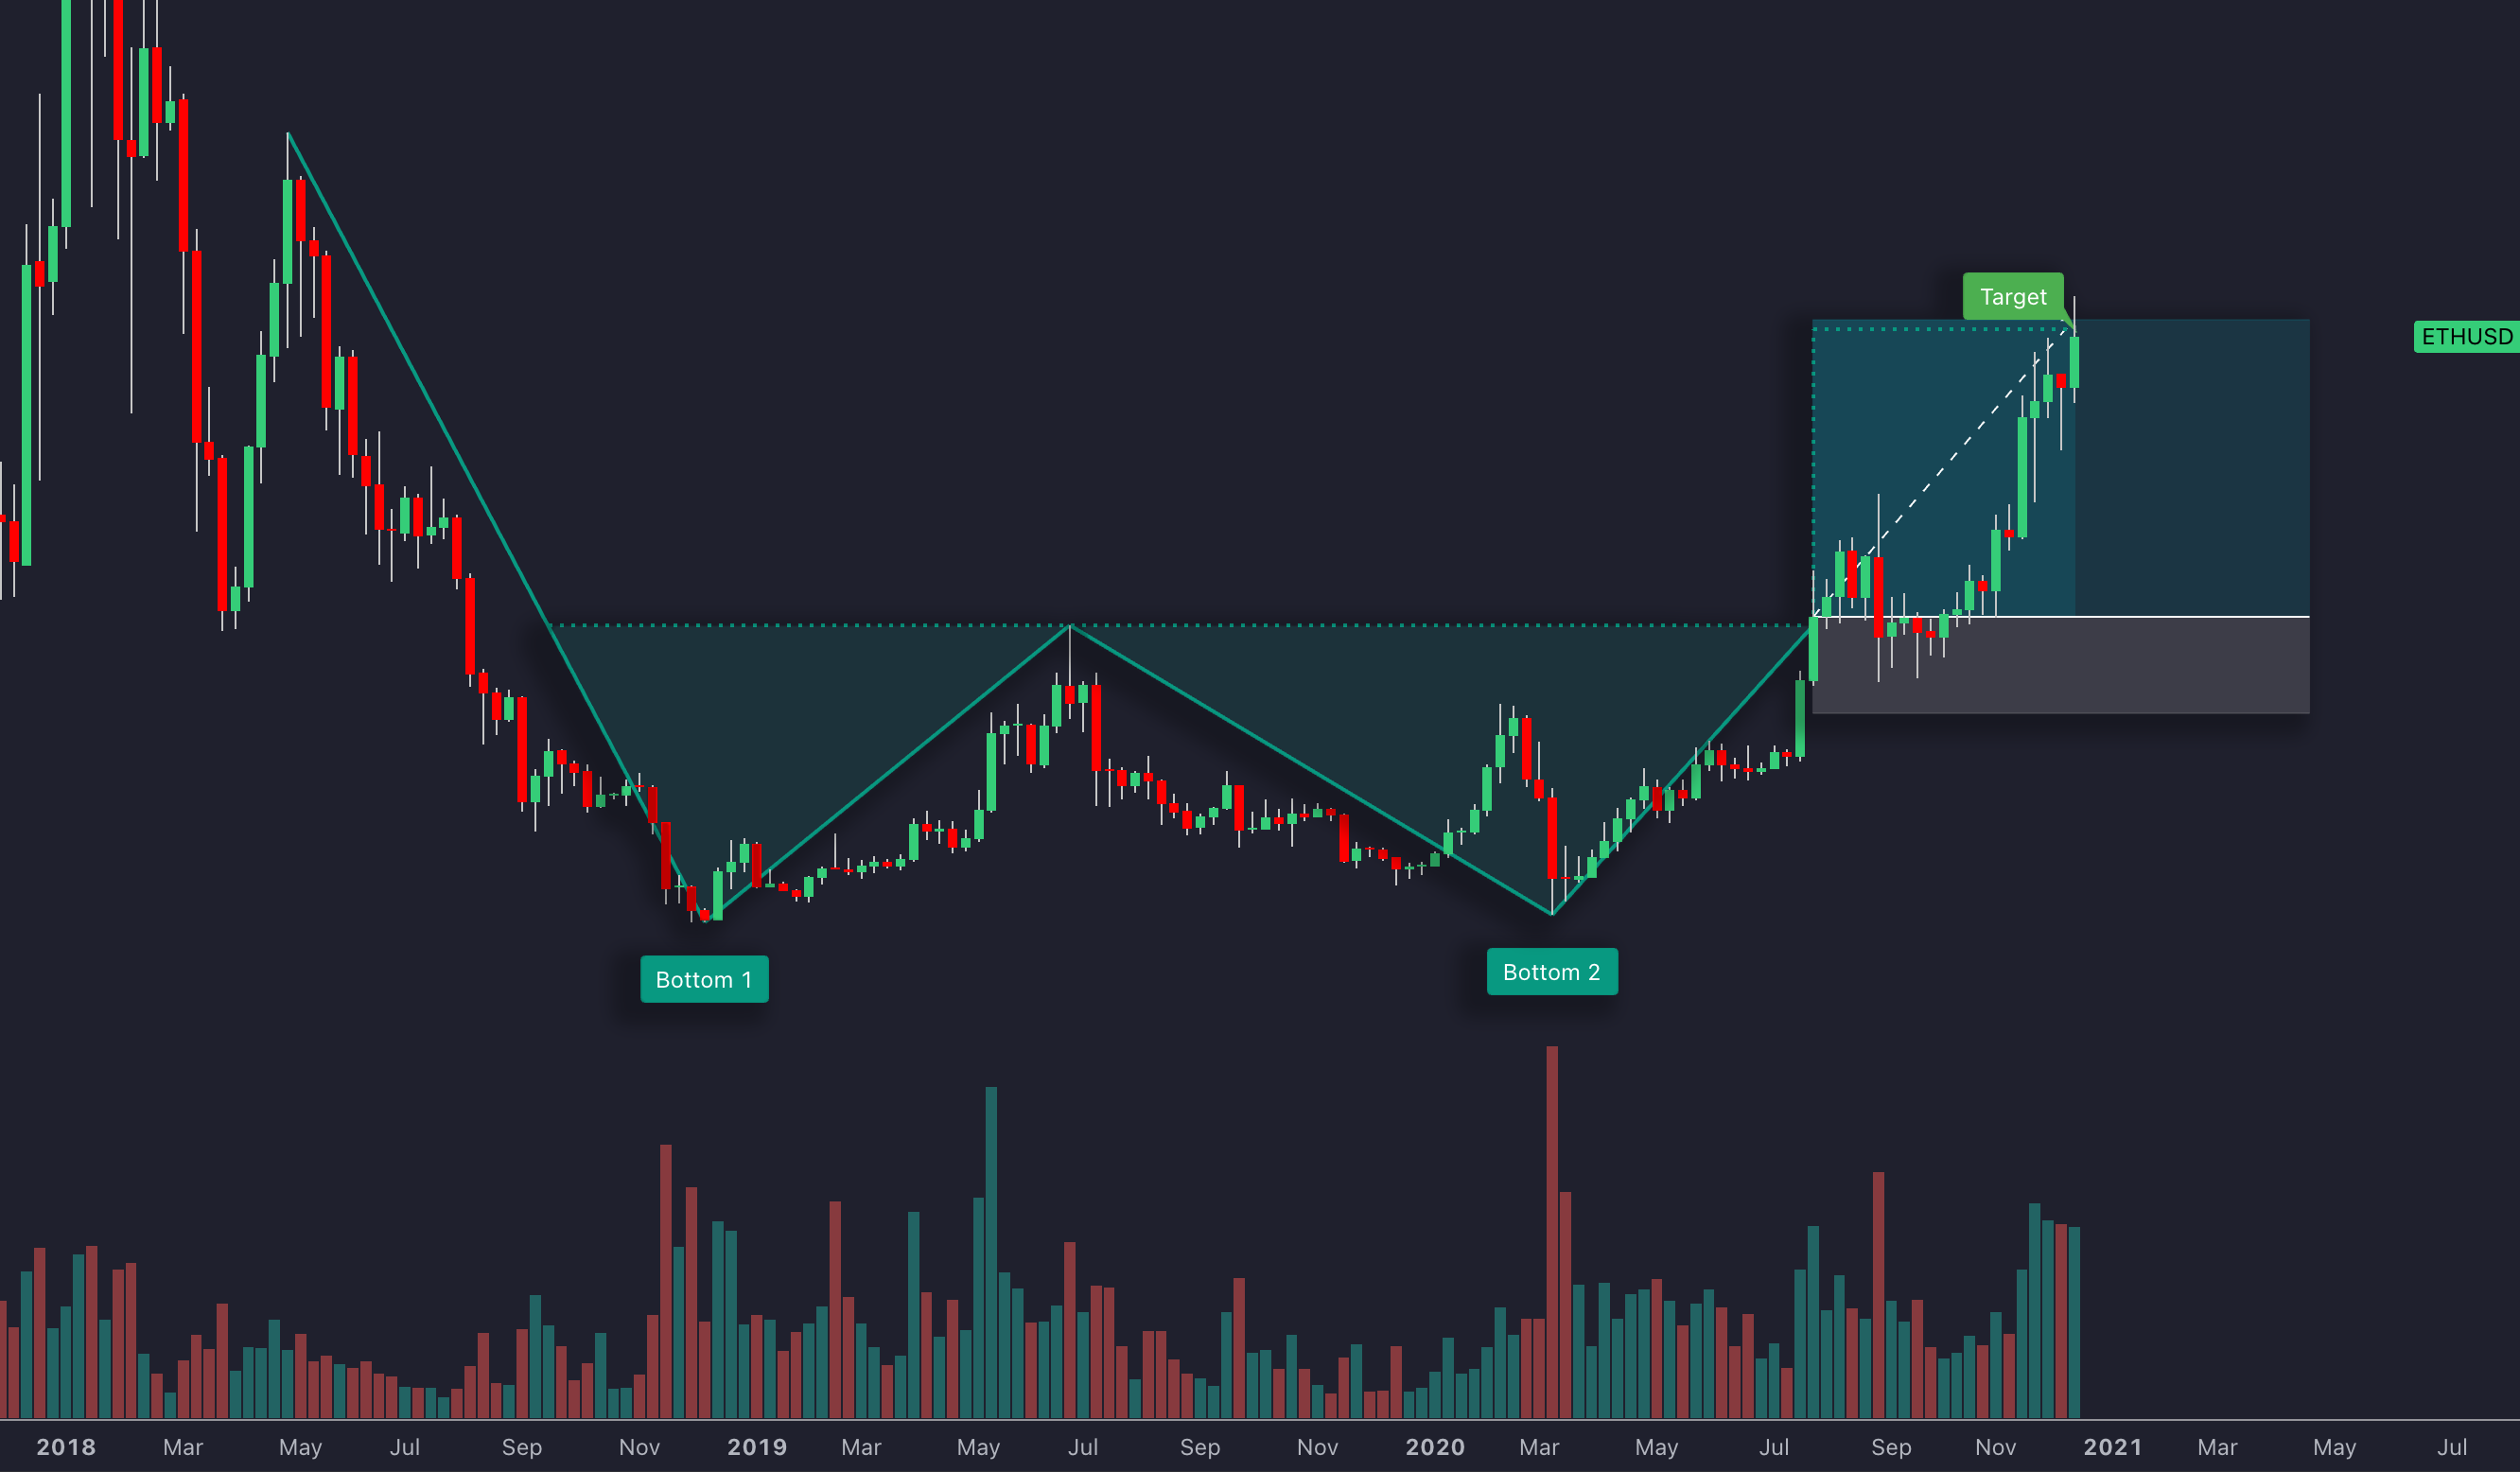
Specify the permitted difference between the lows, their separation, the minimum intervening rebound and the trigger. A second low slightly below the first and an exactly equal retest may both fit some definitions, but they are different conditions if your detector requires strict equality.
Hypothetical example: lows around 45 and a neckline at 50 give a five-unit pattern height. Projecting that height above 50 gives a measured objective of 55. If the actual entry is 51, the distance to that objective is four, not five. This arithmetic describes a projection; it does not promise that price reaches it.
A stop below the second low is one structural approach, but it may be far from the entry. A tighter stop changes the trade and can be reached during an ordinary retest. State the stop location and position size together, and specify what happens if the neckline break fails.
Cup and Handle: A Rounded Base and Smaller Pullback
A cup and handle is commonly studied as a continuation formation after an advance. Price forms a rounded base, returns toward the earlier rim and then makes a smaller consolidation or pullback near the upper part of the base. A breakout through the defined handle boundary or rim is a separate trigger that must be specified.

Define cup depth relative to the prior advance, duration, rim tolerance and maximum handle depth. A one-third retracement is a possible screening choice, not a condition that universally validates the formation. A sharp V-shaped recovery and a rounded base also represent different price paths.
Hypothetical example: a rim at 80 and cup low at 60 produce a depth of 20 and a simple rim-based projection of 100. If the handle slopes downward, its local breakout price may be below 80. Specify whether the strategy requires a handle break, a rim break or both, and keep the target convention consistent.
The familiar explanation that a handle removes weaker holders is an interpretation, not direct evidence of trader identity. Likewise, a quoted success percentage is unusable without the pattern definition, market, dates, failure threshold and costs. Do not apply a fixed 65% or 68% expectation to a new cup-and-handle trade.
Ascending Triangle: Horizontal Resistance and Rising Lows
An ascending triangle has approximately horizontal upper resistance and a rising lower boundary. It often appears during an advance, but it can break downward. Define the tolerance for a nearly flat upper boundary rather than treating every formation with higher lows as the same pattern.
Hypothetical example: resistance at 120 and the selected lowest point of the formation at 108 give a height of 12. An upward measured objective from 120 is 132. The chosen base, breakout timing and actual fill must all be recorded; entering at 124 leaves only eight units to that projected level.
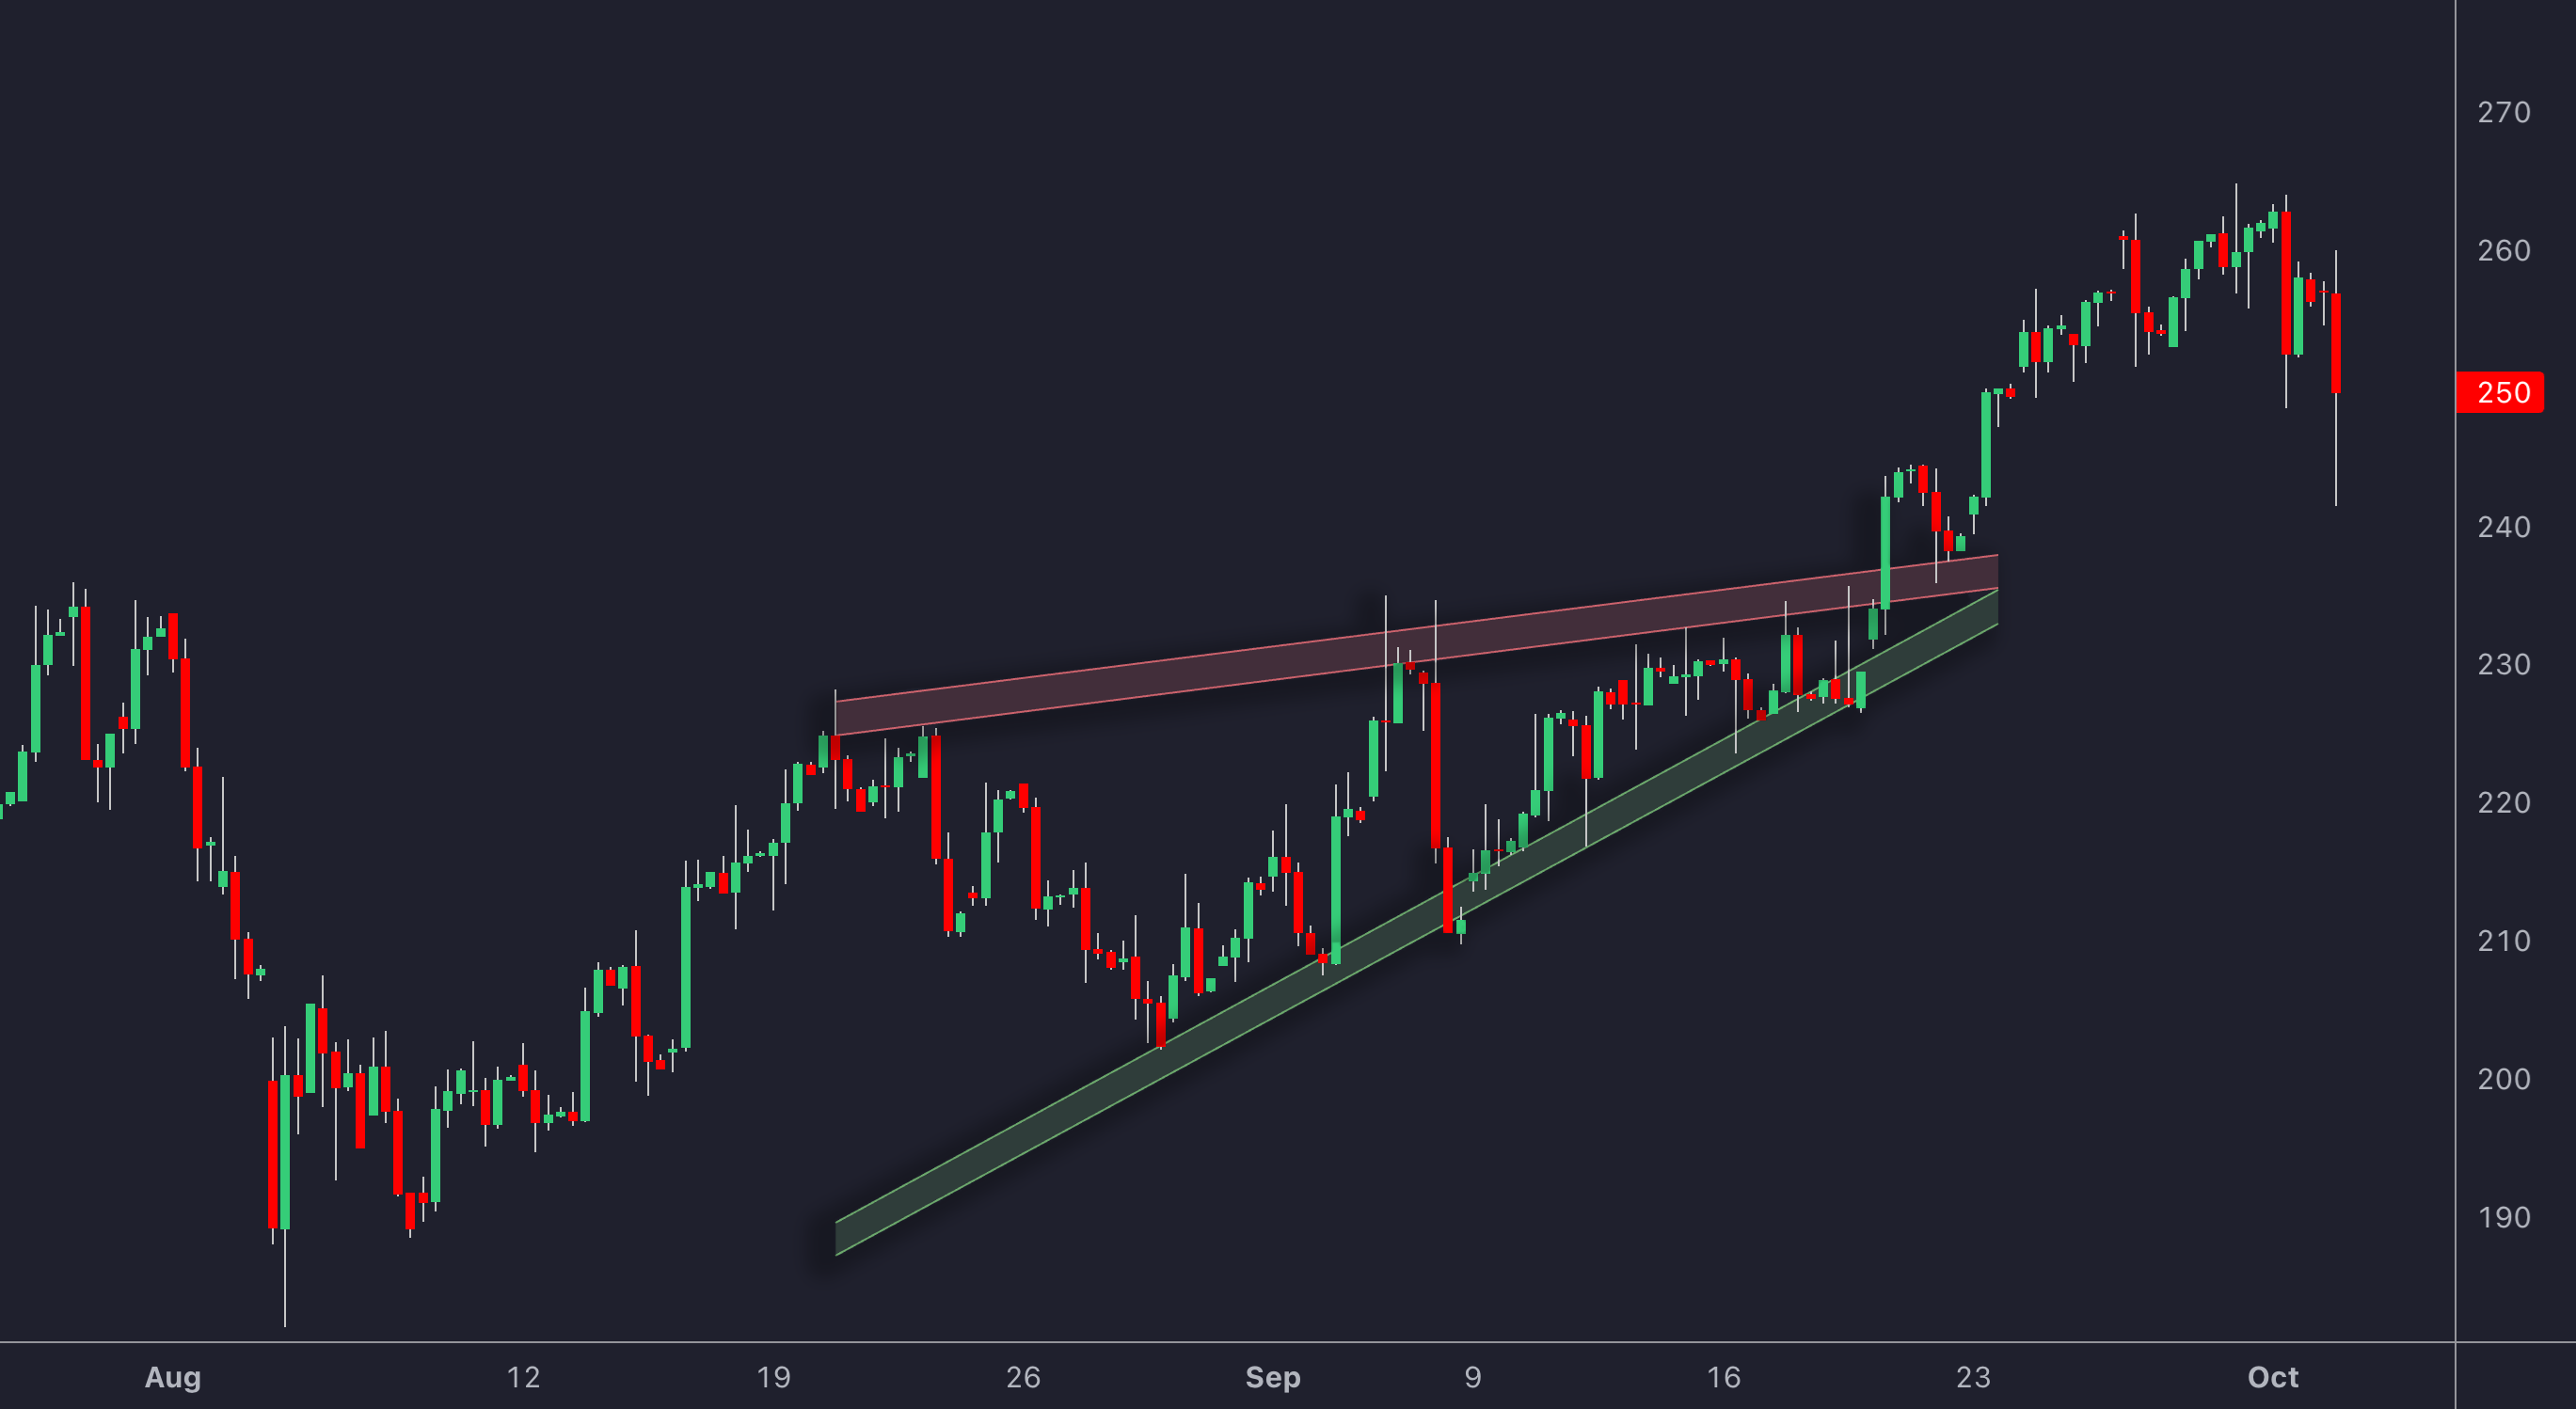
A break near the apex is different from an earlier break, but there is no universal rule here that a two-thirds point makes a trade statistically more reliable. Define the timing measure if you test it. Waiting for a retest may improve an entry price when it occurs, but some breakouts never return and others fail on the retest.
Ascending Triangle Video Guide
This 9-minute, 59-second Tradersfly tutorial from Sasha the Options Coach introduces ascending-triangle structure and trade planning. Use it to study the formation alongside the definitions here; its educational examples are not evidence of a guaranteed continuation.
Make Entry, Target and Exit Rules Explicit
| Pattern | Trigger to define | Simple measured objective | Structural stop candidate |
|---|---|---|---|
| Double bottom | Break above the intervening neckline | Neckline plus neckline-to-low height | Below the selected second low. |
| Cup and handle | Handle boundary, rim or both | Rim plus cup depth under a rim-based convention | Below the handle low. |
| Ascending triangle | Break above approximately flat resistance | Resistance plus the chosen base height | Below a specified higher low. |
These are conventions for a research plan, not mandatory orders. A close above resistance, two consecutive closes, a percentage buffer and an intraday stop-entry order can produce different trades. Do not combine their best historical fills into a single result.
A signal requiring a completed close must use an attainable execution assumption after that information is available. Allow for spread, slippage and gaps. A target is a hypothesis about distance; it can be missed, exceeded, or reached only after the planned stop has already been hit.
Define what makes the setup expire and what happens after an unsuccessful breakout. For example, a strategy may exit after a completed close returns below the boundary, use a separate protective stop, or require both. If price reaches a stop and target within one historical bar, the order of events may be unknown from that bar alone.
Partial exits and trailing the remainder change the payoff. Record the fraction sold, when a stop is updated, and the costs of additional orders. Adding to a winning position is also a new risk decision; a second breakout does not justify pyramiding without a portfolio limit.
Separate Risk Budget from Position Value
A percentage of capital at risk is different from the percentage invested. For shares, planned price risk is quantity multiplied by entry-to-stop distance. Include estimated trading costs, then check notional exposure and portfolio concentration separately. Futures, forex and other instruments require their own point values, contract sizes and currency conversions.
Hypothetical sizing example: with $10,000 capital, a chosen $100 risk budget and $10 reserved for costs, $90 remains for price risk. Entry at 51 and a planned stop at 48 imply $3 per share, allowing 30 shares. The position value is $1,530, or 15.3% of capital, while the planned budget including costs is 1%.
If a gap produces an exit at 46, the price loss is 30 × 5 = $150 before costs. A stop cannot guarantee the chosen budget. With the earlier double-bottom objective of 55, the entry-to-target distance of four versus a stop distance of three gives about 1.33 units of potential reward per unit of initial price risk, before costs. It says nothing about the chance of success.
There is no universal requirement to risk 1–2% on every trade. Select a budget consistent with the instrument, liquidity and combined exposure. Several bullish setups in correlated assets can fail together, even when each individual position appears modest.
Use Momentum and Volume to Answer Specific Questions
RSI above 50 can describe a chosen momentum condition. A bullish divergence compares selected price lows with oscillator observations, and its availability depends on the swing rules. Neither guarantees an upside breakout. MACD crossing its signal line is another price-derived condition, not independent proof that the pattern is reliable.
Volume Profile distributes observed volume across price levels; it does not identify institutional orders or prove that a level will hold. Use the selected data range, session and feed consistently. A higher-volume break may be useful to investigate, but quantify the condition and compare results rather than assuming improved accuracy.
Add one filter at a time to a base rule. Compare net returns, average gains and losses, exposure, trade count and drawdown over identical dates. A filter may increase win rate while reducing total opportunity or worsening the average payoff. Keep a record of all variants tested to reduce selective reporting.
Study and Test Patterns with Native LuxAlgo
Open native LuxAlgo charts to mark the selected swings and boundaries. Use the Indicators picker for the momentum or volume study that answers your question, inspect numerical values in the Data window, and save consistent settings in a template. The LuxAlgo Library provides additional studies; verify their calculation and availability rather than assuming every pattern has the same detector.
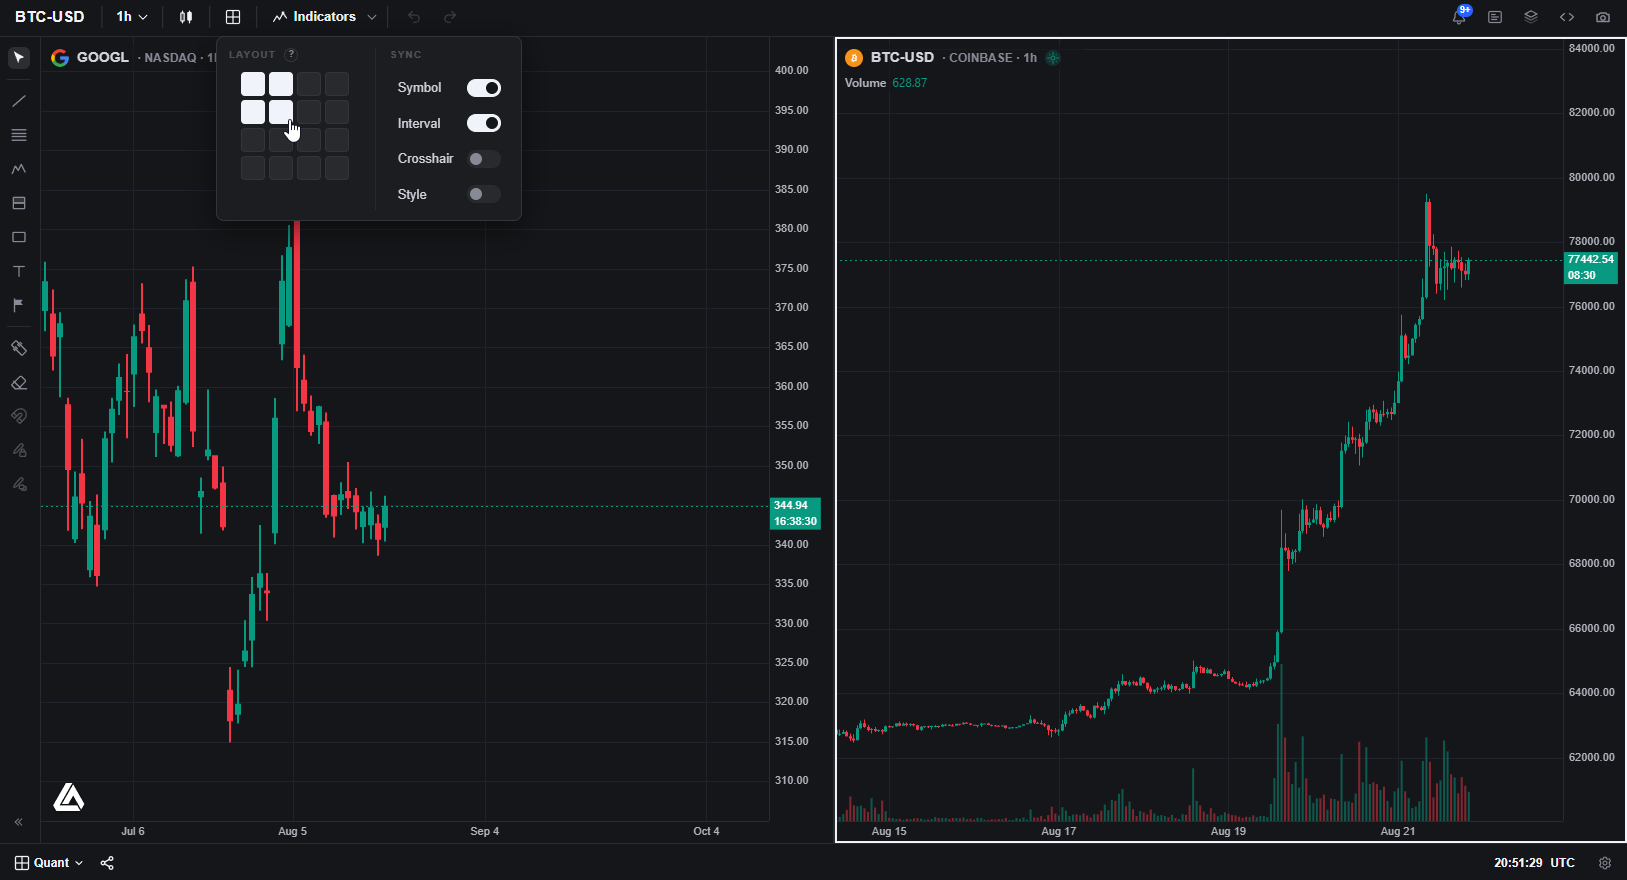
Use Quant, our coding agent to help turn an idea into a complete test. For example: “Define a double bottom using two confirmed lows within an adjustable tolerance and a specified separation. Enter after a completed close above the intervening high, using the next eligible fill. Expose stop, target, expiration, position size and costs, and record when each swing becomes identifiable.” Inspect generated code and run the strategy manually.
Check individual trades, including failures, before relying on an equity curve. Use a later sample that was not used to select the rules. Neither a coding assistant nor a historical parameter search establishes the ideal stop, target or future profit.
Keep TradingView Toolkit Workflows Distinct
For TradingView users, the current Price Action Concepts pattern documentation lists triangles, broadening wedges, double tops and bottoms, and head-and-shoulders variants. It describes chart outlines, a dashboard and built-in pattern alerts. Cup and handle is not in that documented list; do not assume the same tool detects every formation in this guide.
A chart overlay is not automatically a multi-symbol screener. A displayed pattern name is not a calibrated confidence score or historical hit rate. Verify the selected tool and its outputs directly. Related liquidity trendlines and equal highs/lows have retrospective timing described in the documentation; inspect when any chosen signal becomes available before using it in a test.
TradingView toolkits, the legacy Backtesting Assistant and Strategy Alerts are separate workflows from native chart research. Check compatibility with the exact detector instead of assuming a generic pattern feeds every backtester. An alert notifies you of an event; it does not establish that an order executed.
Build a Repeatable Review and Journal
| Stage | Record | Review question |
|---|---|---|
| Candidate | Symbol, timeframe, prior trend and original boundaries | Was this identifiable before the outcome? |
| Trigger | Completed-bar time and execution assumption | What information was available at entry? |
| Risk | Actual entry, quantity, stop, target and estimated costs | Does total exposure fit the chosen budget? |
| Outcome | Fill prices, fees, expired setups and failed breaks | What happened under the original rules? |
| Evaluation | Complete sample and later validation period | Does the result survive beyond selected examples? |
Start with one clearly defined formation and collect both successful and unsuccessful cases. A simulated journal can help expose inconsistent rules before real capital is involved, but simulated fills still need realistic assumptions. Compare the strategy with a relevant baseline rather than assigning a fixed annual-return improvement to chart analysis.
Trading communities can help challenge a classification or spot an overlooked assumption. Share the original chart, timestamp and rule set, and distinguish a worked illustration from a verified trading record. Screenshots of winners and broad claims of expertise do not replace a complete sample.
Frequently Asked Questions
Which pattern is a bullish reversal pattern?
A double bottom is commonly studied as a bullish reversal after a decline. Two lows alone do not complete it; define a break above the intervening neckline and the rules for timing, execution and risk.
Does an ascending triangle always break upward?
No. Its approximately horizontal resistance and rising lower boundary describe geometry. It can break downward or fail after an upward break. Define the trigger and exit rather than assuming continuation.
Is a measured target guaranteed?
No. Pattern height gives a projected distance under a chosen convention. Price can miss the target, reach the stop first or move beyond the objective. Use the actual entry when evaluating potential reward and risk.
Does high volume prove a bullish breakout is reliable?
No. Volume describes activity on the selected feed and can be compared with a defined baseline. It does not identify trader intentions or guarantee follow-through. Test the added condition against the base rule.
Is risking 1% the same as investing 1%?
No. Planned risk depends on quantity, entry-to-stop distance and costs. Position value is quantity times price for shares. Gaps can cause losses beyond the planned budget.
Can LuxAlgo automatically validate every bullish pattern?
No single pattern label validates a trade. Use native LuxAlgo charts and Quant, our coding agent, to develop explicit rules; inspect code and run the strategy manually. TradingView toolkit pattern coverage and alert compatibility must be checked separately.
Read next