Candlestick Continuation Patterns: Key Risk Management Tips

Continuation patterns suggest that an existing trend may resume after a pause. They do not remove the risk of a failed breakout. A useful trading plan defines the pattern, entry, invalidation level, position size, and exit before committing capital.
Use LuxAlgo’s native charts to examine the setup and Quant to turn explicit rules into a strategy you can inspect and test. The goal is to evaluate a repeatable approach after costs, rather than assume that a recognizable pattern has a universal win rate.
Understanding Continuation Patterns
Candlestick patterns and broader chart patterns describe different structures. Rising Three Methods is a candlestick formation. Flags and pennants are chart patterns that can span many bars and can be displayed on a candlestick chart. Their recognition rules and target methods should not be treated as interchangeable.
| Pattern | Structure to define | Risk to examine |
|---|---|---|
| Bull or bear flag | A sharp directional move followed by a relatively compact, usually countertrend channel with roughly parallel boundaries. | A break against the expected direction, or an apparent breakout that returns inside the consolidation. |
| Pennant | A sharp move followed by a small consolidation with converging boundaries. | Ambiguous boundaries, premature entries, and failure to continue after the break. |
| Rising Three Methods | A five-candle formation within an uptrend, with a brief countertrend pause between strong bullish candles. | A completed formation that fails to sustain the advance. |
In Thomas Bulkowski’s identification guidelines, Rising Three Methods begins with a tall bullish candle. Three smaller candles then trend lower, closing within the first candle’s high-low range; the second and fourth candles are bearish, while the middle candle can be either color. A final tall bullish candle closes above the first candle’s close. If you test a stricter variation, such as requiring every intervening wick to remain inside the first candle, record that difference.
StockCharts’ flag and pennant guide emphasizes the preceding sharp move and the subsequent consolidation. A sideways range without that context should not automatically receive the same label.
Evaluating a Potential Breakout
Define what qualifies as a breakout. An intrabar move through a boundary and a completed candle closing beyond it are different entry rules. Waiting for a close may avoid some temporary moves, but it can also produce a later entry and a larger distance to the stop.
- Trend context: specify how the preceding trend is measured, including the lookback and timeframe.
- Pattern boundaries: define which highs and lows establish the consolidation and when those levels become available.
- Volume: test a clearly specified comparison, such as volume relative to a fixed average. Consider whether the feed supplies exchange volume, tick activity, or another measure.
- Momentum: an RSI or MACD condition is an additional hypothesis to test, not proof that the breakout will hold.
Adding filters does not automatically improve performance. Compare the base rule with each change, including its effect on trade count, costs, drawdown, and results on unseen data. Volume profile describes activity by price; it does not establish that a breakout is genuine or reveal who placed the trades.
Position Sizing: Separate Risk From Allocation
First choose a planned monetary loss allowance appropriate to the account and strategy. A percentage such as 1% is an example of a risk budget, not a universal recommendation. Avoid increasing risk simply because a pattern looks especially convincing.
Quantity = planned monetary allowance ÷ estimated loss per unit. For a simple stock position, the denominator starts with the distance between entry and stop, then includes an allowance for trading costs. Round down to the permitted trading increment and check available capital. Contracts also require the correct point, tick, or pip value and any currency conversion. The CME position-sizing lesson explains the connection between stop placement and quantity.
For example, a hypothetical $10,000 account with a $100 planned allowance enters a stock at $50 with a stop at $48. Before costs, 50 shares put $100 between entry and stop, while allocating $2,500 to the position. If estimated round-trip costs and execution allowance total $0.20 per share, 45 shares use $99 of the allowance: 45 × $2.20. Actual losses can still exceed that estimate.
Position sizing changes the financial impact of a failed breakout. It does not reduce how often false breakouts occur. Also consider open positions: several trades exposed to the same market move can create a larger combined loss than their individual setups suggest.
Stop Placement and Exit Planning
Place the initial stop using a defined invalidation rule. For a long flag trade, that might refer to the consolidation low, possibly with a specified volatility allowance. For a short trade, the relevant level may be above the consolidation high. Rising Three Methods needs its own rule; the first candle’s low is one testable reference, not a mandatory stop for every setup.
A wider stop generally requires a smaller position to keep the same planned allowance. Do not tighten a stop solely to make a reward-to-risk number look attractive. The SEC’s stop-order bulletin explains why a stop price does not guarantee the execution price. Gaps and fast markets can increase losses, while stop-limit orders introduce the possibility of no execution.
Use Measured Moves as Target Hypotheses
For flags and pennants, a conventional measured move projects the preceding flagpole’s length from the breakout. It does not simply use the consolidation’s height. Suppose a stock rises from $40 to $50, consolidates, and breaks upward at $48. Projecting the $10 flagpole gives a hypothetical $58 objective. With an entry at $48 and stop at $46, the planned reward is $10 against $2 of risk: a 1:5 risk-to-reward ratio before costs.
The market is not obliged to reach that objective. Nearby resistance, entry timing, execution, and the chosen exit rule affect the outcome. Rising Three Methods does not automatically inherit the same flagpole calculation. A favorable planned ratio also says nothing by itself about the strategy’s win rate or expectancy.
Define Trailing Stops and Partial Exits Before Testing
A trailing stop needs explicit activation, distance, update timing, and direction rules. Moving it after a gain of 1.5R is one possible parameter, not an established best setting. Here, R means the original planned monetary risk.
Partial exits change the payoff. If half a position exits at +1R and the rest at +3R, the combined gross result is +2R on the original position. If the remaining half instead exits at the original stop, the combined gross result is zero, before costs. Taking partial profits therefore does not guarantee a higher return or a profitable trade.
Test Continuation Rules With LuxAlgo Quant
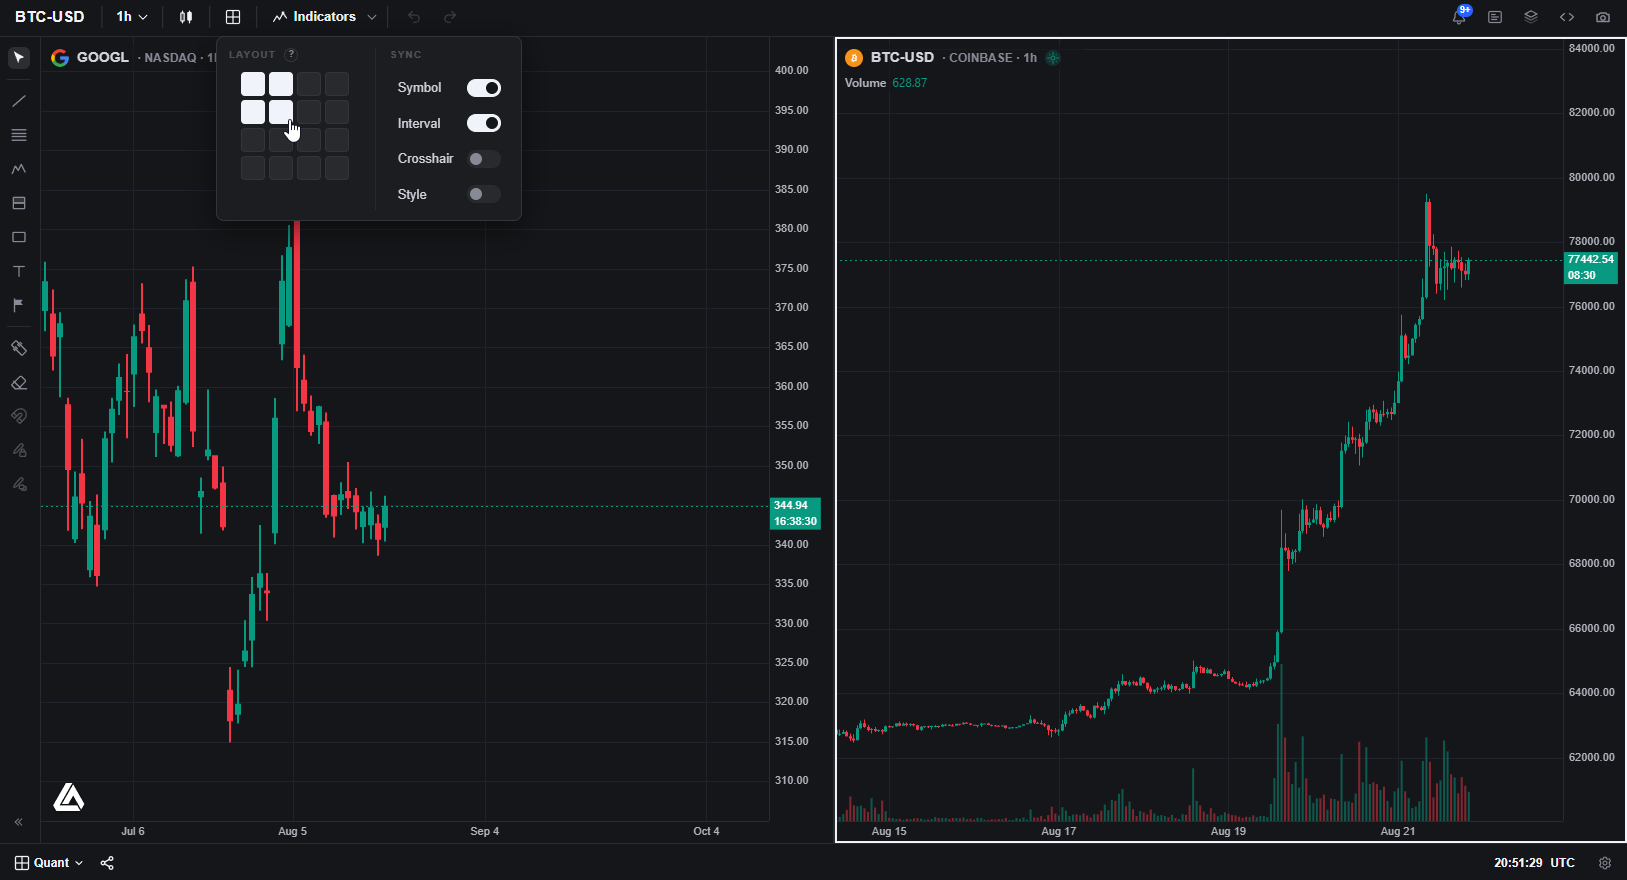
Start with one pattern and a manageable set of conditions. In Quant, describe the trend filter, formation rules, entry timing, stop, target, and sizing method precisely. Use the Code, Review, and Run workflow to inspect the implementation and test it. Resolving a coding error does not establish that the strategy matches your intended logic.
- Define the pattern objectively. Specify lookbacks, tolerances, and when a formation becomes confirmed. Avoid rules that rely on future candles.
- Set the simulation assumptions. Review inputs and properties, including capital, order size, commissions, and slippage. A percentage order size represents allocation, not automatically stop-based account risk.
- Inspect individual trades. Compare entries and exits with the chart and trade log. Check whether the strategy acts at the intended time and handles failed breakouts as designed.
- Evaluate unseen data. Reserve a period that was not used to select the rules. Check sensitivity to nearby settings and different conditions instead of choosing only the strongest historical result.
Chart-library tools can support analysis, but a pattern display should not be described as an automatic multi-market scanner or a broker order. Strategy research and live execution are separate workflows. Use the LuxAlgo Journal to review supported trading records and notes against your plan.
Video: Chart Pattern Reliability
Financial Wisdom’s video discusses historical chart-pattern reliability. Treat the study’s definitions and sample as context, rather than applying its percentages to every market, entry rule, or trading cost model.
FAQs
What is a continuation strategy?
A continuation strategy seeks to enter when an established trend resumes after a pause. It can use a candlestick formation or a broader chart pattern, provided the setup and execution rules are clearly defined. The pattern alone does not supply a universal success rate. Evaluate the full strategy—including failed signals, position sizing, exits, and costs—and keep the planned loss manageable if the expected continuation does not occur.
Read next