Concept
Bull/bear Flag
Bull/bear Flag is a Chart & Candlestick Patterns concept. The Library holds 1 implementation, a working definition you can pull into Quant.
Top Bull/bear Flag indicator
The top custom implementation, built on the original standard Bull/bear Flag formula.
1 total
From studying Bull/bear Flag to trading it: take the implementation below into Quant and backtest it instantly.
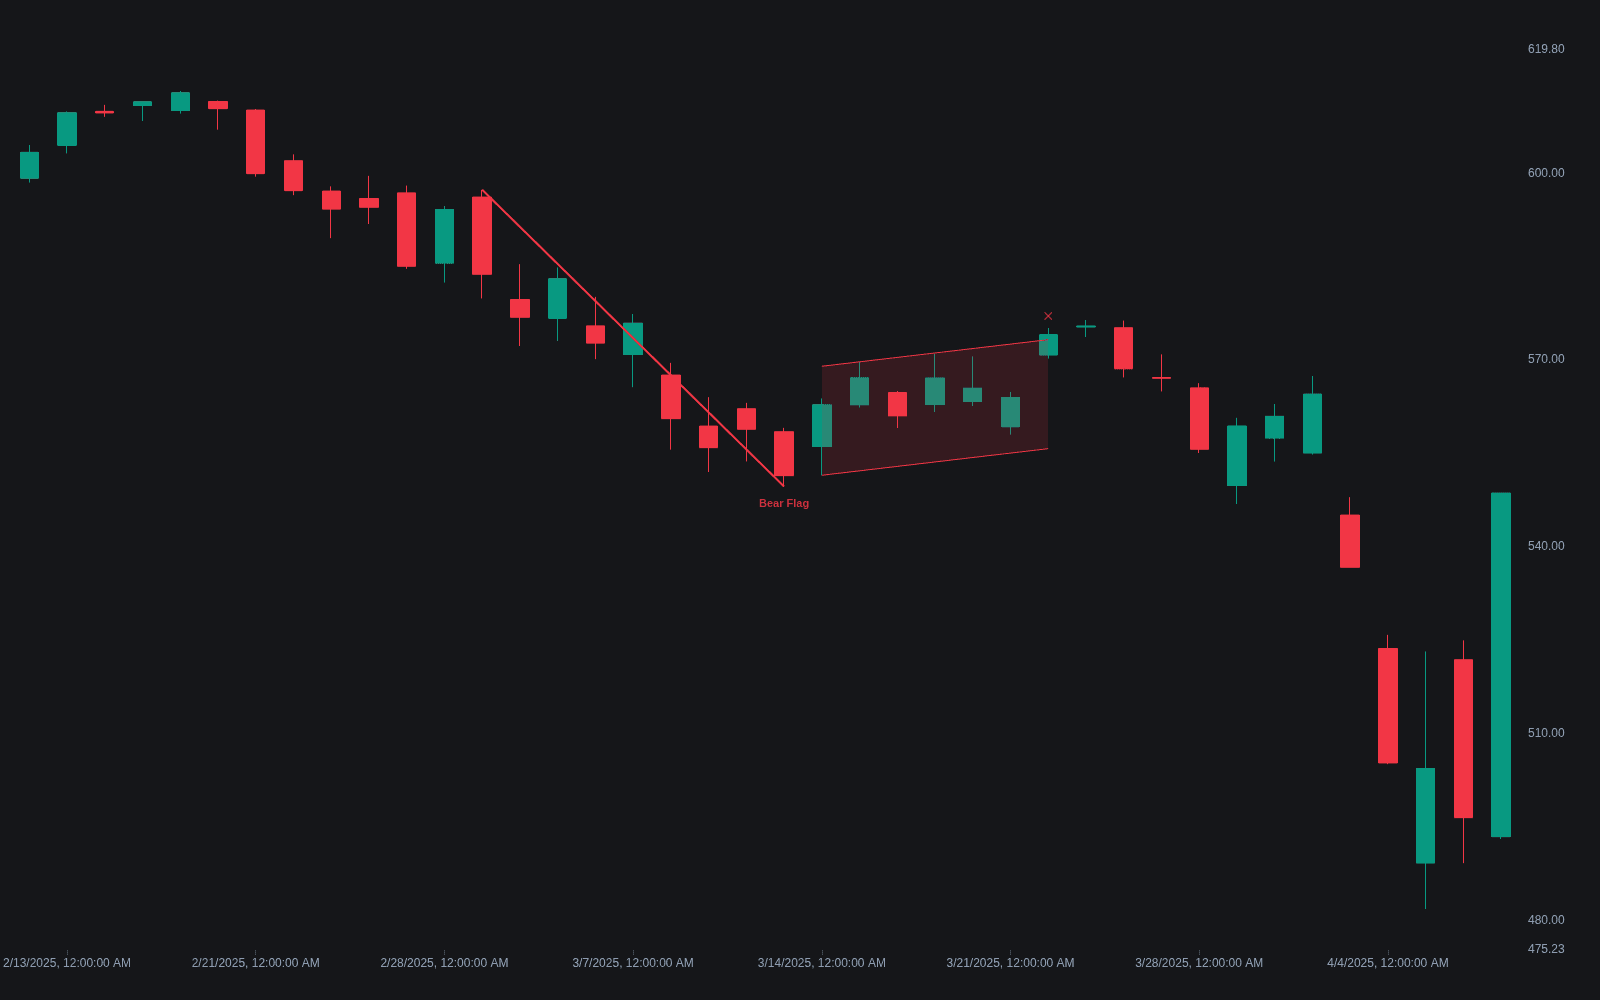
What is a Bull or Bear Flag?
A flag is a brief continuation pattern: a sharp, near-vertical impulse leg (the pole), then a shallow countertrend drift inside a narrow parallel channel (the flag), then a break back in the pole's direction. A bull flag has an up pole with a downward or sideways flag; a bear flag mirrors it. The drift is the mechanism: profit-taking gets absorbed without price giving back much ground, which implies the other side never regained initiative.
The classic volume signature is expansion on the pole, contraction through the flag, and expansion again on the break, and the measure rule projects the pole's height from the breakout point for a first objective. The premise is trend continuation, so flags drawn against a higher-timeframe trend, or after a move has already run far, fail routinely; the shape alone is not the edge.
Flags are among the oldest named patterns in American charting. Richard Schabacker described flags and pennants in the early 1930s, and Edwards and Magee carried them into Technical Analysis of Stock Trends with the observation that a flag tends to fly at half-mast, appearing partway through a move and resolving quickly on contracting volume. William O'Neil later popularized the high, tight flag, a variant following an exceptionally steep advance, and Thomas Bulkowski's pattern research catalogues flags and pennants as their own short-consolidation family.
The bar-level texture backs the story. Poles print consecutive wide-range bars closing near their extremes; healthy flags print small, overlapping bars, often inside bars and doji-like candles, evidence that countertrend pressure is passive profit-taking rather than aggressive positioning. The pattern matters because it gives trend traders what a vertical move otherwise denies them: a nearby, defined risk point, with the stop beyond the flag rather than beyond the whole trend.
How to identify a bull or bear flag on a chart
The pole qualifies the pattern; the flag merely needs to avoid disqualifying it.
- 1Find the pole first: a near-vertical sequence of strong closes that stands out from the surrounding action; without an impulsive pole there is no flag.
- 2Look for the pause: a handful of overlapping bars contained by two roughly parallel lines, tilting against the pole or sideways.
- 3Check the depth: the drift should hold well under half of the pole, ideally staying in the pole's upper third for bull flags (lower third for bear flags).
- 4Check the tilt: a steep drift continuing in the pole's direction is not a flag; after an up pole that shape reads closer to a rising wedge.
- 5Watch volume if available: contraction through the flag and expansion at the break is the classical signature.
- 6Define the trigger: a decisive close through the flag boundary in the pole's direction, sometimes reinforced by a bullish or bearish engulfing bar, with the far flag edge as the stop reference.
How traders use it
- As a continuation entry: buy (or sell) the break of the flag channel in the pole's direction, stop beyond the flag's far edge, first target from the measured move.
- As a trend-strength read: shallow, low-volume flags holding the upper part of the pole suggest one-sided conditions, while deep, sloppy flags retracing half the pole or more read as ordinary pullbacks with weaker continuation logic.
- As a timing tool inside a mapped trend: many traders only take flags forming above support or a rising average, treating the flag as the entry mechanic rather than the reason for the trade.
- As a scan target: poles and contracting drifts are mechanical enough to screen for; the human work is rejecting candidates that fight the higher-timeframe context.
- As an add-on point: trend traders pyramid existing positions on flag breaks rather than initiating fresh risk late, because the flag supplies a defined stop that keeps the added size accountable.
Flags vs neighboring pause patterns
Ascending/descending/symmetrical Triangle: A pennant, the flag's sibling, is a small converging triangle after a pole; a full triangle is a larger standalone structure that needs no pole. Post-pole pauses trade off the pole's measurement, while larger triangles carry their own height-based objectives.
Inside Bar: An inside bar is a one-bar pause; a flag is the multi-bar version of the same absorption logic. Both trade the same way, a break of the pause in the trend's direction, and a daily inside bar often contains an intraday flag.
Rising/falling Wedge: A flag's boundaries are parallel; a wedge's boundaries converge while sloping the same way. The distinction matters after strong rallies: a downward-sloping flag is the continuation-friendly shape, while a steep rising wedge into highs is conventionally read toward exhaustion instead.
Concept family
Chart & Candlestick Patterns
84 concepts mapped · 84 in the Library
Bull/bear Flag FAQ
Turn Bull/bear Flag into a trading strategy.
Take the implementation from this page into Quant, then build on it, backtest it on real data, and keep refining it in conversation.