Chart Patterns with Highest Failure Rates
There is no universal ranking of chart patterns with the highest failure rates. The answer depends on what counts as failure, the breakout direction, market regime, sample and evaluation period. A pattern that misses a large price target can still produce a profitable trade, while a successful-looking breakout can lose money after entry timing and costs.
One historical bull-market ranking places island bottoms at the weakest end for upward breakouts and rising wedges at the weakest end for downward breakouts under a specific 5% movement test. That does not establish today’s failure probabilities. Below, we separate the evidence from common claims and examine inside days, pennants, rectangle bottoms, flags, and head-and-shoulders patterns.
Define Failure Before Comparing Patterns
| Measure | What it counts | What it does not establish |
|---|---|---|
| Breakout failure | Price returns inside a boundary or crosses a defined invalidation level | A universal target-miss rate unless those rules are identical. |
| Minimum-movement failure | Price fails to travel a stated percentage before a specified reversal | The profit or loss of a strategy with different entries and exits. |
| Measured-target miss | A geometry-based objective is not reached within the evaluation rules | That every trade from the pattern lost money. |
| Losing trade | Net proceeds after actual or simulated fills, exits and costs are negative | That the chart never moved in the anticipated direction. |
| Pullback or throwback | Price revisits a broken level under a stated definition | Failure by itself; price may later resume the breakout direction. |
A defensible rate needs a numerator and denominator: failures divided by eligible completed observations. Record how patterns are identified, when they become tradable, the reference price, time limit, target and invalidation rule. Include ambiguous and incomplete cases according to a written policy rather than quietly dropping inconvenient examples.
Worked Example: One Setup, Three Different Outcomes
Suppose resistance is 100, the first qualifying close above it is 101, and an illustrative next entry fills at 102. Price reaches 108, then declines. It has missed a 110 target, but a trader who exited at 106 made four price units before costs. A trader who held to an exit at 99 lost three units. The same chart can be a target miss and either a winning or losing trade.
A touch back at 100 is a retest if that is how you define one. It is only a failed breakout under a rule that treats that event as failure. If both target and stop fall within the same historical bar, daily OHLC alone may not reveal which came first; use finer data or a conservative, disclosed execution assumption.
What the Historical Failure Rankings Actually Show
Thomas Bulkowski’s chart-pattern failure ranking, updated August 24, 2020, defines failure as not moving more than 5% from the breakout price before the trend reverses. The tables cover bull markets and separate breakout directions. Rank 1 has the fewest failures; larger ranks indicate worse placement within that table.
| Historical bull-market category | Weakest end of the published failure ranking | Interpretation |
|---|---|---|
| Upward breakouts | Island bottom: 39; falling wedge and roof: tied at 37 | These are ranks within the upward-breakout table, not failure percentages. |
| Downward breakouts | Rising wedge: 36; ascending triangle: 35; symmetrical triangle: 34 | These are ranks within the downward-breakout table, not current trading odds. |
The page supplies ordinal ranks rather than sample counts or failure percentages. Its underlying definitions and period must be retained when citing it. It is not a basis for calling every inside day, flag or head-and-shoulders setup one of the worst patterns across all markets and timeframes.
Why “Failure Rates Have Doubled” Needs a Date and a Definition
Bulkowski’s separate failure-rate study used 13,932 observations across 23 pattern types from 1991–2008. For a 10% movement threshold, it reported average upward-breakout failures of 14% in the bullish 1990s versus 28% in 2003–2007; downward-breakout figures were 26% versus 49%. The reference was the close before breakout, measured to the subsequent ultimate high or low.
Those are historical aggregate comparisons, not current rates for individual patterns. The study’s listed types do not include inside days, flags or pennants. Assigning its 28% figure to an inside day or rectangle bottom individually would misrepresent the evidence. Nor does that sample prove patterns are failing more often today or that algorithmic trading caused the change.
1. Inside Day: Containment Is Not Direction
An inside day has a high below the previous day’s high and a low above the previous day’s low under a strict definition. Some implementations allow tied prices, so state the convention. The relationship concerns the full high-low range, not just candle bodies. It identifies contraction relative to the preceding day, not a guaranteed bullish or bearish outcome.
Define whether a breakout must exceed the inside day’s boundary or the larger “mother bar” boundary. A move beyond the smaller range can remain inside the larger one. Also decide whether an intraday touch or a completed close is required, and how to handle a bar that crosses both sides.
Example: yesterday’s range is 95–105 and today’s is 98–103. A later price of 104 breaks the inside day’s high but remains below the mother bar’s high of 105. Those two strategies would identify different events. Do not attach a borrowed failure percentage to both.
Review spread, news timing and the surrounding trend as potential explanatory variables. A low-volume day or a volatile session is not automatically a failed setup. Test those filters instead of presenting them as established causes, and avoid assuming that an arbitrarily tight stop improves the result.
2. Pennants: Separate the Pole, Consolidation and Target
A pennant is a compact consolidation with converging boundaries after a sharp directional move. The preceding move, or pole, distinguishes it from a triangle drawn anywhere on a chart. Identification rules should specify the pole, maximum consolidation length and permitted shape before you inspect what happened next.
A projected pole-length move is a target convention, not an expected return guarantee. For a hypothetical upward pole from 80 to 100 and a breakout reference of 99, a full-height projection gives 119. A move to 108 can therefore miss that target while still offering a positive price excursion. A smaller fixed-percentage threshold measures something different.
Avoid combining a minimum-movement failure rate with a measured-target hit rate as though they sum to 100%. Keep upward and downward breakouts separate, and define what happens when the consolidation expands, breaks the wrong boundary or lasts too long. Volume contraction followed by expansion can be a hypothesis to test, not proof that the next move will continue.
3. Rectangle Bottom: A Range Can Continue or Reverse
A rectangle bottom describes a sideways range after declining prices, with repeated tests of broadly horizontal support and resistance. The prior decline explains the “bottom” context, but it does not guarantee an upward exit. Price can continue lower or remain in the range.
Fix the tolerance for repeated tests and the required number of touches. If a pivot requires later bars to become identifiable, the pattern cannot be acted on at that pivot’s earlier timestamp. Record the breakout rule and whether an entry waits for a retest; waiting changes both the entry price and the population of trades.
For a range from 50 to 55, an upward breakout from the 55 boundary yields a conventional height projection of 60. A purchase at 56 has four units to that objective, not five. The distance from the actual entry to the stop determines planned risk; the pattern’s height alone does not.
The aggregate 14%–28% historical comparison above is not a rectangle-bottom-specific estimate. Compare this pattern’s own observations under the same direction, regime and failure definition before reporting a rate. A strong broad market can help or hurt a particular rule depending on how and when it trades; it is not a universal false-breakout explanation.
4. Bull and Bear Flags: Continuation Must Be Tested
Flags pair a sharp move with a relatively short, roughly parallel consolidation that often slopes against the pole. Bull flags follow an advance; bear flags follow a decline. A long, irregular range without a clear pole should not be retrospectively relabeled a flag because a later move looks attractive.
Define the pole and consolidation limits, the breakout boundary and whether a completed close is needed. Compare outcomes for upward and downward setups independently. A measured pole projection is different from a universal 10% or 20% profit target, and “strong trend” needs a numerical rule before it can support a performance comparison.
A useful study might compare the same flag definition with and without a prior-trend filter or a volume condition. Report the reduced sample size as well as the result. Do not assume a filter lowers failure rates merely because the remaining historical charts look cleaner; it can remove winning trades and delay entries too.
5. Head and Shoulders: Completion, Retest and Failure Differ
A head-and-shoulders top has three peaks, with the middle peak higher than the shoulders and a neckline connecting the intervening troughs. The inverse pattern uses three troughs and a neckline through the intervening peaks. A top is normally studied after an advance and the inverse form after a decline.
A prospective right shoulder is not a completed neckline breakout. Define when the neckline is known, how its slope is calculated, whether a close beyond it is required and where the pattern is invalidated. A price-chart drawing may extend back to older turning points even though the full formation was only recognized later.
For a simplified horizontal-neckline example, a head at 120 and neckline at 110 give a height of 10 and a conventional downside objective of 100. A short filled at 108 has eight price units to that objective. A later revisit to 110 is a pullback; whether it stops the trade depends on the written exit rule. It is not automatically a target miss or a permanent reversal of the breakout.
Pullback frequency and target-hit frequency are separate statistics and can overlap. They cannot be substituted for a loss rate. Historical evidence about head-and-shoulders formations should specify top versus inverse, breakout direction, reference price and evaluation rules before a percentage is applied to a new setup.
Use LuxAlgo to Make the Research Rules Explicit
Start in native LuxAlgo charts with ordinary candles and the same symbol, session and timeframe used in your study. The indicator picker includes standard tools and the LuxAlgo Library for investigating price structure, momentum and volume. A pattern label organizes observations; it does not certify a profitable trade.
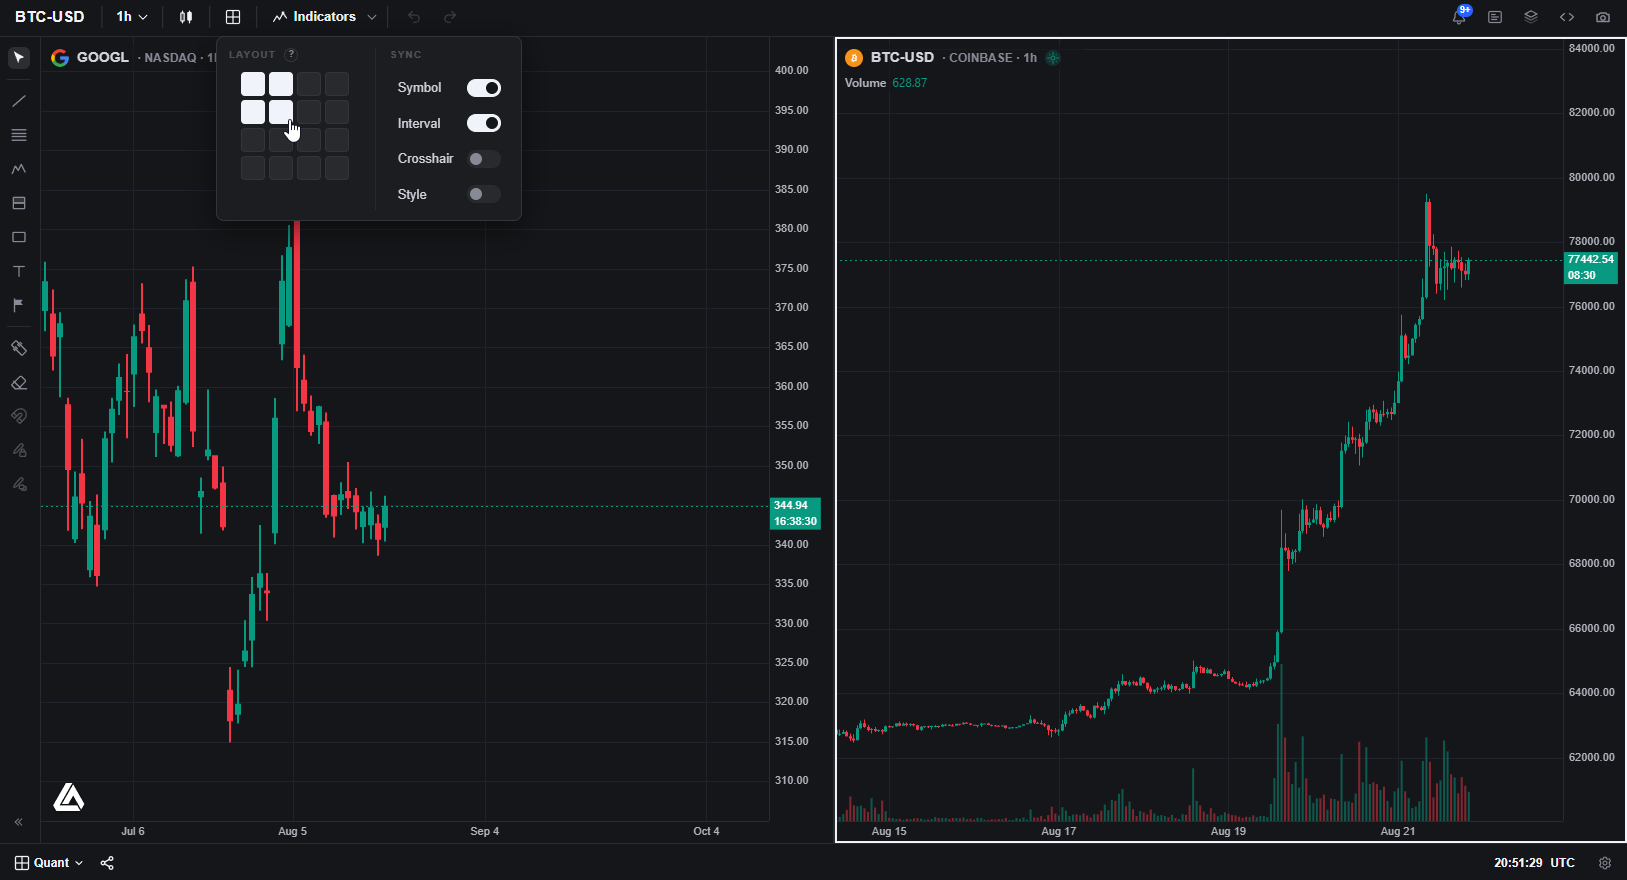
Use Quant, our coding agent to express a precise pattern hypothesis or a strategy. Specify pivot timing, pattern geometry, completed-bar conditions, actual-price entries, stops, targets, costs and the maximum holding period. Inspect the generated code and run the strategy manually using the Quant strategy workflow. Check individual trades and detection timestamps before interpreting the report.
A useful request is: “Evaluate this rectangle rule using only information available at each completed bar. Record the time the range becomes identifiable, require a close above its upper boundary, and allow entry at the next eligible price. Compare a range-height target with a fixed holding-period exit, include costs and show all qualifying trades.” Define the required number of touches, tolerances and risk inputs before running it.
Where the TradingView Price Action Concepts Toolkit Fits
The Price Action Concepts® pattern documentation describes automatic recognition of specified triangles, broadening wedges, double tops/bottoms and head-and-shoulders forms, plus support and resistance when no listed pattern is detected. It does not list every formation discussed in this article. Use the documented feature set rather than assuming that inside days, flags and pennants are all covered.
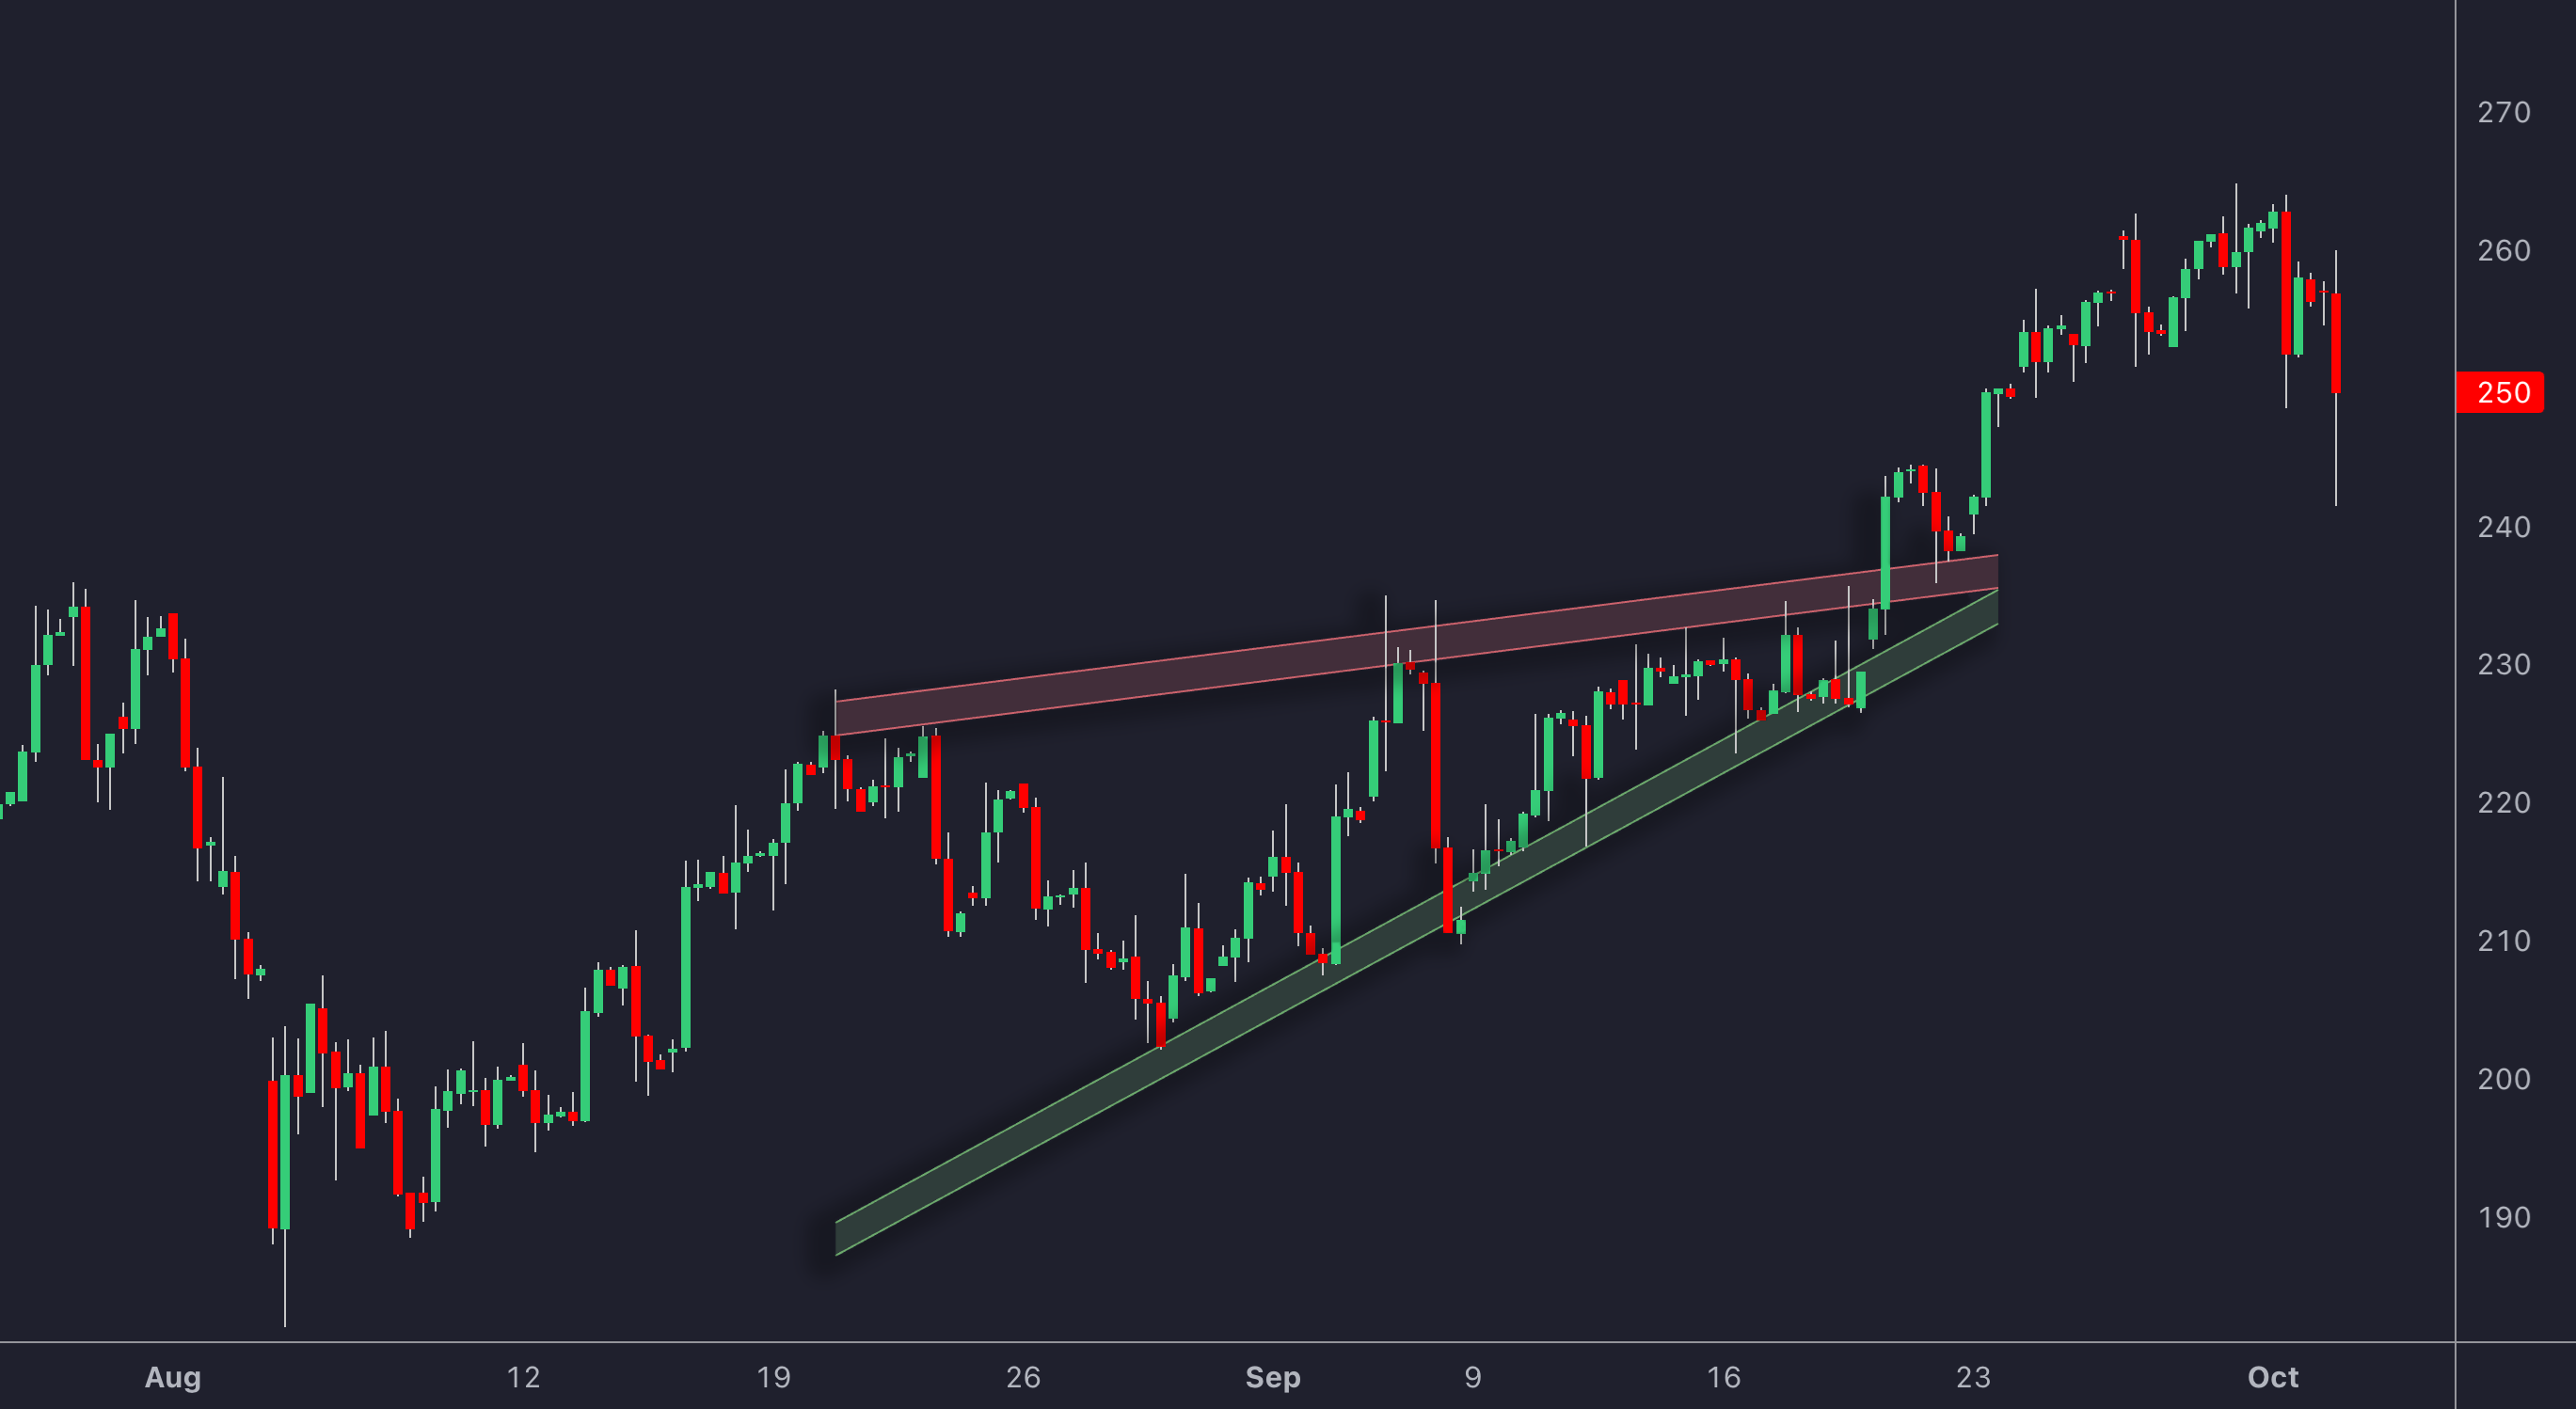
The same documentation states that liquidity trendlines and confirmed equal-high/low structures are displayed retrospectively. Do not infer that every point in a historical drawing was available when that bar traded. Verify the specific detector’s timing. Native charts, TradingView toolkits, the legacy Backtesting Assistant and Strategy Alerts have separate workflows; an alert is a notification, not an executed trade or proof of predictive accuracy.
Build a Failure-Rate Study You Can Interpret
| Step | Decision to record | Verification |
|---|---|---|
| Define the sample | Universe, historical period, feed and pattern rules | Include all eligible observations and disclose missing or delisted symbols. |
| Choose the outcome | Breakout failure, minimum move, target miss or net losing trade | Use the same outcome definition across comparisons. |
| Control timing | Detection time, order time and maximum holding period | No use of future pivots, later chart drawings or unavailable closing prices. |
| Model execution | Actual entry, stop, target, costs and gap behavior | Inspect individual fills and ambiguous intrabar sequences. |
| Evaluate later data | Development sample, untouched sample and tested variants | Report trade count, uncertainty, drawdown and net results alongside percentages. |
If 12 of 40 eligible setups fail your chosen rule, the observed rate is 30%. That small sample does not make the next trade’s failure probability exactly 30%. Avoid decimal-heavy precision without adequate data, and do not repeatedly alter the rule until the historical rate looks favorable.
For a separate risk example, an actual long entry at 56 with a planned stop at 53 risks three units per share before costs. With a $100 budget and $10 reserved for estimated costs, the illustrative size is 30 shares. A stop fill at 53 loses $90 before costs; a gap exit at 51 loses $150 before costs. A stop instruction cannot guarantee the budget is respected.
Compare the pattern rule with a simpler baseline and test each added volume or trend condition separately. Judge whether it improves later results after costs, not whether it produces a more impressive historical chart. A pattern with fewer target misses can still have worse net performance if entries are late, losses are large or trading costs are high.
Frequently Asked Questions
Which chart pattern has the highest failure rate?
There is no universal answer. In Bulkowski’s historical bull-market ranking updated in 2020, island bottoms have the weakest upward-breakout failure rank and rising wedges the weakest downward-breakout rank under its 5% movement test. These ranks are not current failure percentages or guarantees for another market.
Are chart patterns failing more often today?
A historical study covering 1991–2008 found higher aggregate threshold-failure rates in certain later periods. That does not establish a current trend or an individual pattern’s present failure rate. A new comparison needs consistent definitions and current representative data.
Does a missed target mean a losing trade?
No. A pattern can miss a large projected target while a trader exits profitably at a smaller move. Conversely, a favorable price excursion does not guarantee a profit after entry timing, exits and costs.
Is a pullback the same as a failed breakout?
No. A revisit to a broken boundary can be followed by continuation. It counts as failure only under an explicitly defined rule that treats that event as failure; a strategy’s stop and target outcomes are separate.
Do volume and trend indicators prevent pattern failures?
No. They can be used as testable filters, but may overlap, delay entry or remove winning setups. Compare the same rule with and without each filter, including costs and a later untouched evaluation period.
Can LuxAlgo help test chart-pattern rules?
Yes. Native charts and the LuxAlgo Library support chart research, and Quant, our coding agent, can help express custom rules. Inspect generated code, run the strategy manually and verify detection times and actual-price fills. Toolkit labels and alerts do not establish a universal success rate.
Read next