Concept
Rising/falling Wedge
Rising/falling Wedge is a Chart & Candlestick Patterns concept. The Library holds 1 implementation, a working definition you can pull into Quant.
Top Rising/falling Wedge indicator
The top custom implementation, built on the original standard Rising/falling Wedge formula.
1 total
From studying Rising/falling Wedge to trading it: take the implementation below into Quant and backtest it instantly.
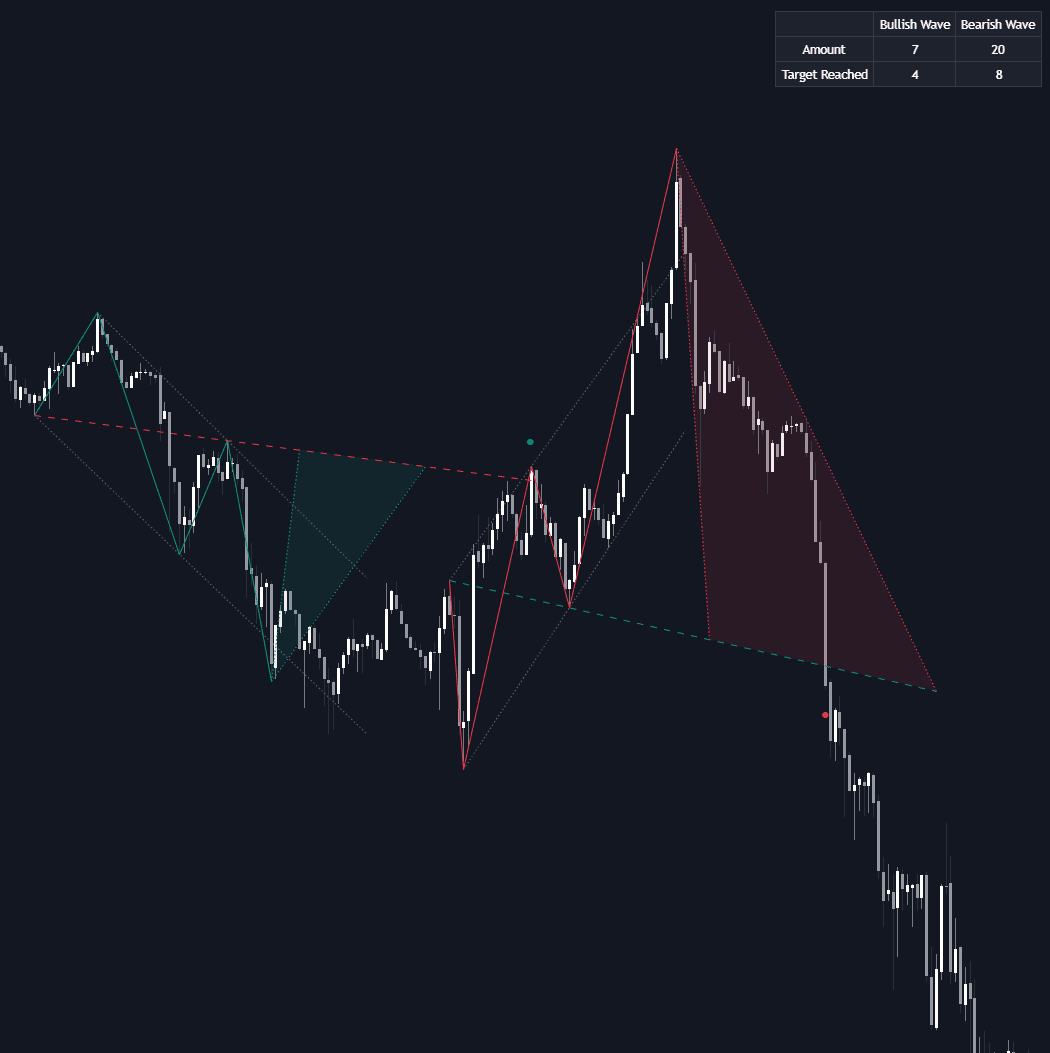
What is a Rising/falling Wedge?
A wedge is a consolidation bounded by two converging trendlines that slope in the same direction. In a rising wedge both lines point up with the lower line steeper, so each new high gains less ground than the lows beneath it; in a falling wedge both point down with the upper line steeper. The slope is the tell: the side pressing the pattern keeps paying more for less progress, which is why the conventional resolution is against the slope (rising wedges break down, falling wedges break up).
Wedges play both roles. Formed against the prevailing trend they act as continuation patterns (a falling wedge in an uptrend is essentially a sloped bull flag with converging edges), while a rising wedge grinding higher at the end of a mature advance is a classic reversal shape. Volume typically contracts as the lines converge. The against-the-slope break is a tendency, not a rule; wedges also break with the slope, so the break itself carries the information.
Targets come in two conventions. The conservative one projects the wedge's height, measured at its widest, from the break point; the ambitious one, used mostly for falling wedges, targets a return to the pattern's origin, where the converging structure began, on the logic that the entire grind is retraced once the compression releases. Published pattern statistics treat wedges kindly but conditionally: falling wedges rank among the better-performing bullish structures when the break arrives on expanding volume, while the rising wedge's bearish lean is real yet fails often enough that trading it before the line actually breaks is a donation.
The geometry has famous relatives. Elliott analysts know the terminal form as the ending diagonal, a fifth-wave wedge whose exhaustion message matches the classical rising-wedge read. Wolfe Waves impose a stricter five-point discipline on the same converging shape and project a target line from its first and fourth points, an approach automated by LuxAlgo's Wolfe Wave Detector; algorithmic detectors more generally, from Wedge Polaris to ProjectSyndicate's geometric engine, define the pattern from confirmed pivots, which turns a famously subjective shape into something testable, and edge fake-outs at the lines are the wedge-scale version of the trap logic bar traders know from the hikkake.
How to identify a rising or falling wedge
The pattern is two lines and a context. Drawing the lines from confirmed pivots keeps the shape honest.
- 1Connect at least two swing highs and two swing lows into boundary lines that converge while sloping the same direction; mixed or parallel slopes are some other pattern.
- 2Classify it: both lines rising with the lower steeper is a rising wedge, both falling with the upper steeper is a falling wedge.
- 3Read the context: against the prior trend the wedge leans continuation; a rising wedge at the top of a mature advance leans reversal, and the falling mirror applies at lows.
- 4Check participation: range and volume contracting toward the apex fit the pattern's compression story, and an expanding-volume break validates it.
- 5Define the trigger and the failure: the break of the counter-slope line is the entry event, the opposite edge is the invalidation, and a pattern that drifts past its apex without breaking has usually spent its energy.
How traders use it
- As a continuation entry: a falling wedge forming as a pullback in an uptrend (or a rising wedge in a downtrend) is traded on the break of the counter-slope line, with a stop beyond the wedge's far edge.
- As an exhaustion warning: a rising wedge advancing on shrinking range and volume late in a trend is a common cue to tighten stops rather than add exposure.
- As a shape filter against triangles: converging lines that slope the same way make a wedge; a flat side or opposing slopes make a triangle, and the two carry different conventional biases.
- As a target framework: the height projection from the break serves as the base case, with the origin-retrace target held as the extended scenario for falling wedges that break with conviction.
- With candle confirmation at the line: an engulfing bar or pin bar printing at the boundary as it breaks, or on the retest of the broken line, upgrades a line-touch into a structured trigger with a defined stop.
Wedges vs related consolidation patterns
Triangles: Triangles converge with a flat side or opposing slopes and lean toward continuation; wedges converge while both lines slope the same way, and their conventional bias points against that slope. The slope agreement is the entire diagnostic difference.
Bull/Bear Flag: Flags drift against the trend between roughly parallel boundaries; wedges compress between converging ones. A falling wedge in an uptrend and a bull flag trade almost identically, but the wedge's narrowing range adds a coiled-spring element the flag lacks.
Double Top/Bottom: The double top reverses off a discrete rejected level with a neckline trigger; the rising wedge reverses out of a process, effort shrinking against progress, with a sloped-line trigger. One encodes a price the market refused twice, the other a trend running out of fuel.
Concept family
Chart & Candlestick Patterns
84 concepts mapped · 84 in the Library
Rising/falling Wedge FAQ
Turn Rising/falling Wedge into a trading strategy.
Take the implementation from this page into Quant, then build on it, backtest it on real data, and keep refining it in conversation.