Elliott Wave Theory — Pattern Rules Simplified
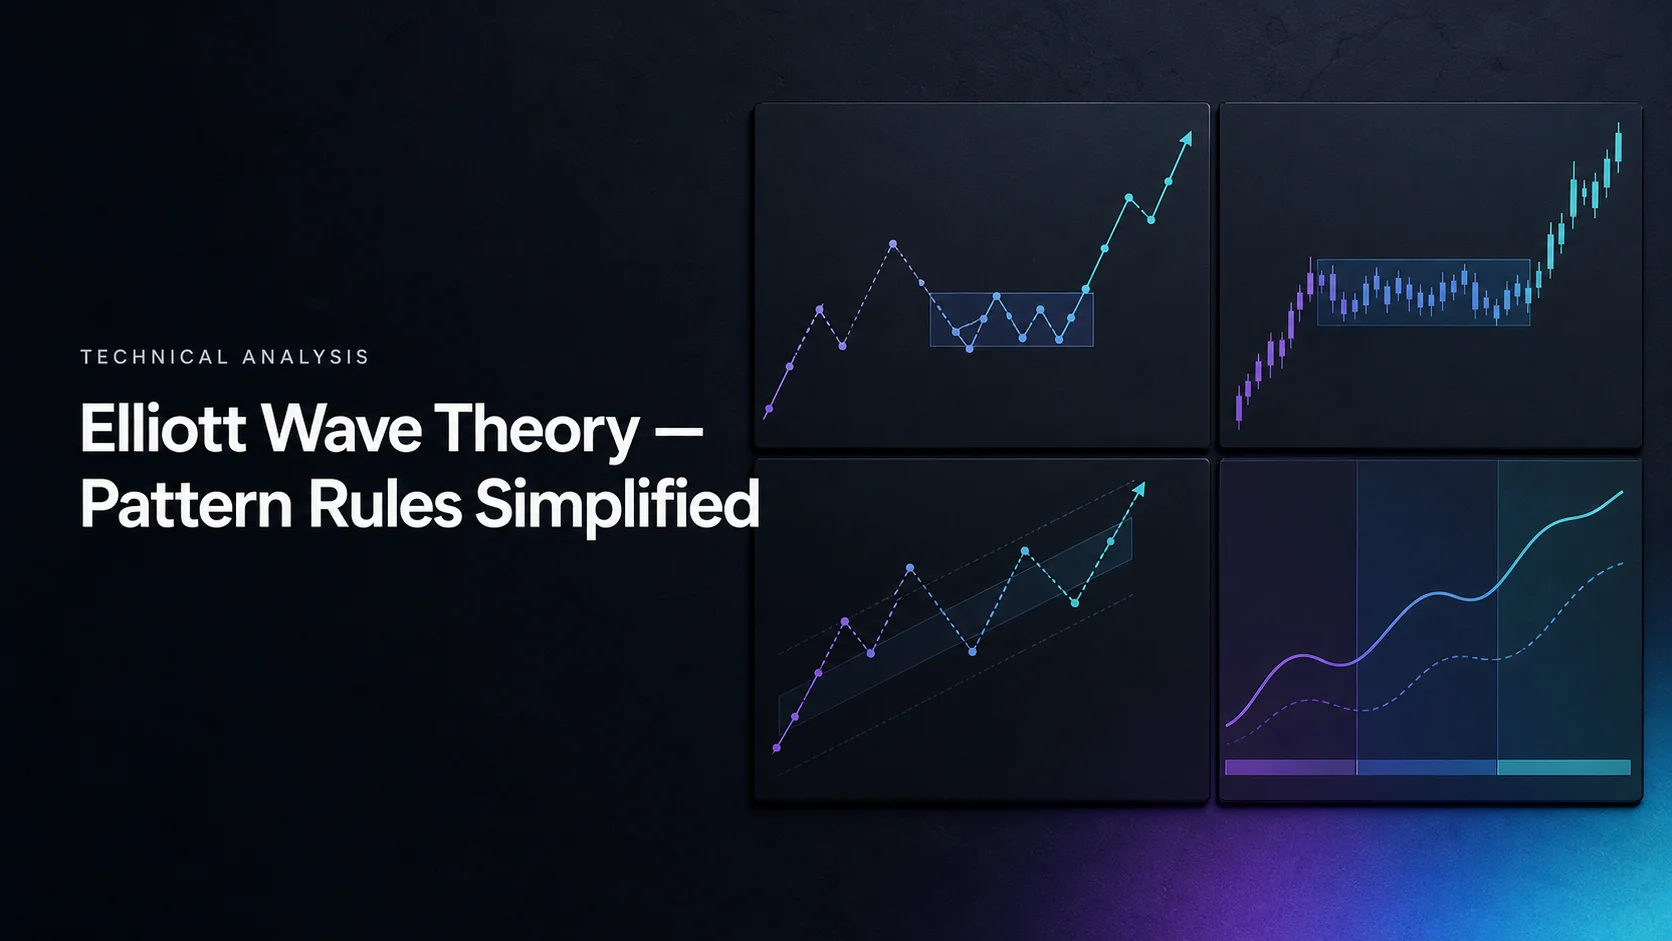
Elliott Wave Theory organizes price swings into a proposed hierarchy of motive and corrective waves. Its value is in building a scenario with clear invalidation levels. Several counts can fit the same chart, and a valid-looking pattern does not guarantee the next move.
LuxAlgo’s charting and AI platform helps you examine those scenarios on Quant Charts, inspect automated Library counts and develop explicit tests with Quant, our coding agent. Keep three things separate: the rules for a standard impulse, flexible Fibonacci guidelines and the particular rules implemented by an indicator.
Main Wave Pattern Types
5-Wave Motive Pattern
A motive sequence contains five waves at the chosen degree. In a standard impulse, waves 1, 3 and 5 move in the sequence’s direction, separated by corrective waves 2 and 4. A bearish impulse reverses the price direction; motive does not simply mean upward.
The familiar impulse subdivision is 5-3-5-3-5. A complete five-wave sequence can itself be a single wave at a larger degree. Wave degree describes the relationship between nested structures, not a fixed conversion such as “every daily wave equals one weekly wave.”
Corrective Patterns
| Pattern | Typical labeling or subdivision | Distinction |
|---|---|---|
| Impulse | 1–2–3–4–5; 5-3-5-3-5. | Subject to the three standard impulse rules below. |
| Diagonal | Five-wave motive structure. | A separate pattern with its own conditions, not permission to ignore an impulse violation. |
| Zigzag | A–B–C; 5-3-5. | A corrective structure, often relatively sharp. |
| Flat | A–B–C; 3-3-5. | A corrective structure with a different internal sequence. |
| Triangle | A–B–C–D–E. | Five corrective legs, so not every correction is a simple three-wave ABC. |
| Combination | W–X–Y or W–X–Y–X–Z. | Several corrective structures connected together. |
StockCharts’ pattern guide distinguishes these forms and their identification conditions. Leading diagonals can occur at the beginning of a larger move; ending diagonals occur near its completion. Do not relabel any overlapping sequence as a diagonal just to preserve a favored forecast.
A correction is defined relative to the trend one degree higher. Its component waves can move both with and against that trend. Counting only the most visually convenient swings can hide an invalid subdivision.
3 Main Elliott Wave Rules
1. Wave 2 Must Not Pass Wave 1’s Origin
For a bullish count beginning at $90 and ending wave 1 at $100, a second-wave move below $90 invalidates the proposed impulse. Reverse that logic for a bearish count. Specify how your implementation handles equality at the origin and tick precision rather than treating a rounded chart label as an exact price.
The commonly discussed 50% or 61.8% pullbacks are guidelines. A count is not automatically invalid because wave 2 stops at a different retracement that remains within the applicable rules.
2. Wave 3 Cannot Be the Shortest of Waves 1, 3 and 5
This does not require wave 3 to be the longest. Compare the absolute price distances of the three actionary waves on the same basis. Lengths of 10, 8 and 6 leave wave 3 longer than wave 5; lengths of 10, 6 and 8 make wave 3 the shortest and violate the rule.
Before wave 5 is complete, that comparison is partly unresolved. A developing count can later fail. Strong momentum or high volume may support an interpretation, but neither substitutes for the price-length rule or guarantees that wave 3 is the extended wave.
3. Wave 4 Must Not Enter Wave 1’s Price Territory in a Standard Impulse
For an upward wave 1 from $90 to $100, a proposed wave 4 entering that price territory breaks the standard impulse interpretation. This is a count invalidation, not proof that the entire market trend has reversed.
Diagonal rules differ because a diagonal is a separate motive pattern. The three impulse rules are not a universal description of every Elliott structure. Apply the conditions for the pattern actually being claimed.
Fibonacci Guidelines: Measure from Explicit Anchors
The LuxAlgo Elliott Wave concept guide treats counts as working hypotheses and distinguishes hard rules from softer relationships. Common reference ratios include 0.382, 0.618 and 1.618. The 50% retracement is a widely used convention, although it is not itself a Fibonacci ratio.
For an upward leg from A to B, a retracement of proportion r is B − r × (B − A). A projection of that leg from a later low C is C + r × (B − A). Naming the ratio without its anchors is incomplete.
Wave 2 is often examined near half or 61.8% of wave 1; wave 3 may be projected using 1.618 times wave 1 from wave 2’s end. Wave 4 retracements and possible wave 5 equality relationships provide further reference levels. None is a required destination or a probability estimate.
Market Analysis Example
Consider this hypothetical bullish sequence. It is arithmetic for checking a proposed count, not a historical trade or a forecast:
| Leg | Prices | Measurement |
|---|---|---|
| Wave 1 | $90 → $100. | $10 advance. |
| Wave 2 | $100 → $95. | $5 pullback, or 50% of wave 1. |
| Wave 3 | $95 → $111.18. | $16.18 advance, or 1.618 times wave 1. |
| Wave 4 | $111.18 → $105. | $6.18 pullback, about 38.2% of wave 3; remains above $100. |
| Wave 5 | $105 → $115. | $10 advance, equal to wave 1 in this example. |
The actionary lengths are $10, $16.18 and $10, so wave 3 is not shortest. Wave 2 stays above the origin and wave 4 stays outside wave 1’s territory. Internal subdivisions and recognition timing would still need checking; five convenient endpoints alone do not prove a complete Elliott count.
If projecting 138.2% of the $10 first wave from $95 instead, the level is $108.82—not $108.20. A price of $108.20 corresponds to a 132% projection from that anchor. Always calculate the distance before attaching a Fibonacci label.
Wave 5 also need not always set a new extreme: a truncated fifth is a recognized case requiring its own structural evidence. Do not move targets or rename waves after every adverse price change to make the scenario appear successful.
Time Scale Analysis
A practical review might use weekly bars for the larger scenario, daily bars for a candidate count and four-hour bars for a defined trigger. Select the hierarchy before reviewing the outcome. More timeframes can add conflicting information rather than automatically increasing accuracy.
Keep alternative counts and their invalidation levels visible. If the daily count changes, record what changed and when. A lower-timeframe pattern does not override a larger scenario merely because it offers an attractive entry.
LuxAlgo Elliott Wave Indicator
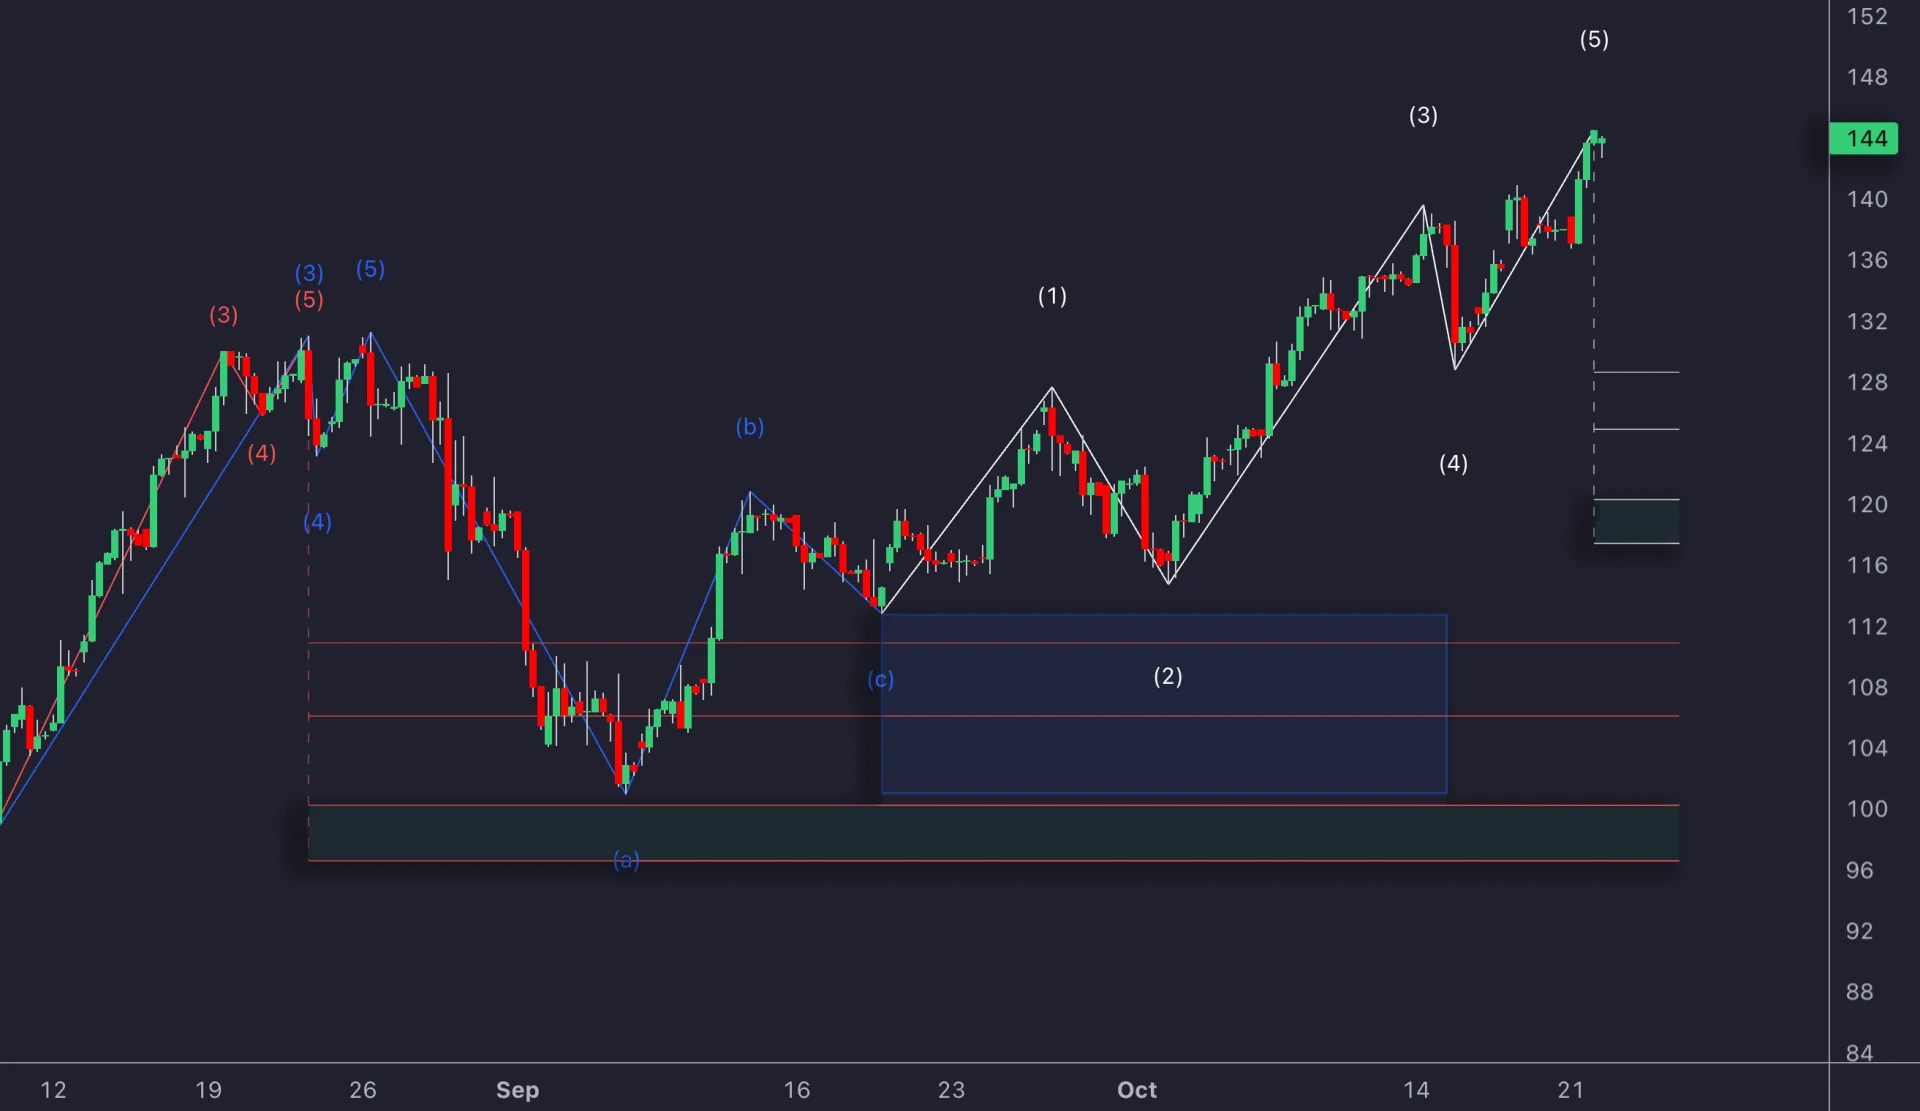
The current Elliott Wave Library tool labels five-wave sequences and A–C corrections from ZigZag pivots, with Fibonacci retracement areas following a detected count. It is an implementation of selected rules, not an exhaustive solver for every diagonal, triangle or complex correction.
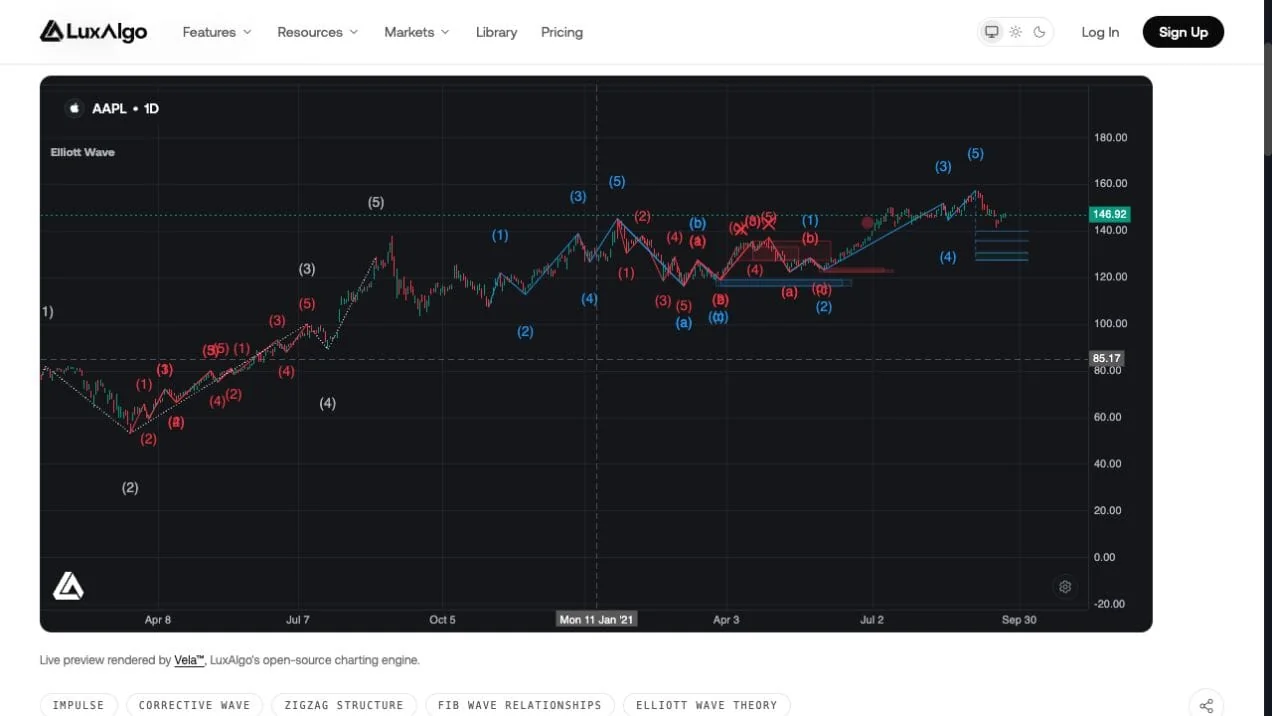
The documented upper pivot source can use high, close or the maximum of open and close; the lower source can use low, close or the minimum of open and close. ZigZag length changes the swings that qualify. Record these choices when comparing a manual count with the tool.
Invalidated motive counts become dotted, corrective counts dashed, and a red cross identifies a breach of the relevant lower box. Colored circles mark fresh highs against drawn levels; they should not all be described as generic pattern-confirmation signals.
The Library documentation lists notifications for new motive and corrective patterns, invalidations and a possible new motive wave. Configure and verify the supported alert event in the edition you use. This does not establish an integrated multi-asset Elliott Wave screener or automatic order execution.
Pivot Timing and Changing Counts
A pivot is recognized using a particular rule, and its displayed label can sit on an earlier bar. That displayed location is different from the first bar on which the rule could confirm it. Record both timestamps before testing an entry.
New extremes and later price action can update a count or invalidate it. A screenshot of the final chart hides that development. Review sequential bars and retain failed candidates rather than measuring success only from patterns that remain visible.
Testing Wave Analysis with Quant
Use Quant, our coding agent, to define a reproducible experiment. For example:
Create a strategy study that records both each pivot’s original bar and its confirmation bar. Use an explicit pivot algorithm and inputs. Log proposed five-wave impulse counts, their rule checks and later invalidations. Permit entries only after the required completed-bar confirmation, never at an earlier pivot using future information. Include one-position limits, a structural stop, sizing, commission and slippage.
Inspect the generated code and run it manually, following Making Strategies with Quant. Check whether it reproduces your chosen detector or defines a different one. The native strategy viewer helps review fills and trade logs; it does not certify an Elliott count as the uniquely correct interpretation.
A planned $100 risk budget with an entry at $106 and stop at $104 permits 50 shares before costs. A $110 target is 2R. If a gap produces a $103 fill at the stop, the loss is $150 before costs. Count invalidation and execution risk need separate treatment.
Test unseen periods with settings fixed beforehand. Report the number of candidate counts, invalidations, trades, net expectancy and drawdown. Excluding invalidated counts or changing the pivot length after seeing results can exaggerate apparent performance.
Manual vs. Tool-Assisted Analysis
| Task | Manual review | Tool-assisted review |
|---|---|---|
| Choose the scenario | Identify the degree, anchor and alternative count. | Inspect the algorithm’s selected pivots and supported pattern types. |
| Apply rules | Measure lengths and check overlap consistently. | Check implementation choices and rejected or invalidated patterns. |
| Review timing | Record when each swing became recognizable. | Separate plotted pivot time from confirmation time. |
| Evaluate trades | Write entry, stop and exit conditions before the outcome. | Run an explicit strategy and inspect actual simulated fills. |
The tool can reduce repetitive labeling and calculation, while the trader still needs to assess context and implementation limits. Community examples and documentation can help explain settings, but testimonials are not evidence of expected returns.
Native Library tools, TradingView editions and legacy backtesting workflows have different roles. Verify the edition being used rather than assuming that an Elliott study connects to every screener or automatically validates a profitable strategy.
Elliott Wave Theory: Three Basic Rules Tutorial
The retained tutorial provides another explanation of the core rules. Apply those rules to standard impulses and keep the pattern-specific exceptions and timing considerations above in view.
Frequently Asked Questions
How can traders use Fibonacci ratios with Elliott Wave Theory?
Use explicit anchors to calculate candidate retracement and projection levels. Ratios are guidelines, not required destinations or proof of a valid count.
What are common Elliott Wave analysis mistakes?
Forcing a preferred count, confusing impulse rules with guidelines, miscalculating projection anchors and using later-confirmed pivots as if they were known earlier.
How can LuxAlgo help with Elliott Wave analysis?
The Library tool automates selected counts from pivots and displays retracement areas and invalidations. Inspect its settings and timing; it does not establish a unique correct count or guaranteed trade.
Must wave 3 be the longest wave?
No. It cannot be the shortest of waves 1, 3 and 5. It can be shorter than wave 1 if wave 5 is shorter still.
Are all corrections three-wave ABC patterns?
No. Zigzags and flats use ABC labels, while triangles and combinations have other structures.
Can a historical wave label be used as an entry timestamp?
Not automatically. Identify the bar when the pivot or pattern became confirmed and use only information available at that time.
References
LuxAlgo Resources
- Elliott Wave Native Library Tool
- Elliott Wave Theory Concept Guide
- LuxAlgo Quant
- Making Strategies with Quant
- Native Strategy Backtests
External Resources
Read next