Concept
Elliott Wave Theory
Elliott Wave Theory, also known as Elliott waves, the wave principle, Elliott wave analysis, is a Elliott & Harmonics concept. The Library holds 1 implementation, a working definition you can pull into Quant.
Top Elliott Wave Theory indicator
The top custom implementation, built on the original standard Elliott Wave Theory formula.
1 total
From studying Elliott Wave Theory to trading it: take the implementation below into Quant and backtest it instantly.
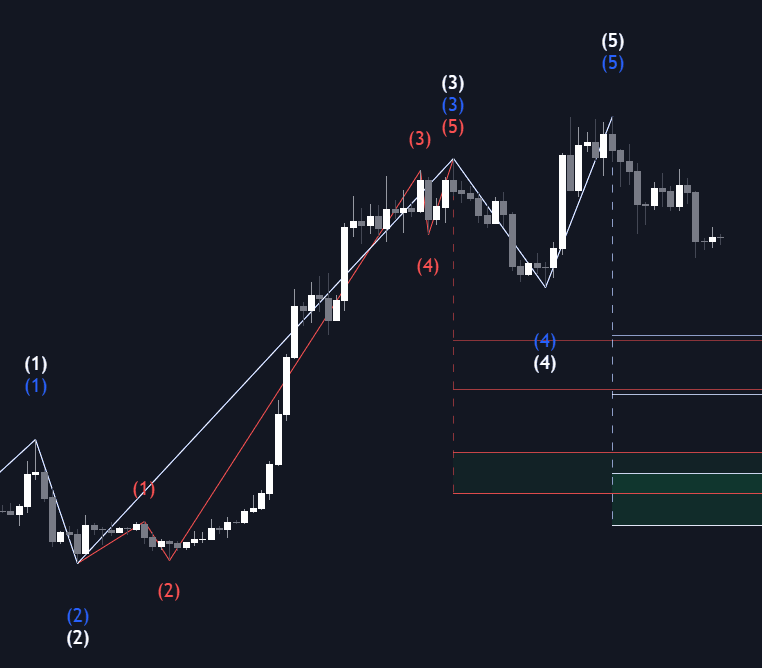
What is Elliott Wave Theory?
Elliott Wave Theory is a branch of technical analysis built on the idea that crowd psychology moves markets in recognizable, repeating wave patterns. It was developed in the 1930s by Ralph Nelson Elliott, an American accountant who took up the study of decades of US stock market data after illness forced him to retire. He published The Wave Principle in 1938 with backing from investment counselor Charles J. Collins, wrote a series of Financial World articles in 1939, and expanded the ideas in Nature's Law (1946). After his death in 1948 the theory survived mainly through a small circle of followers, most visibly Hamilton Bolton of the Bank Credit Analyst, and it reached most modern traders through A.J. Frost and Robert Prechter's 1978 book Elliott Wave Principle.
The core model is a five-three cycle. Price advances in five waves in the direction of the larger trend, labeled 1 through 5, then corrects in three waves labeled A, B and C. The five-wave phase is a motive wave, most often taking the stricter impulse form, and the three-wave phase is a corrective wave. Elliott's defining claim is that this structure is fractal: each wave subdivides into smaller waves of the same design, and every completed cycle becomes one leg of a larger one. He catalogued nine degrees of trend, from the Grand Supercycle spanning decades or more down to the Subminuette on very short intraday timeframes.
Wave counting is disciplined by a short list of hard rules that can invalidate a count outright, most famously that wave 2 may never retrace beyond the start of wave 1, and by softer guidelines such as alternation between corrections and channeling. Measurement comes from Fib wave relationships: Elliott pointed out in Nature's Law that the cycle's wave counts (5 and 3, summing to 8, with deeper subdivisions of 34 and 144) are Fibonacci numbers, and modern analysts project wave targets with retracement and extension ratios such as 0.618 and 1.618.
Elliott Wave Theory is best treated as a framework for organizing price action, not a mechanical signal system. Its weaknesses are well documented: wave counts are subjective, several labelings can be valid at the same time, and counts are often revised after the fact, which invites hindsight bias. No broadly accepted statistical study has validated its forecasts, and its predictive record is contested even among technical analysts. Serious practitioners respond by treating counts as probabilistic scenarios with explicit invalidation levels rather than as predictions.
How to identify Elliott waves on a chart
A wave count is a working hypothesis, not a fact, so the goal is to label one degree of trend cleanly and then let the rules confirm or kill the label. On a liquid market and a clean chart, the process looks like this.
- 1Anchor the count at an obvious turning point: a major swing high or low where the prior trend clearly ended, on the timeframe you actually trade.
- 2Look for five waves in the trend direction: three pushes (waves 1, 3 and 5) separated by two pullbacks (waves 2 and 4), with wave 3 often the strongest and longest push.
- 3Check the hard rules: wave 2 must not retrace past the start of wave 1, wave 3 cannot be the shortest of the three pushes, and wave 4 must not enter wave 1's price range in a standard impulse.
- 4After a completed five, expect a corrective phase against the trend, classically a three-wave A-B-C zigzag or flat, sometimes a triangle or a combination of simpler forms; the guideline of alternation says nearby corrections of the same degree, most reliably waves 2 and 4, tend to take contrasting forms.
- 5Cross-check proportions with Fibonacci: commonly cited tendencies include wave 2 holding the 0.5 to 0.618 retracement of wave 1, and wave 3 running near 1.618 times wave 1. Treat these as tendencies, not requirements.
- 6Write down the exact price that invalidates the count, keep at least one alternate labeling, and abandon the count the moment a rule breaks instead of defending it.
How traders use it
- Mapping trend maturity: analysts place the current move inside a larger count to judge whether a trend is young (early in wave 3) or aging (wave 5), and adjust exposure accordingly.
- Timing entries on corrections: wave 2 and wave 4 pullbacks inside an impulse are the classic entry zones, usually located with the standard harmonic and Fib ratio set.
- Placing objective stops: because the hard rules state exactly where a count dies, invalidation levels double as stop-loss levels, which is arguably the theory's most concrete practical feature.
- Projecting targets: Fibonacci extensions relate waves 3, 5 and C to earlier waves, and an equal-legged A-B-C is effectively the same measured move as the harmonic ABCD pattern.
- Automating and confirming counts: rules-based scripts such as LuxAlgo's Elliott Wave indicator attempt automatic labeling, while the Elliott Wave Oscillator, the difference between a 5- and a 35-period moving average, is used to flag the momentum peak analysts associate with wave 3.
Elliott Wave Theory vs neighboring frameworks
Harmonic Patterns: Both lean heavily on Fibonacci ratios. Harmonic patterns descend from the pattern H.M. Gartley published in his 1935 book Profits in the Stock Market, with the defining Fibonacci ratios attached later by analysts such as Larry Pesavento and Scott Carney; they are fixed five-point reversal shapes that complete in a defined zone. Elliott instead describes an open-ended trend cycle in which ratios are tendencies and the count evolves as new bars print.
ABCD: The harmonic ABCD is a standalone measured-move pattern whose CD leg mirrors the AB leg. Elliott's A-B-C label looks similar on a chart but means something different: it marks the corrective phase inside a larger wave count, and its legs carry no equality requirement.
Fib Wave Relationships: Less a rival than the theory's measurement layer. This concept collects the specific ratio tendencies, such as wave 2 retracing 0.5 to 0.618 of wave 1, that turn a qualitative wave count into concrete price zones for entries and targets.
Concept family
Elliott & Harmonics
33 concepts mapped · 33 in the Library
Elliott Wave Theory FAQ
Turn Elliott Wave Theory into a trading strategy.
Take the implementation from this page into Quant, then build on it, backtest it on real data, and keep refining it in conversation.