Concept
Profit Target Taxonomy
Profit Target Taxonomy, also known as fixed-R, measured move, fib extension, structure target, is a Risk, Sizing & Exits concept. The Library holds 5 implementations, each one a working definition you can pull into Quant.
Top Profit Target Taxonomy indicators
The top custom implementations, built on the original standard Profit Target Taxonomy formula.
5 total
Any of the 5 Profit Target Taxonomy implementations below can become a backtested trading strategy — describe your rules and Quant writes the code.
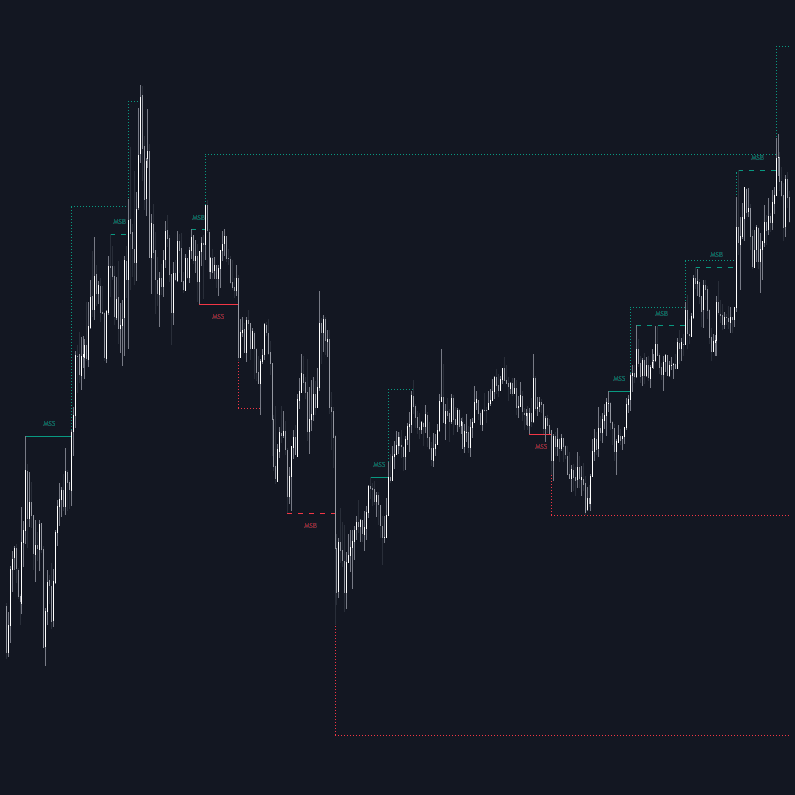
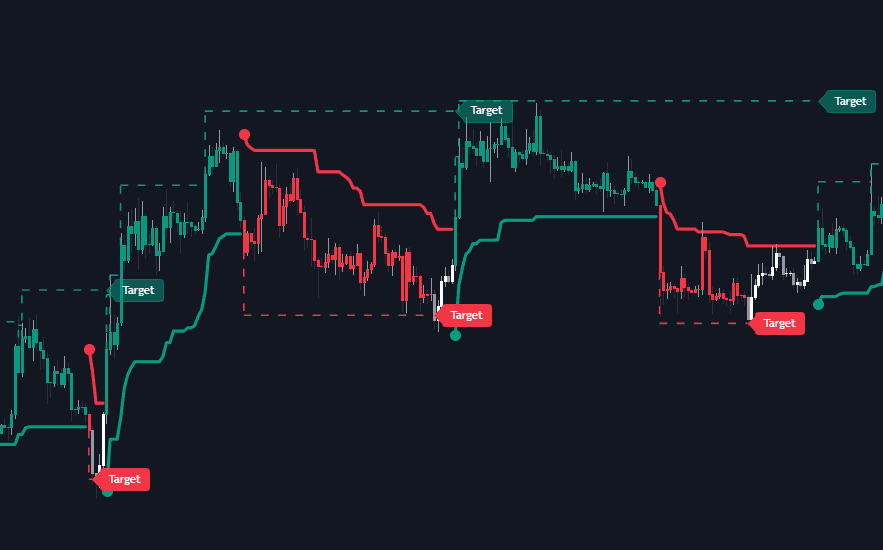
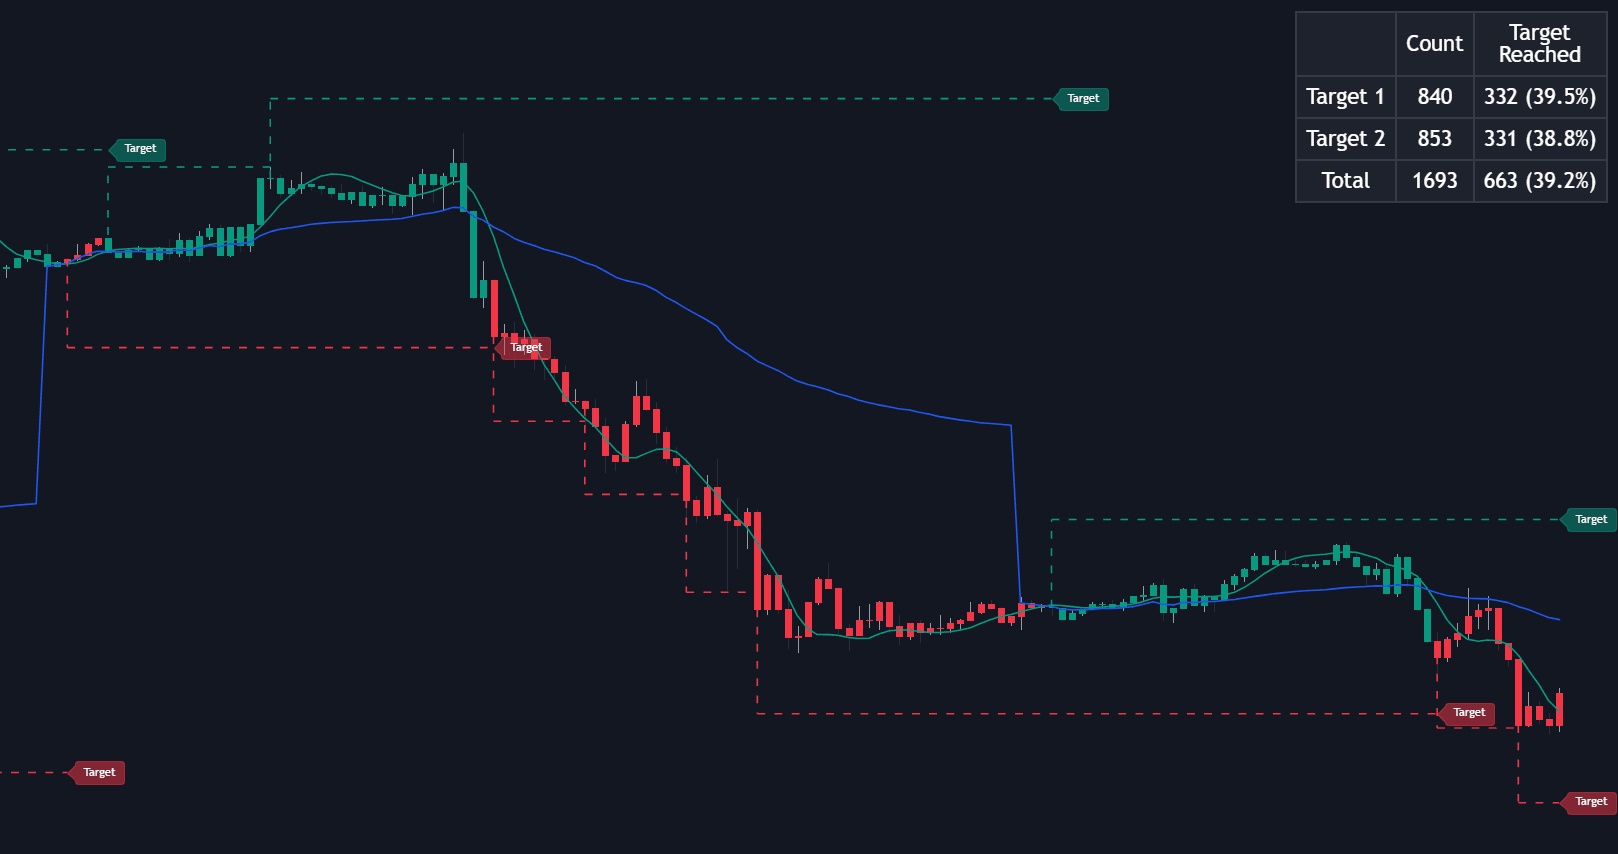
What is a Profit Target Taxonomy?
A profit target taxonomy classifies take-profit rules by what the target level is anchored to. Nearly every published target reduces to one of four anchors: the trade's own risk (fixed multiples of the entry-to-stop distance, the R-multiple framework), pattern geometry (the measure rule and Fibonacci extensions that project a prior leg forward), chart structure (prior swings, prior period levels, unfilled gaps), or resting liquidity (the order pools assumed beyond equal highs and lows).
Each anchor carries an assumption. Risk-anchored targets ignore the chart entirely: 2R is 2R wherever it lands, which standardizes measurement but can park the exit just past a level where price habitually stalls. Geometry targets assume the next leg will resemble the last. Structure and liquidity targets assume price is drawn toward visible reference points where opposing orders wait (liquidity pools, old highs and lows). Hybrid schemes split the position across several anchors instead of betting on one.
The taxonomy matters because the target sets the reward half of expectancy. A target closer than one multiple of risk demands a better-than-even win rate just to break even; a distant geometric target flips that arithmetic while lowering the hit rate. Naming the anchor first, then checking the reward-to-risk it implies, keeps that trade-off explicit and guards against the common failure of back-fitting a target to justify an entry.
How to classify a profit target
Any take-profit rule can be located in the taxonomy with four questions.
- 1Find the anchor. Is the level derived from trade risk (a multiple of entry-to-stop), a projected leg (measured move, extension), chart structure (prior swing, level, gap), or liquidity (equal highs or lows, session extremes)?
- 2Check whether it is static or dynamic: fixed at entry, or recomputed as structure evolves, such as retargeting each newer swing high while the trade is open.
- 3Check the execution scheme: all-out at a single level, or scaled across several anchors with a runner trailed behind.
- 4Compute the reward-to-risk each target implies and the win rate needed to break even at it; that number, not the target's story, is what evaluates the scheme.
How it's calculated
The standard families of profit-target placement, each defined by how the exit price is computed before the trade is entered.
Targets from different families that land near the same price reinforce each other, and many playbooks require at least two to agree.
Scale-out plans mix families, for example a partial exit at a fixed 1R with the remainder held for a measured move or structure level.
How traders use it
- Fixed-R targets standardize journaling and backtesting: when every exit is expressed in multiples of initial risk, results are comparable across instruments and volatility regimes.
- Geometry targets serve continuation trades: the measure rule projects a pattern's height from its breakout, and extensions of the prior swing (ratios such as 1.272 and 1.618 are the common choices) mark candidate exhaustion zones.
- Structure and liquidity targets fit range and liquidity-based trades: the opposite side of the range, the prior day's high, or the pool resting beyond equal highs offers likely opposing flow to exit into (draw on liquidity).
- Scaling across families is the common hybrid: a partial exit at near structure, another at a fixed R multiple, and the remainder handed to a trailing stop, so no single assumption carries the whole trade.
Profit Target Taxonomy vs related concepts
Trailing Method Taxonomy: The mirror-image half of exit design. Targets exit into strength at a predefined level; trails follow behind and exit into weakness after the turn, keeping the right tail at the cost of giveback.
R-multiple Framework: The measuring system, not a target type: it expresses any exit, including structure or liquidity targets, in multiples of initial risk. Fixed-R targets are the special case where the measure is also the anchor.
Scaling Out: An execution scheme laid over the taxonomy rather than a member of it: exits are distributed across several target anchors instead of committed to one.
Measure Rule: The classical-charting member of the geometry family: project the pattern's height from the breakout point. The taxonomy places it alongside Fibonacci extensions and swing projections that formalize the same symmetry assumption.
More Profit Target Taxonomy implementations
Concept family
Risk, Sizing & Exits
37 concepts mapped · 37 in the Library
Profit Target Taxonomy FAQ
Turn Profit Target Taxonomy into a trading strategy.
Take any implementation from this page into Quant, then build on it, backtest it on real data, and keep refining it in conversation.