How Volume Confirms Breakouts in Trading
Volume can support a breakout signal by showing how much trading activity accompanied the price move. It cannot prove that the move will continue. A useful confirmation rule compares equivalent volume data, defines when an entry becomes eligible, and survives testing after costs.
Use LuxAlgo’s native charts to examine the level and activity together, then work with Quant to test whether a volume filter improves the underlying breakout strategy. Candlestick patterns, On-Balance Volume (OBV), and Chaikin Money Flow (CMF) can add context, but each measures something different.
What Volume Confirmation Actually Means
A breakout is a move beyond a defined support, resistance, or range boundary. Decide whether your rule requires a trade through the level, a completed candle close, or a retest. High volume means more reported activity against a chosen baseline; it is not a direct measure of confidence, institutional identity, or the probability of success.
Compare High and Low Volume Consistently
For a daily example, divide the completed breakout day’s volume by the average of the previous 20 completed sessions, excluding the signal day. A ratio of 1.5 means 150% of average, or 50% above average. By contrast, 150% above average means 2.5 times average. These descriptions should never be used interchangeably.
| Volume ratio | Equivalent description | Interpretation |
|---|---|---|
| 0.5 | 50% of average; 50% below average | Lower activity against this baseline |
| 1.5 | 150% of average; 50% above average | Higher activity, without a guaranteed outcome |
| 2.0 | 200% of average; 100% above average | Twice the comparison volume |
| 3.0 | 300% of average; 200% above average | Three times the comparison volume |
There is no universal 1.5, 2, or 3 times threshold that separates real breakouts from false ones. Test any threshold on the instrument, timeframe, and session you intend to trade. Intraday, compare corresponding times of day where appropriate; do not compare an unfinished morning session with a full day. The Relative Volume at Time documentation explains regular versus cumulative time-matched comparisons.
Volume Spikes and Divergence
A spike can accompany a range break, a news reaction, an auction, or exhaustion. Examine where price closes and whether it subsequently holds the level. Follow-through is information that arrives later, so it cannot be used retrospectively to justify an earlier entry.
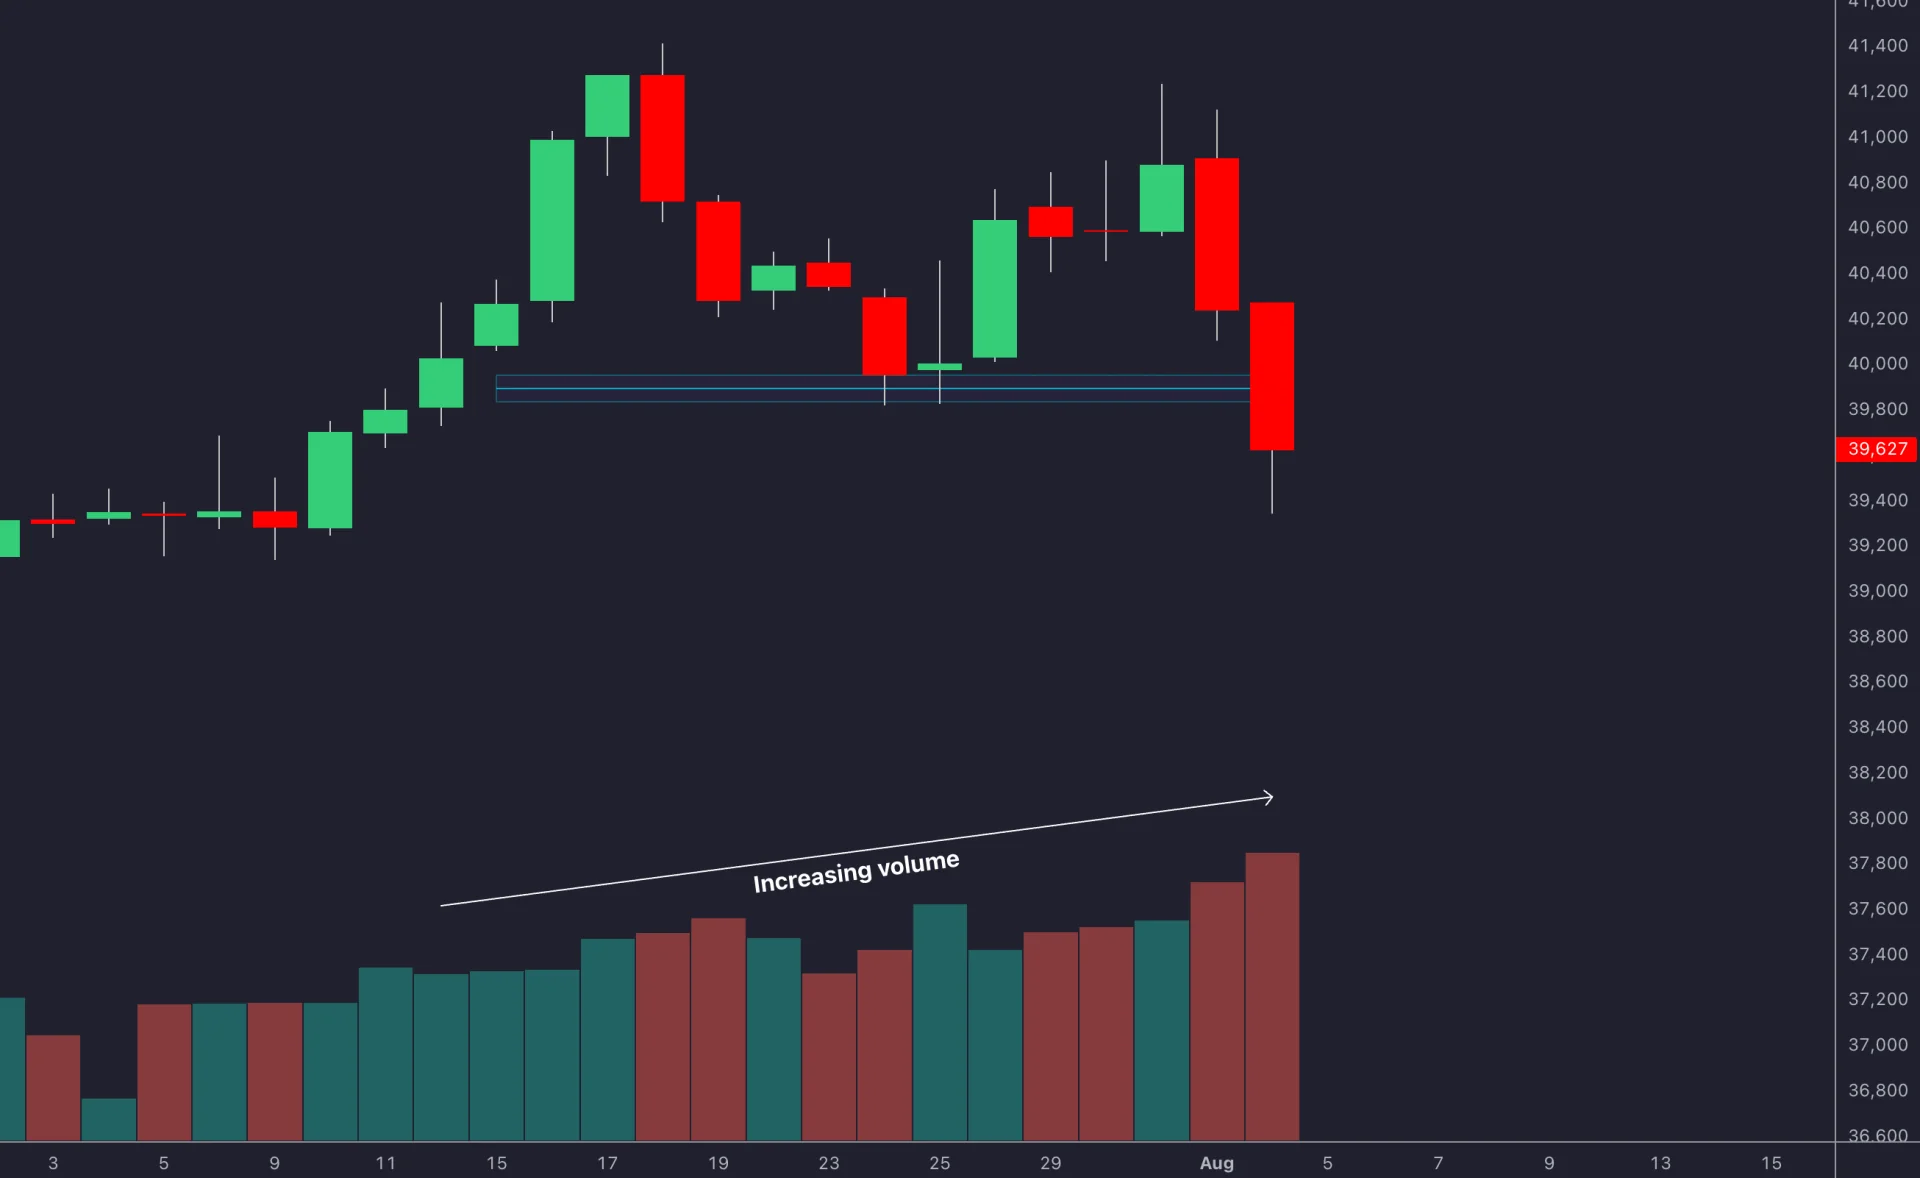
Price making higher highs while volume or OBV weakens is a divergence worth investigating. It is not an automatic reversal signal. Conversely, falling price with increasing activity may accompany a downside breakout, but volume alone does not establish a short entry or dictate a tighter stop.
Combine Volume with Candlestick Patterns
Candlesticks describe the price action around a level. Keep the pattern definition separate from the volume filter. A reversal pattern near support is not automatically a breakout through overhead resistance.
| Pattern | Price structure to identify | Breakout question |
|---|---|---|
| Bullish engulfing | A bullish real body engulfs the preceding bearish real body, typically after a decline | Did the pattern also close above your premarked resistance? |
| Hammer | A small real body near the top of the range and a long lower shadow after a decline | Is this only a rejection at support, or has a separate entry level been broken? |
| Three white soldiers | Three advancing bullish candles with substantial bodies, commonly following a decline or base | Does entry still offer acceptable risk after the advance? |
| Doji | Open and close are close together | Does the surrounding structure clarify the signal, or is price still undecided? |
There is no inherent 150%, 200%, or 250% volume requirement for these patterns. If you add one, specify the baseline and test it. Heavy volume on a doji can be informative rather than an automatic reason to discard the setup; a quiet engulfing pattern likewise needs context. For more on defining candle-based setups, see candlestick pattern risk management.
Use OBV, CMF, and VWAP for Different Questions
On-Balance Volume
OBV adds the bar’s volume when its close is above the previous close, subtracts it when the close is lower, and leaves the total unchanged on an equal close. It is cumulative and works in chart bars, not only daily sessions. Compare its direction or swings with price; the absolute starting value is less useful.
OBV assigns all of a bar’s volume according to the closing-price change. It does not count actual aggressive buying and selling separately, and a tiny price change can classify a large bar’s entire volume.
Chaikin Money Flow
CMF weights volume by where the close sits within each bar’s high-low range, then divides the sum of weighted volume by total volume over the lookback. Common lookbacks are 20 or 21 bars; daily bars make these daily periods.
Positive readings mean the weighted closes favor the upper parts of their ranges; negative readings favor the lower parts. A +0.20 reading is not a universal buy signal. CMF can remain positive on a gap-down bar that closes near its own high because its multiplier does not compare that range with the previous close. It is a price-volume proxy, not measured cash entering or leaving the asset.
VWAP and Volume Profile
VWAP weights a selected price source by volume over an anchored window. Volume Profile distributes activity across price levels. Use them to understand context around your range boundary, without assuming a VWAP cross or a high-volume node guarantees support.

LuxAlgo’s native Volume Profiles include candle-based Visible Range and footprint-based Session and Rolling profiles. Visible Range changes with the displayed chart range; its up/down candle coloring is not the same as aggressor-side volume. Check supported data before choosing a footprint-based profile.
A Practical Breakout Workflow
- Mark the level first. Define the range using bars available before the signal, so the boundary cannot move to fit a winning example.
- Choose the trigger. Specify a completed close beyond resistance or support, or an explicit intrabar or retest rule.
- Measure comparable activity. Use the same venue, instrument, session, and volume units. Treat missing data separately from low activity.
- Set the exit and size. Define invalidation, estimated costs, and a risk budget before placing an order.
- Compare results. Test the basic breakout against the same rules with the volume filter. Include losing trades and missed opportunities.
Hypothetical Trade and Position Size
Suppose resistance is $100, the completed signal close is $101, and volume is 150,000 shares against a prior-session average of 100,000. Relative volume is 1.5. If the chosen rule enters next session, use the actual modeled next entry price rather than assuming the signal close was available as a fill.
Assume that entry is $101, the planned stop is $98, and the risk budget is $300. With $0.15 per share allowed for estimated costs and adverse execution, planned risk is $3.15 per share. Floor($300 ÷ $3.15) gives 95 shares, or $299.25 planned risk. A $107 target gives $6 potential reward against $3 price risk: 2:1 before costs. Neither the volume ratio nor that reward-to-risk ratio predicts the outcome.
A stop can fill beyond its trigger in a gap or fast market. An ATR-based or swing-based trailing rule can tighten the planned exit, but cannot guarantee locked-in profits. If adding to the trade, recalculate total exposure and risk across all entries. A risk percentage is distinct from the percentage of account capital used to buy the position. See the SEC stop-order explanation and LuxAlgo’s volume and high-volatility breakout guide.
Test Volume Confirmation with Quant
In LuxAlgo’s charting workspace, use Quant to build the explicit range, volume, and exit rules. Ask for adjustable inputs and inspect the generated code before running it. Adding several indicators does not automatically improve confirmation; OBV and CMF already reuse price and volume information.
Use native strategy properties and results to model commission and slippage, inspect trades, and compare net performance and drawdown alongside win rate. Keep a later period for validation and test nearby thresholds to see whether the apparent benefit depends on one precise setting. Successful code execution is not proof of a trading edge.
The LuxAlgo Library remains a resource for indicator implementations. Check each indicator’s supported platform rather than assuming every TradingView toolkit is available natively. A chart-based volume study, an AI-generated backtest, and a broker-executed order are distinct parts of a workflow.
Video: Comparing Volume at the Same Time of Day
This Trade Nation + TradingView tutorial explains a time-matched volume comparison on TradingView. Use it to understand the measurement; the demonstrated interface is separate from LuxAlgo’s native platform.
FAQs
How do you confirm trend breakouts?
Define a price level and entry trigger, then assess volume against an equivalent historical baseline. Candlesticks and indicators can provide context, but no combination guarantees continuation. Test the exact rules, costs, and exits rather than treating an RSI level or volume percentage as universal confirmation.
Should you look at the volume in a price breakout?
Yes, when the data is meaningful for the instrument. Volume helps describe participation, but high activity can accompany failed breakouts too. Check the feed, session, and comparison window, and determine whether a volume filter improves your strategy on separate validation data.
References
Read next